U.S. Department of Transportation
Federal Highway Administration
1200 New Jersey Avenue, SE
Washington, DC 20590
202-366-4000
Freight Economy
Date: May 4, 2016
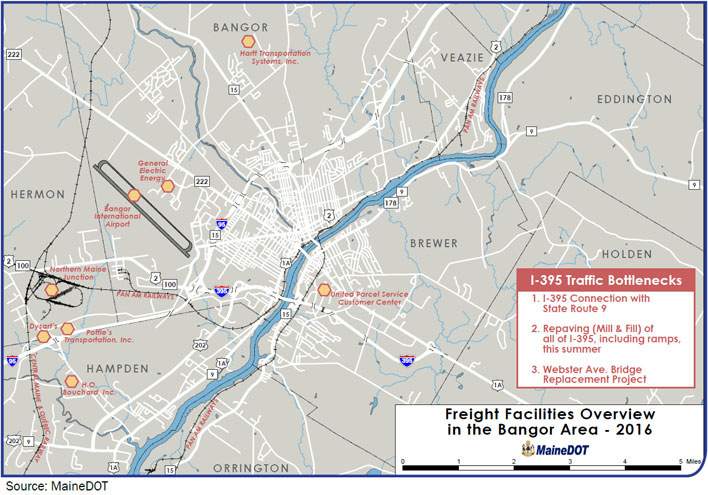
Our Host: Bangor Regional Chamber of Commerce, Bangor Area Comprehensive Transportation System, Maine DOT
| HIGHWAYS | I-95 , I-395 | |
| RAILROADS | Central Maine and Quebec Railroad,Pan Am Railways, Northern Maine Junction | |
| AIRPORTS | Bangor International Airport | |
| FREIGHT GENERATORS | General Electric, Old Town Canoe, UPS |
"Maine" FAF zone - Data represents freight activity for State of Maine
| Commodity | Value (millions $) | % of total |
|---|---|---|
| Mixed freight | 18,082 | 14% |
| Machinery | 12,134 | 10% |
| Natural gas (Coal-n.e.c.) | 8,498 | 7% |
| Electronics | 8,355 | 7% |
| Misc. mfg. prods. | 6,886 | 6% |
| All commodities | 125,121 | 100% |
| Commodity | Tons (thousands) | % of total |
|---|---|---|
| Misc. mfg. prods. | 21,446 | 17% |
| Other foodstuffs | 17,921 | 14% |
| Logs | 14,581 | 11% |
| Natural gas (Coal-n.e.c.) | 12,326 | 10% |
| Wood prods. | 8,211 | 6% |
| All commodities | 127,993 | 100% |
| Trade partner | Tonnage | % of total |
|---|---|---|
| New Hampshire | 6,935 | 20% |
| Canada | 4,866 | 14% |
| New York | 4,701 | 14% |
| Massachusetts | 3,911 | 11% |
| New Jersey | 3,908 | 11% |
| Total outbound | 34,032 | 100% |
| Trade partner | Tonnage | % of total |
|---|---|---|
| Canada | 9,584 | 33% |
| New Hampshire | 6,059 | 21% |
| Massachusetts | 3,144 | 11% |
| Connecticut | 1,867 | 6% |
| New York | 1,142 | 4% |
| Total inbound | 29,396 | 100% |
Based on FAF4.1 data with base year 2012 and forecasts up to 2045
In 2014, Maine's GDP was $54.3 billion, ranked 46th in the United States. Bangor's GDP was 10% of the state's GDP
More than 40% of the Penobscot County, Maine's employment is from freight-intensive industry sectors.
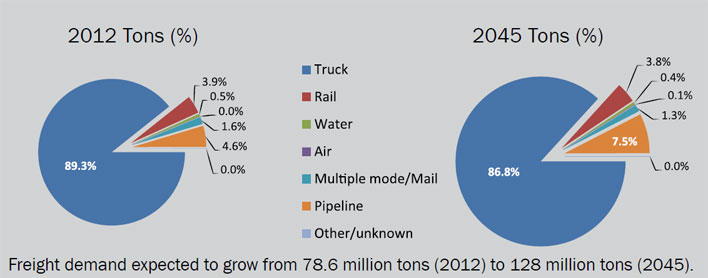
Between 2012 and 2045, Maine will see freight activity grow by about 70% in value and 60% in tonnage.
Maine's domestic freight activity share was 91% in 2012, and the state is expected to maintain that share in 2045.
About 40% of all outbound freight by value from Maine ends up in Massachusetts, New Hampshire, and New York State.
Maine's share of international freight was 10% in 2012 and is expected to grow to 15% in 2045.
Trucks are – and will likely continue to be – the most dominant freight carrier mode in Maine, carrying about 90% of freight tonnage.
Four counties in Maine (Cumberland, Penobscot, York, and Somerset) accounted for more than half of all inbound and outbound freight flows in the state.
Two rail systems, Pan AM Railways and the Central Maine and Quebec Railway (CMQR), provide freight rail connections from Bangor to the rest of the United States and to Canada.
By far the primary Maine truck route, as measured by truck annual average daily traffic (AADT), is the Interstate 95/295 north-south corridor between Bangor and Kittery, Maine.
Sources for Freight Facts: FAF4 Data, BEA, Maine Integrated Freight Study, BACTS LRP 2011-2035
To view PDF files, you can use the Adobe® Reader®.

