U.S. Department of Transportation
Federal Highway Administration
1200 New Jersey Avenue, SE
Washington, DC 20590
202-366-4000
Freight Economy
Date: May 3, 2016
Our Host: Greater Boston Chamber of Commerce
| HIGHWAYS | I-93, I-95, I-495, I-90, I-84, and I-395 | |
| RAILROADS | CSX, Pan Am, and Fore River Railroads | |
| AIRPORTS | Logan Airport | |
| WATERBORNE | Port of Boston | |
| FREIGHT CLUSTER | Everett-Chelsea Industrial Area, CSX Intermodal Terminal (Worcester) |
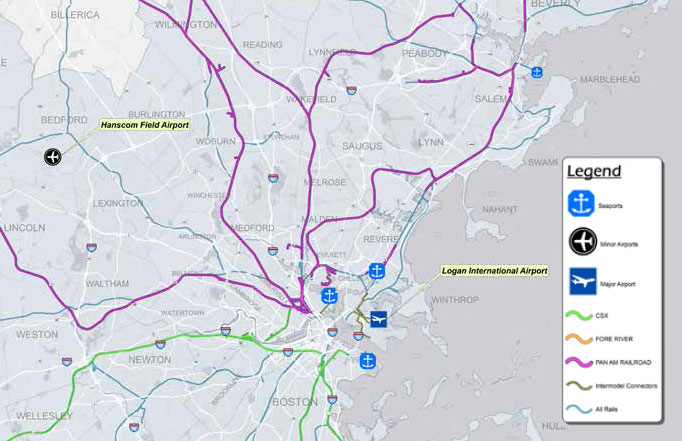
Sources: massDOT Note: Rail Data updated by Central Transportation Planning Staff, August 2014. Intermodel Connectors Obtained from FHWA National Highway System Shapefile
Boston Metro, MA/NH/RI (3 FAF4 zones)
| Commodity | Value (millions $) | % of total |
|---|---|---|
| Electronics | 179,794 | 17% |
| Precision instruments | 135,507 | 13% |
| Pharmaceuticals | 99,447 | 9% |
| Misc. mfg. prods. | 85,443 | 8% |
| Mixed freight | 85,055 | 8% |
| All commodities | 1,062,886 | 100% |
| Commodity | Tons (thousands) | % of total |
|---|---|---|
| Natural gas (Coal-n.e.c.) | 40,772 | 11% |
| Nonmetal min. prods. | 38,824 | 11% |
| Waste/scrap | 35,576 | 10% |
| Gravel | 34,256 | 9% |
| Gasoline | 34,102 | 9% |
| All commodities | 368,080 | 100% |
| Trade partner | Tonnage | % of total |
|---|---|---|
| Connecticut | 8,018 | 14% |
| Maine | 6,050 | 10% |
| SW & Central Asia | 5,178 | 9% |
| New York | 4,232 | 7% |
| Canada | 3,763 | 6% |
| Total outbound | 58,422 | 100% |
| Trade partner | Tonnage | % of total |
|---|---|---|
| Canada | 19,866 | 15% |
| Connecticut | 17,678 | 13% |
| New York | 15,969 | 12% |
| Rest of Americas | 11,059 | 8% |
| Maine | 10,216 | 8% |
| Total inbound | 131,618 | 100% |
Based on FAF4.1 data with base year 2012 and forecasts up to 2045
Among U.S. metropolitan areas, the Boston MSA (Boston-Cambridge-Newton, MA-NH) GDP was ranked ninth in 2014.
About 40% of the Greater Boston metro’s (MA/NH/RI) employment is in the freightintensive sector.
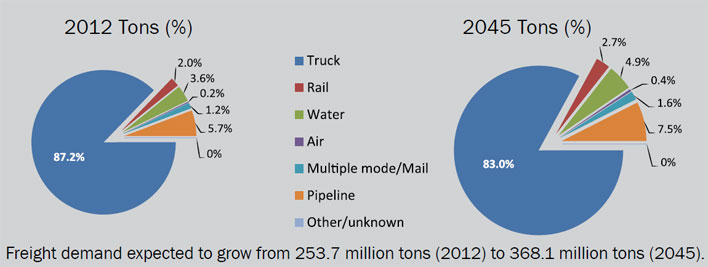
Between 2012 and 2045, the Greater Boston metro’s freight activity is projected to double in value and grow 45% in tonnage.
Trucks carry most of the freight in the Greater Boston metro region, both in value (70%) and tonnage (87%).
By 2045, the share of outbound shipments from the Greater Boston metro region to Europe will reach 16% by value, the highest share among the FAF analysis regions.
Annual congestion costs in the Greater Boston metro region in 2014 were estimated at $3.36 billion, ranking ninth among U.S. urban areas.
Heavy truck volume freight flows from New York to Massachusetts on I-84, I-90, and throughout the Boston metro area.
Heavy truck and auto traffic bottlenecks include most of I-93 in the Boston metro region, I-90 from Westfield to Boston, and sections of I-495, I-290, and I-95.
Large freight distribution center and warehouse clusters are located in the Boston, Worcester (I-90 & I-395) and Springfield (I-90 & I-91) areas.
Conley Container Terminal in Boston serves seven of the world’s top 10 container lines. An estimated 75% to 90% of the terminal’s marine freight shipment is destined for locations within 100 miles of the port.
Sources for Freight Facts: FAF4 Data, US DOT Freight Fact and Figure, S. Bureau of Economic Analysis, massDOT, massport, TTI 2015 Urban Mobility Scorecard, massDOT2010 State Freight Plan
To view PDF files, you can use the Adobe® Reader®.

