U.S. Department of Transportation
Federal Highway Administration
1200 New Jersey Avenue, SE
Washington, DC 20590
202-366-4000
Freight Economy
Date: August 25, 2016
Our Host: Chicago Metropolitan Agency for Planning (CMAP) and Supply Chain Innovation Network of Chicago (SINC)
| HIGHWAYS | I-290, I-294, I-355, I-55, I-57, I-80, I-88, I-90, I-94, IL 390, IL 394, IL 53 | |
| RAILROADS | BNSF, BRC, CN, CP, CSX, IHB, NS, UP | |
| AIRPORTS | O'Hare International Airport, Midway International Airport | |
| WATERBORNE | Houston Ship Channel, Gulf Intracoastal Waterway, Port of Houston Authority, Port of Texas City, Port of Galveston, Port Freeport | |
| FREIGHT CLUSTER | Core/Greater Midway, Fox River Valley, Greater O'Hare, North Chicagoland, South Cook County, Will County |
Source: CMAP
| Commodity | Value (millions $) | % of total |
|---|---|---|
| Electronics | 334,354 | 16% |
| Pharmaceuticals | 211,817 | 10% |
| Machinery | 171,976 | 8% |
| Natural gas (Coal-n.e.c.) | 113,271 | 5% |
| Mixed freight | 110,043 | 5% |
| All commodities | 2,073,492 | 100% |
| Commodity | Tons (thousands) | % of total |
|---|---|---|
| Natural gas (Coal-n.e.c.) | 262,782 | 22% |
| Base metals | 74,475 | 6% |
| Gravel | 73,804 | 6% |
| Crude petroleum | 66,892 | 6% |
| Other foodstuffs | 57,286 | 5% |
| All commodities | 1,180,060 | 100% |
| Trade partner | Tonnage | % of total |
|---|---|---|
| Indiana | 103,225 | 24% |
| Ohio | 52,436 | 12% |
| Michigan | 41,766 | 10% |
| Illinois | 41,473 | 10% |
| Wisconsin | 24,095 | 6% |
| Total outbound | 431,242 | 100% |
| Trade partner | Tonnage | % of total |
|---|---|---|
| Canada | 70,860 | 16% |
| Missouri | 41,346 | 9% |
| Iowa | 37,314 | 8% |
| Illinois | 36,458 | 8% |
| Wisconsin | 26,643 | 6% |
| Total inbound | 439,336 | 100% |
Based on FAF4.1 data with base year 2012 and forecasts up to 2045
Outbound: domestic and exports originated from the region
Inbound: domestic and imports destination in the region
Intra region moves not included
In 2014, the Illinois GDP was $742.0 billion, ranked 5th in the U.S. The Chicago- Naperville- Elgin, IL-IN-WI GDP was $610.6 billion, ranked 3rd among U.S. metro areas.
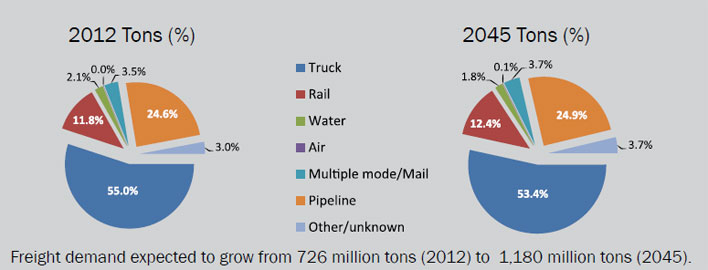
Between 2012 and 2045, the metropolitan Chicago region will see freight activity grow by about 63% in tonnage and more than double in value.
In 2012, the top three commodities (electronics, pharmaceuticals, machinery) represented a quarter of all freight value in the metro Chicago region, with the share expected to reach 35% in 2045.
The metropolitan Chicago region’s share of international freight by value is projected to grow from 16% in 2012 to 31% in 2045.
In 2014, annual congestion costs in the metro Chicago region were $7.2 billion, ranked 3rd among U.S. urban areas.
In 2014, 3.8 billion tons of cargo landed at O’Hare international Airport, ranked 4th in the nation by weight of all-cargo operations.
As of 2014, the seven- county Chicago region supported about 560,000 manufacturing jobs. The region is also home to the third largest U.S. freight cluster with 179,000 jobs.
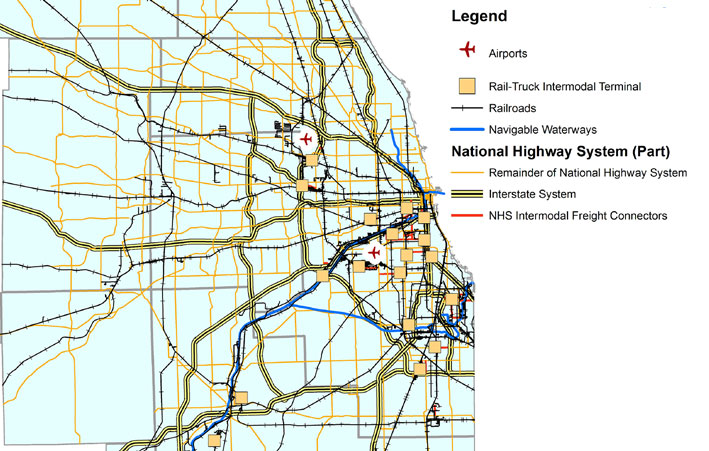
The Chicago region is home to an extensive multimodal freight facilities network, including 30,000 miles of roads, 3,600 miles of freight-rail, 100 miles of navigable waterways, and major airports. The region supports about 1.1 billion square feet of industrial development supporting freight and manufacturing activity.
In 2015, trucks accounted for about one in eight vehicle-miles-traveled on the urban Interstate highways in Illinois,. Some facilities in metropolitan Chicago carry over 30,000 trucks each day.
Approximately 25 percent of all freight railcars and 50 percent of all intermodal rail containers and trailers in the nation pass through Chicago, which serves as North America’s main interchange point between western and eastern railroads.
Sources for Freight Facts: FAF4 Data, Bureau of Economic Analysis,US DOT Freight Fact and Figure, TTI 2015 Urban Mobility Scorecard, 2015 Illinois Travel Statistics -IDOT, Quarter of railcar traffic: AAR, 2016, Truck VMT CMAP 2015, http://apps.dot.illinois.gov/gist2/, CMAP analysis of Economic Modeling
To view PDF files, you can use the Adobe® Reader®.

