U.S. Department of Transportation
Federal Highway Administration
1200 New Jersey Avenue, SE
Washington, DC 20590
202-366-4000
Freight Economy
Date: August 24, 2016
Our Host: Northeast Ohio Area wide Coordinating Agency (NOACA), Toledo Metro Area Council of Governments, and the Ohio Conference on Freight
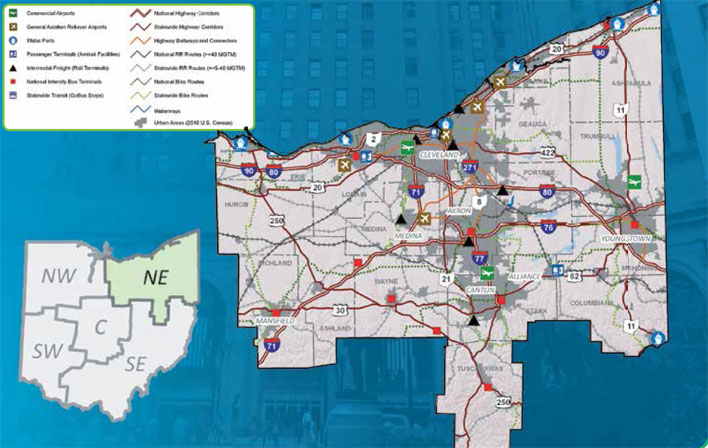
| HIGHWAYS | I-71, I-76, I-77, I-80, I-90, I-271, I-480, i-680, US-20, US-30, US-62, US -250, US-422, OH-2, OH-7 | |
| RAILROADS | CSX, Norfolk Southern, Wheeling & Lake, Akron Barberton Cluster, Ashtabula Carson & Jefferson, Ashland, Akron Metro, Bessemer Lake Erie, Cleveland Commercial, Chicago Ft. Wayne & Eastern, Lake Terminal, Ohio Central, RJ Corman, Wheeling & Lake Erie, Youngstown & Austintown, Youngstown and Southeastern | |
| AIRPORTS | Cleveland Hopkins International (CLE), Akron-Canton (CAK), Youngstown-Warren Regional (YNG) | |
| WATERBORNE | Lake Erie Ports: Cleveland, Fairport Harbor, Lorain, Ashtabula, Conneaut, Huron, Sandusky |
Source: ODOT- Access Ohio 2040
| Commodity | Value (millions $) | % of total |
|---|---|---|
| Machinery | 68,195 | 12% |
| Electronics | 59,275 | 10% |
| Pharmaceuticals | 40,537 | 7% |
| Base metals | 38,752 | 7% |
| Plastics/rubber | 37,529 | 7% |
| All commodities | 566,962 | 100% |
| Commodity | Tons (thousands) | % of total |
|---|---|---|
| Nonmetal min. prods. | 44,850 | 13% |
| Gravel | 43,122 | 12% |
| Natural gas (Coal-n.e.c.) | 41,265 | 12% |
| Base metals | 32,877 | 9% |
| Waste/scrap | 22,529 | 6% |
| All commodities | 347,420 | 100% |
| Trade partner | Tonnage | % of total |
|---|---|---|
| Ohio | 35,433 | 36% |
| Michigan | 9,255 | 9% |
| Pennsylvania | 7,837 | 8% |
| Canada | 6,081 | 6% |
| West Virginia | 5,419 | 5% |
| Total outbound | 98,708 | 100% |
| Trade partner | Tonnage | % of total |
|---|---|---|
| Ohio | 27,434 | 20% |
| Indiana | 16,324 | 12% |
| Michigan | 14,413 | 11% |
| Pennsylvania | 10,112 | 7% |
| Canada | 9,273 | 7% |
| Total inbound | 135,421 | 100% |
Based on FAF4.1 data with base year 2012 and forecasts up to 2045
Outbound: domestic and exports originated from the region
Inbound: domestic and imports destination in the region
Intra region moves not included
In 2014, Ohio's GDP was $588.8 billion and ranked 7th in the U.S. In 2004, Ohio's GDP was $450.8 billion and ranked 7th in the nation.
About 45% of the Northeast Ohio region's employment is generated by freight-intensive industries.
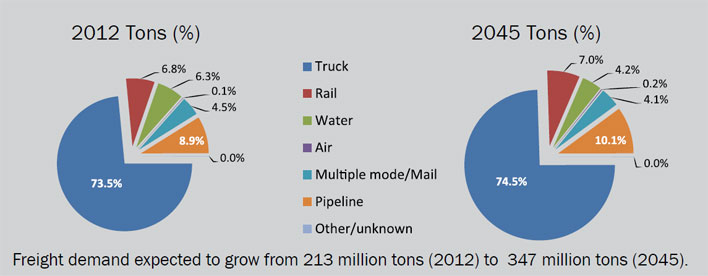
Northeast Ohio multimodal freight activity will increase by 100% in value and 60% in tonnage from 2012 - 2045 while the rest of Ohio's activity will grow about 70% in value and 40% in tonnage.
Ohio's domestic freight activity share in 2012 was about 90% both in tonnage and freight value, and the state is expected to maintain that share in 2045.
Trucks represent the Ohio's predominant freight carrier now and into the future, currently carrying 63% of freight tonnage and around 73% of freight value in the state.
In 2045, the key trading commodities in Ohio - motorized vehicles and machinery - will have a projected $385.2 billion value, up from $188.2 billion in 2012.
Gravel and nonmetal mineral products represent about a quarter of all freight tonnage in Northeast Ohio region.
Northeastern Ohio includes the I-76/I-80 corridor system that provides a direct and heavily used route from NY/NJ to the Midwest. Major ports and shipyards on Lake Erie, east/west rail lines, and major east/west and north/south highways serve as this region's critical freight corridors.
Trucks make up about 13 percent of the traffic on the Ohio highway system and 18 percent of traffic on interstate highways. In 2012, average daily truck traffic on Ohio interstate routes was about 10,500 and approached 15,000 on the heaviest truck routes: I-75 and I-70.
Ohio has access to two of the nation’s largest inland waterway systems as well as the Gulf of Mexico and the North Atlantic Ocean. The state is home to eight ports on Lake Erie. Three ports (Toledo, Cleveland, and Ashtabula) stand out in terms of their capabilities and cargo volume.
Sources for Freight Facts: FAF4 Data, Bureau of Economic Analysis, ODOT- Access Ohio 2040
To view PDF files, you can use the Adobe® Reader®.

