U.S. Department of Transportation
Federal Highway Administration
1200 New Jersey Avenue, SE
Washington, DC 20590
202-366-4000
Freight Economy
Date: April 4, 2016
Our Host: Denver Chamber of Commerce
| HIGHWAYS | I-25, I-70, I-76 and US 287; portions of US-85, US-6, US-36, and E-470; Major regional arterials: South Santa Fe Drive and SH-119 | |
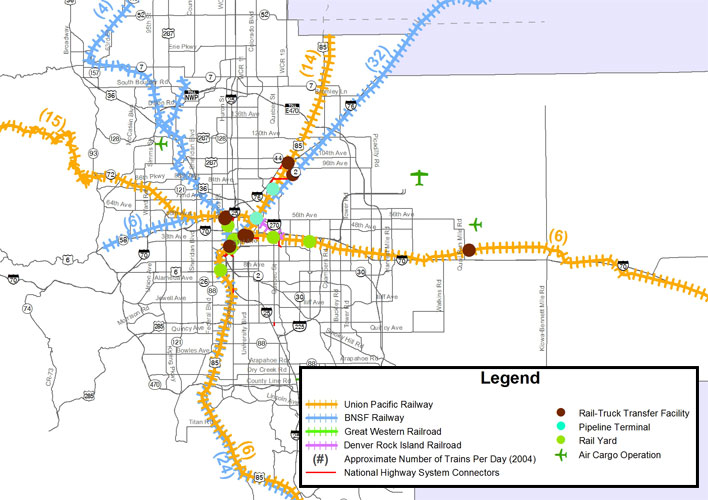
| RAILROADS | Union Pacific, BNSF, Great Western and Denver Rock Island Railroad | |
| AIRPORTS | Denver International Airport | |
| PIPLINE | Conoco and Kanab Pipeline |
Source: DRCOG
| Commodity | Value (millions $) | % of total |
|---|---|---|
| Electronics | 52,556 | 13% |
| Coal-n.e.c. | 47,483 | 11% |
| Mixed freight | 38,469 | 9% |
| Precision instruments | 36,427 | 9% |
| Pharmaceuticals | 28,300 | 7% |
| All commodities | 414,439 | 100% |
| Commodity | Tons (thousands) | % of total |
|---|---|---|
| Natural gas (Coal-n.e.c.) | 151,764 | 43% |
| Gravel | 47,166 | 13% |
| Natural sands | 23,555 | 7% |
| Nonmetal min. prods. | 18,206 | 5% |
| Mixed freight | 10,663 | 3% |
| All commodities | 354,256 | 100% |
| Trade partner | Tonnage | % of total |
|---|---|---|
| Colorado | 40,284 | 26% |
| Wyoming | 36,182 | 24% |
| Nebraska | 25,581 | 17% |
| New Mexico | 11,655 | 8% |
| Oklahoma | 7,919 | 5% |
| Total outbound | 153,587 | 100% |
| Trade partner | Tonnage | % of total |
|---|---|---|
| Colorado | 28,144 | 29% |
| Nebraska | 19,734 | 21% |
| Wyoming | 18,179 | 19% |
| California | 3,173 | 3% |
| Canada | 2,908 | 3% |
| Total inbound | 95,922 | 100% |
Based on FAF4.1 data with base year 2012 and forecasts up to 2045
International freight in the Denver region is projected to grow rapidly by 2045—more than quadrupling by value.
Currently, Denver’s major trading partner by both value (nearly 1/5th) and tonnage (nearly 1/3rd) is the rest of Colorado.
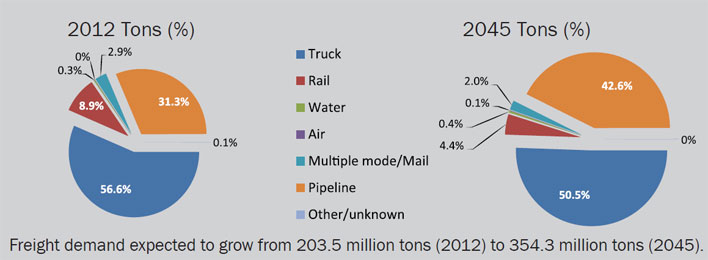
The Denver region will see multimodal freight activity grow by nearly 75% in tonnage terms and expand over two times in value between 2012 and 2045.
The majority of the Denver region’s freight activity is domestic (93% by value and 98% by tonnage).
Nine major industry clusters drive the Denver regional economy: aerospace; aviation; beverage production; bioscience; energy; financial services; broadcasting/telecommun- ications; healthcare/ wellness; and IT/software, with specific needs and requirements for freight activity.
Denver International Airport (DIA) is the major air cargo facility in the area, with nearly 4% of all modal activity by value. DIA houses World Port Cargo Support, DHL, UPS, FedEx, and United Airlines cargo. More than 50 freight forwarders and customs brokers operate within 20 miles of DIA.
The most significant freight bottlenecks in the Denver area are: the I-25 and I-76 interchange; the I-25 and I-70 interchange, and the I-25 and I-225 interchange. In 2012, the estimated cost of congestion delay was more than $1 million a day to commercial vehicles and businesses in the region.
The region added 124k jobs between 2005 and 2013, growing at the rate of 10%, while the population grew by 8% during the same period.
By 2045, trade with the rest of Colorado and nearby states will continue to be key while the relative value of trade levels with European countries will increase.
Rail carries approximately 9% by tonnage of total freight activity in Denver, with the Class I railroads UP and BNSF operating in the region.
Sources for Freight Facts: FAF, DRCOG, BTS, ATRI and Colorado DOT
To view PDF files, you can use the Adobe® Reader®.

