U.S. Department of Transportation
Federal Highway Administration
1200 New Jersey Avenue, SE
Washington, DC 20590
202-366-4000
Freight Economy
Date: May 23, 2016
Our Host: Greater Des Moines Partnership
| HIGHWAYS | I-35, I-80, I-235, S-28, S-163 | |
| RAILROADS | Union Pacific, Iowa Interstate, Norfolk Southern, and Burlington Northern Santa Fe Railroads | |
| AIRPORTS | Des Moines International Airport (DSM) |
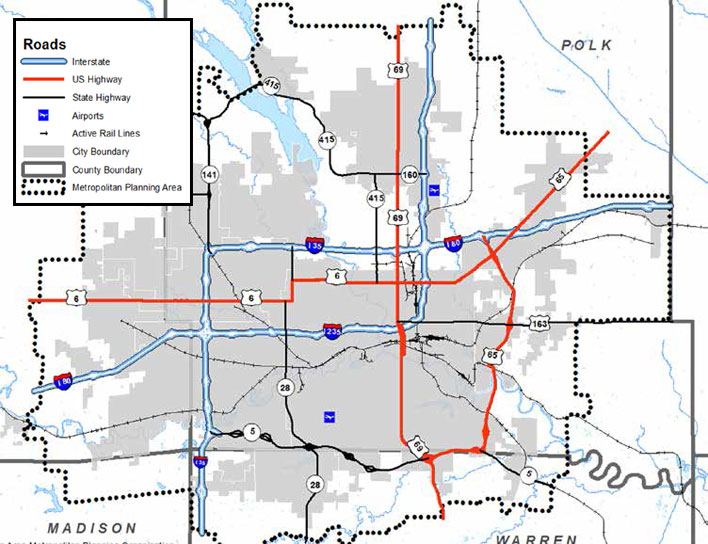
Source: Des Moines Area MPO, Iowa DOT
"Iowa" FAF zone
| Commodity | Value (millions $) | % of total |
|---|---|---|
| Machinery | 73,281 | 12% |
| Cereal grains | 40,366 | 6% |
| Electronics | 36,773 | 6% |
| Other foodstuffs | 36,651 | 6% |
| Mixed freight | 36,230 | 6% |
| All commodities | 636,970 | 100% |
| Commodity | Tons (thousands) | % of total |
|---|---|---|
| Cereal grains | 156,567 | 20% |
| Natural gas (Coal-n.e.c.) | 108,390 | 14% |
| Gravel | 78,707 | 10% |
| Animal feed | 68,842 | 9% |
| Other ag prods. | 56,035 | 7% |
| All commodities | 776,383 | 100% |
| Trade partner | Tonnage | % of total |
|---|---|---|
| Illinois | 73,316 | 24% |
| Minnesota | 52,869 | 17% |
| Nebraska | 21,911 | 7% |
| Texas | 15,779 | 5% |
| Missouri | 15,105 | 5% |
| Total outbound | 304,505 | 100% |
| Trade partner | Tonnage | % of total |
|---|---|---|
| Minnesota | 51,143 | 34% |
| Nebraska | 24,392 | 16% |
| Illinois | 11,500 | 8% |
| Wyoming | 8,145 | 5% |
| Missouri | 7,748 | 5% |
| Total inbound | 151,204 | 100% |
Based on FAF4.1 data with base year 2012 and forecasts upto 2045
In 2014, the Iowa GDP was $169.7 billion, ranked 30th among states in the U.S. Des Moines’s GDP was 26.6% of the state’s GDP.
About 40% of Des Moines’s employment is from freight-intensive industry sectors.
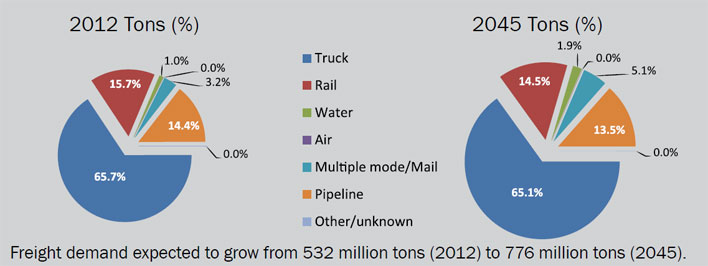
Between 2012 and 2045, Iowa will see freight activity increase by about 50% in value and about 40% in tonnage.
Iowa’s domestic freight activity tonnage share was 98% in 2012. The state’s international tonnage share is projected to increase from 2% to 6% in 2045.
In 2012, trucks carried most of the freight in Iowa, both in value (74%) and tonnage (66%).
Iowa interstates carried 62% of the state’s large truck traffic (combination units or tractor plus trailer(s)) in 2015.
Cereal grains and natural gas are the largest two commodities by tonnage and represented 37% of all freight tonnage in Iowa in 2012.
More than 99% of Iowa’s air cargo travels through two commercial airports: Des Moines International Airport, which handles 70% of the share, and Eastern Iowa Airport in Cedar Rapids. With more than one million square feet of available parking for cargo aircraft, the Des Moines airport serves as a second-day hub for UPS.
Des Moines’s population is projected to increase nearly 60% from 480,000 in 2010 to 751,000 by 2050. The region’s employment is expected to increase by 40% in 2050, which will require almost 150,000 new housing units.
Des Moines is at the crossroads of I-35 (North-South) and I-80 (East-West), which connect the region to Canada, Mexico, the east and west coasts, and the Gulf of Mexico.
Sources for Freight Facts: FAF4 Data, Bureau of Economic Analysis, Iowa State Freight Plan-Iowa DOT, Mobilizing Tomorrow -DMAMPO, http://www.dsmairport.com/
To view PDF files, you can use the Adobe® Reader®.

