U.S. Department of Transportation
Federal Highway Administration
1200 New Jersey Avenue, SE
Washington, DC 20590
202-366-4000
Freight Economy
Date: August 23, 2016
Our Host: Southeast Michigan Council of Governments (SEMCOG) and Metropolitan Affairs Coalition
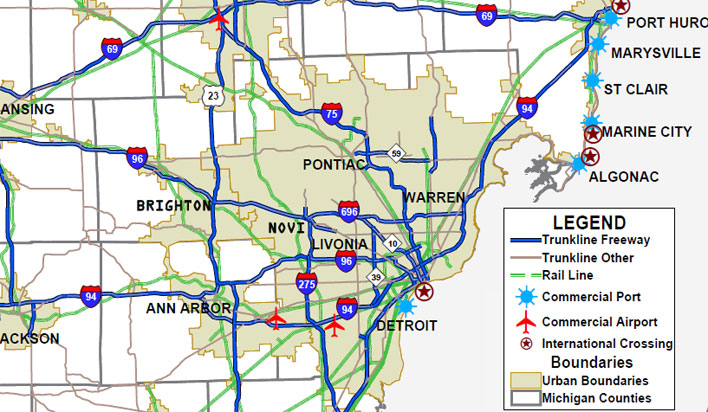
| HIGHWAYS | I-94, I-96, I-75, I-69, I-696, I-275, I-375, I-475, US-23, US-24, US-12, US-223, US-127 | |
| RAILROADS | Class I: CN, CSX, NS, CP; Class III: Conrail, Ann Arbor RR, Lake State Railway, Lapeer Industrial RR, Great Lakes Central RR, Delray Connecting RR, Indiana and Ohio Railway, Adrian and Blissfield RR, Huron and Eastern RR | |
| AIRPORTS | Detroit Metro, Willow Run | |
| WATERBORNE | Detroit, St. Clair, Monroe, Marine City, Marysville, Port Huron | |
| BORDER PORTS OF ENTRY | Blue Water Bridge, St. Clair River Tunnel, Ambassador Bridge, Detroit Windsor Tunnel, Detroit River Rail Tunnel, Detroit Windsor Truck Ferry, Walpole Island Ferry, Bluewater Ferry |
Source: MDOT
Data represents freight activity forGenesee, Lapeer , Lenawee , Livingston , Macomb, Monroe, Oakland, St. Clair, Washtenaw, Wayne counties
| Commodity | Value (millions $) | % of total |
|---|---|---|
| Motorized vehicles | 275,845 | 26% |
| Basic chemicals | 162,243 | 15% |
| Machinery | 115,263 | 11% |
| Electronics | 88,197 | 8% |
| Mixed freight | 44,461 | 4% |
| All commodities | 1,068,427 | 100% |
| Commodity | Tons (thousands) | % of total |
|---|---|---|
| Natural gas (Coal-n.e.c.) | 71,355 | 19% |
| Motorized vehicles | 38,731 | 10% |
| Base metals | 34,957 | 9% |
| Nonmetal min. prods. | 32,157 | 9% |
| Other foodstuffs | 15,781 | 4% |
| All commodities | 370,232 | 100% |
| Trade partner | Tonnage | % of total |
|---|---|---|
| Michigan | 16,401 | 20% |
| Canada | 15,351 | 19% |
| Ohio | 15,336 | 19% |
| Indiana | 7,529 | 9% |
| Mexico | 2,657 | 3% |
| Total outbound | 81,425 | 100% |
| Trade partner | Tonnage | % of total |
|---|---|---|
| Canada | 32,540 | 16% |
| Michigan | 32,422 | 16% |
| Ohio | 30,476 | 15% |
| Indiana | 30,444 | 15% |
| Mexico | 10,317 | 5% |
| Total inbound | 201,073 | 100% |
Based on FAF4.2 data with base year 2012 and forecasts upto 2045
Outbound: domestic and exports originated from the region
Inbound: domestic and imports destination in the region
Intra region moves not included
In 2014, the Michigan GDP was $447.2 billion and ranked 13th in the U.S. The Detroit MSA GDP was $236.5 billion and represented 53% of the state’s GDP.
About 45% of Southeast Michigan’s employment is generated by freight-intensive industries.
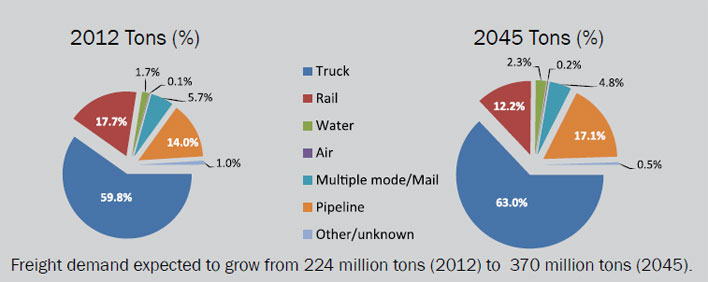
Between 2012 and 2045, the Southeast Michigan region will see freight activity increase by 137% in value and about 65% in tonnage.
From 2012 to 2045, the Southeast Michigan region’s share of international freight value is projected to grow from about 25% to about 45%.
Ranked first in freight value among Southeast Michigan commodities, the motorized vehicles sector is expected to grow from $172 billion in 2012 to $275 billion in 2045.
In 2014, annual congestion costs in the Detroit region were $3.5 billion, ranking 15th in the nation.
In 2015, I-75 between Detroit and Toledo was Michigan’s busiest corridor carrying 15,500 trucks, followed by I-94 through Romulus and Taylor with 14,300 trucks per day.
Michigan border crossings facilitated $31.4 billion in U.S. trade with the rest of the world, including $9.1 billion of Michigan trade with the world. Michigan border crossings handle $16.70 billion (or 53.72%) of total Canada/Mexico trade.
The Ambassador Bridge in Detroit is the busiest commercial border crossing in the nation with almost 2.5 million trucks crossing it in 2014. The Blue Water Bridge in Port Huron is the second busiest on the northern border with nearly 1.6 million trucks.
Eight states – IN, IA, KS, KY, MI, MN, OH, and WI – have jointly developed a real-time, multi-state Truck Parking Information Management System (TPIMS). The $25 million TIGER project will deploy a regional TPIMS on I-35, I-65, I-70, I-71, I-75, I-275, and I-94 corridors by February 2018.
Sources for Freight Facts: FAF4 Data, BTS, Bureau of Economic Analysis,TTI 2015 Urban Mobility Scorecard,http://nats.sct.gob.mx/go-totables, MDOT 2040 State Long-Range Transportation Plan, MDOT
To view PDF files, you can use the Adobe® Reader®.

