U.S. Department of Transportation
Federal Highway Administration
1200 New Jersey Avenue, SE
Washington, DC 20590
202-366-4000
Freight Economy
Date: March 22, 2016
Our Host: Los Angeles Chamber of Commerce
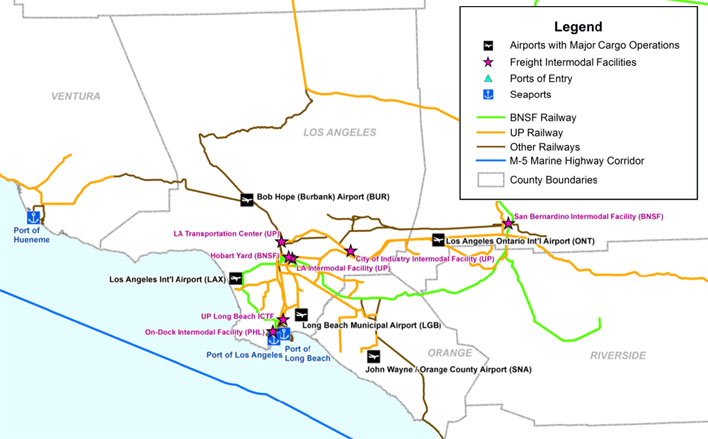
| HIGHWAYS | I-5, I-10, I-15, I-40, I-105, I-110, I-210, I-215, I-405, I-605, I-710, US-101, US-395, SR-14, SR-58, SR-86, SR-126 and SR-138 | |
| RAILROADS | BNSF, Union Pacific | |
| AIRPORTS | Los Angeles International, Ontario International, Bob Hope (Burbank), Long Beach Municipal, and John Wayne | |
| WATERBORNE | Ports – Los Angeles, Long Beach, and Hueneme. Marine Corridors – I-5 | |
| INTERMODAL TERMINALS | Hobart, Southern California International Gateway, San Bernardino, Commerce, City of Industry, Intermodal Container Transfer & Dolores yards. |
Source: CalTrans, SANDAG
| Commodity | Value (millions $) | % of total |
|---|---|---|
| Electronics | 767,777 | 23% |
| Precision instruments | 255,171 | 8% |
| Misc. mfg. prods. | 220,225 | 7% |
| Motorized vehicles | 214,702 | 6% |
| Pharmaceuticals | 204,437 | 6% |
| All commodities | 3,335,907 | 100% |
| Commodity | Tons (thousands) | % of total |
|---|---|---|
| Gasoline | 194,247 | 17% |
| Waste/scrap | 103,860 | 9% |
| Other foodstuffs | 84,231 | 7% |
| Coal-n.e.c. | 73,028 | 7% |
| Nonmetal min. prods. | 72,865 | 6% |
| All commodities | 1,123,161 | 100% |
| Trade partner | Tonnage | % of total |
|---|---|---|
| Eastern Asia | 70,656 | 31% |
| California | 47,428 | 21% |
| Arizona | 10,792 | 5% |
| SE Asia & Oceania | 10,325 | 5% |
| Mexico | 9,455 | 4% |
| Total outbound | 227,010 | 100% |
| Trade partner | Tonnage | % of total |
|---|---|---|
| Eastern Asia | 65,707 | 18% |
| California | 43,763 | 12% |
| Arizona | 27,298 | 8% |
| SW & Central Asia | 19,120 | 5% |
| Oregon | 18,068 | 5% |
| Total inbound | 361,975 | 100% |
Based on FAF4.1 data with base year 2012 and forecasts up to 2045
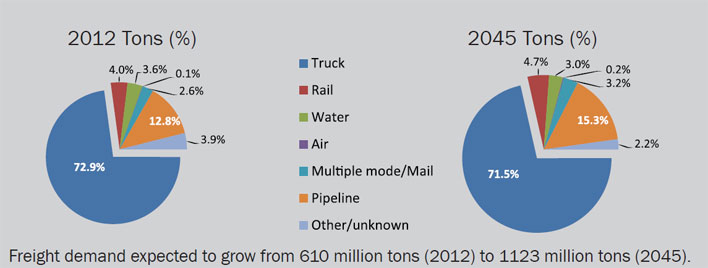
The LA region will see multimodal freight activity grow by nearly 84% in tonnage terms and expand almost 1.5 times in value between 2012 and 2045.
The LA area’s freight activity is mostly domestic (76% by value and 85% by tonnage) but international freight is projected to more than triple by 2045 (value based).
The LA region accounted for the highest amount of freight activity among U.S. metropolitan markets, as measured by value (2012).
By 2045, Eastern Asia is projected as the top trading partner for the LA region, for inbound and outbound shipments measured in both value and tonnage terms.
In 2014, the greater LA region’s goods movement- dependent industries collectively generated close to 3 million jobs--or 33 percent of the region’s total number of jobs. These industries also contributed $291 billion, or 35 percent of the regional GDP in the same year.
The most significant freight bottlenecks in the LA region are those along the SR-60, I-105 and I-710. In 2013, SCAG developed a Comprehensive Regional Goods Movement Plan that identified the top-priority truck bottlenecks and resulted in a list of the top 50 regional priority bottleneck.
U.S. DOT, the Port of Los Angeles, and a drayage trucking company have been testing operational strategies to improve freight efficiency through the development of an advanced intermodal logistics information technology system designed to improve drayage and container handling.
The LA region has about 70,000 lane roadway miles. I-710, I-605, SR-60 and SR-91 sections have highest truck volumes, averaging 25,000+ trucks per day.
Rail is a critical sector in LA region’s economy with BNSF and UP both carrying international and domestic cargo.
The Ports of Los Angeles and Long Beach have proposed almost $2.0 billion in harbor improvements to support increased on-dock rail services.
Sources for Freight Facts: FAF, BLS, ATRI, Caltrans and SCAG
To view PDF files, you can use the Adobe® Reader®.

