U.S. Department of Transportation
Federal Highway Administration
1200 New Jersey Avenue, SE
Washington, DC 20590
202-366-4000
Freight Economy
Date: July 12, 2016
Our Host: Oklahoma Department of Transportation, Greater Oklahoma City Chamber, Association of Central Oklahoma Governments and Indian Nations Council of Governments
| HIGHWAYS | I-40, I-240, I-35, I-235, I-44 | |
| RAILROADS | BNSF, Union Pacific | |
| AIRPORTS | Will Rogers World in Oklahoma City |
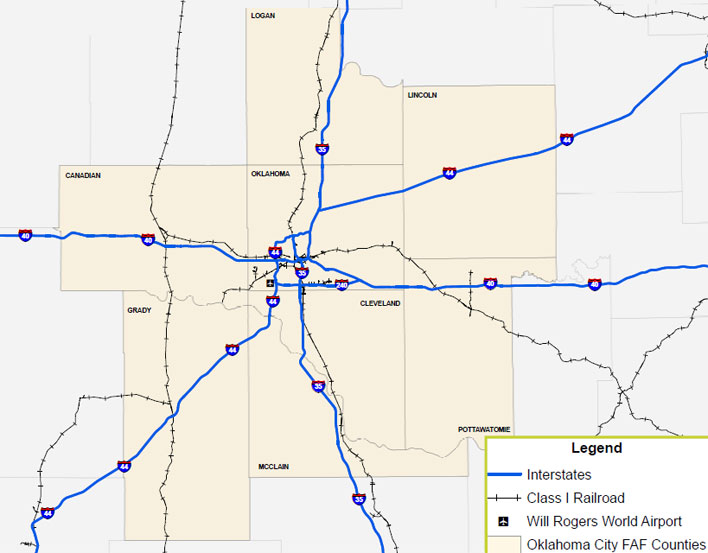
Source: ODOT
Area represents Oklahoma City and surrounding counties Canadian, Cleveland, Grady, Lincoln, Logan, McClain, Oklahoma, Pottawatomie
| Commodity | Value (millions $) | % of total |
|---|---|---|
| Machinery | 24,130 | 13% |
| Electronics | 20,525 | 11% |
| Mixed freight | 17,826 | 10% |
| Pharmaceuticals | 16,204 | 9% |
| Plastics/rubber | 11,811 | 7% |
| All commodities | 179,609 | 100% |
| Commodity | Tons (thousands) | % of total |
|---|---|---|
| Natural gas (Coal-n.e.c.) | 27,996 | 20% |
| Gravel | 24,114 | 17% |
| Natural sands | 23,370 | 16% |
| Nonmetal min. prods. | 12,369 | 9% |
| Crude petroleum | 6,871 | 5% |
| All commodities | 143,335 | 100% |
| Trade partner | Tonnage | % of total |
|---|---|---|
| Oklahoma | 8,899 | 34% |
| Texas | 3,972 | 15% |
| Minnesota | 3,016 | 12% |
| Kansas | 2,048 | 8% |
| Ohio | 990 | 4% |
| Total outbound* | 25,941 | 100% |
| Trade partner | Tonnage | % of total |
|---|---|---|
| Oklahoma | 27,876 | 45% |
| Texas | 13,541 | 22% |
| Colorado | 7,286 | 12% |
| North Dakota | 1,414 | 2% |
| Kansas | 1,194 | 2% |
| Total inbound** | 62,432 | 100% |
Based on FAF4.2 data with base year 2012 and forecasts upto 2045
Includes all modes but excludes intraregional flows. *Other outbound = 7,016/27% **Other inbound =11,121/18%
In 2014, Oklahoma's GDP was $190.2 billion and ranked 27th among U.S. states. Oklahoma City MSA's GDP was 38.2% of the state's GDP.
More than half of the Oklahoma City metro region's employment is generated by freight-intensive industries.
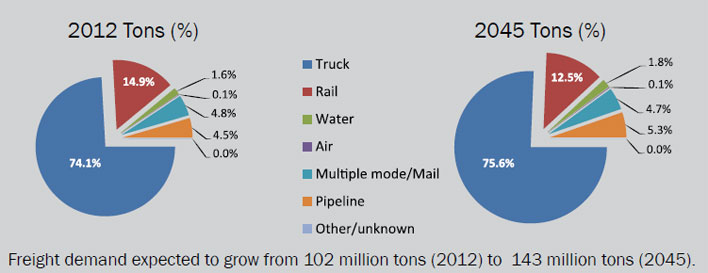
Between 2012 and 2045, the Oklahoma City metro region will see freight activity grow by about 74% in value and 40% in tonnage.
In 2012, the Oklahoma City metro region's domestic freight activity share was about 80% in value. International freight activity is expected to increase to about 40% in 2045.
Tinker Air Force Base, one of the nation's three Air Logistics Centers, is located about eight miles southeast of downtown Oklahoma City. The base employs more than 26,000 personnel.
Natural gas (Coal-n.e.c.), gravel, and natural sands represent half of all commodities traded by the Oklahoma City metro region in 2012, with a similar share projected for 2045.
Trucks are the Oklahoma City metro region's predominant freight carrier now and into the future. Trucks currently carry about 75% of freight tonnage and 70% of value.
Highest truck average annual daily traffic in the state in 2014 exceeded 10,000 at several recording sites on I-40 west between Clinton and Oklahoma City, I-35 south between Oklahoma City and Pauls Valley, and on US 412 east between Tulsa and Inola.
The McClellan-Kerr Arkansas River Navigation System (MKARNS) is Oklahoma’s primary navigable waterway, originating from the Tulsa Port of Catoosa and flowing southeast through Arkansas to the Mississippi River.
Canada is the top international commodity shipment destination from the Oklahoma City metro region, representing 3% of the value of total shipments. By 2045, the value share commodity shipments to Canada will increase to 5%.
Sources for Freight Facts: FAF4 Data, US DOT Freight Fact and Figure, Bureau of Economic Analysis, Oklahoma Statewide Freight and Passenger Rail Plan,ENCOMPASS 2035 OCARTS
To view PDF files, you can use the Adobe® Reader®.

