U.S. Department of Transportation
Federal Highway Administration
1200 New Jersey Avenue, SE
Washington, DC 20590
202-366-4000
Freight Economy
Date: June 23, 2016
Our Host: The Portland Business Alliance, Associated Oregon Industries, Oregon Business Association, Oregon Business Council, and Port of Portland
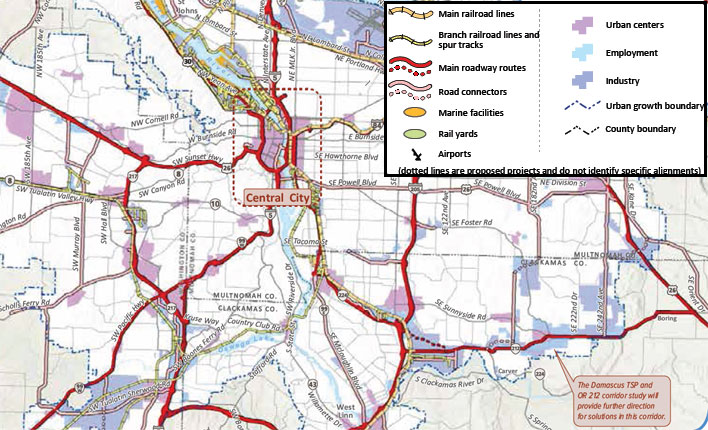
| HIGHWAYS | I-5, I-205, I-405, I-84, OR 99E, OR 99W, OR 212, OR 217, OR 224, US 26, US 30, SR 14, SR 500 | |
| RAILROADS | Union Pacific Railroad, BNSF Railroad | |
| AIRPORTS | Portland International Airport | |
| WATERBORNE | Portland Vancouver harbor, Columbia River, Snake River, Willamette River | |
| PIPLINE | Olympic pipeline (petroleum) and Williams Northwest pipeline (natural gas) |
Source: Metro RTP 2014 Plan
Porland Metro, OR/WA (2 FAF4 zones)
| Commodity | Value (millions $) | % of total |
|---|---|---|
| Electronics | 96,855 | 20% |
| Mixed freight | 41,196 | 9% |
| Motorized vehicles | 37,654 | 8% |
| Machinery | 35,683 | 7% |
| Other ag prods. | 25,988 | 5% |
| All commodities | 476,849 | 100% |
| Commodity | Tons (thousands) | % of total |
|---|---|---|
| Cereal grains | 46,640 | 16% |
| Other ag prods. | 40,937 | 14% |
| Gravel | 26,204 | 9% |
| Wood prods. | 19,014 | 7% |
| Natural gas (Coal-n.e.c.) | 15,934 | 6% |
| All commodities | 285,294 | 100% |
| Trade partner | Tonnage | % of total |
|---|---|---|
| Eastern Asia | 69,009 | 51% |
| SE Asia & Oceania | 11,717 | 9% |
| Oregon | 11,600 | 9% |
| Washington | 10,196 | 8% |
| California | 7,461 | 6% |
| Total outbound | 135,321 | 100% |
| Trade partner | Tonnage | % of total |
|---|---|---|
| Washington | 18,477 | 23% |
| Canada | 10,108 | 13% |
| California | 6,091 | 8% |
| Oregon | 5,079 | 6% |
| Eastern Asia | 4,515 | 6% |
| Total inbound | 79,221 | 100% |
Based on FAF4.2 data with base year 2012 and forecasts up to 2045
In 2014, Oregon’s GDP was $212.8 billion and ranked 25th among states in the U.S. Portland MSA’s GDP was 75% of the state’s GDP.
About 40% of Portland MSA’s employment is generated by freight-intensive industries.
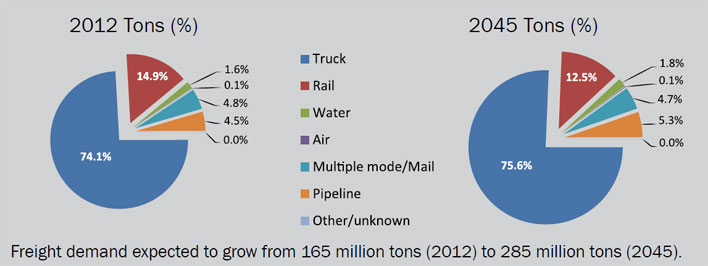
Between 2012 and 2045, the Portland region will see freight activity more than double in value and increase about 70% in tonnage.
From 2012 to 2045, the Portland region’s share of international freight both by value and tonnage is projected to grow from about 20% to about 40%.
A key trading commodity, electronics in the Portland region will have a projected $96.9 billion value in 2045, representing a 20% share of total freight value.
Trucks represent the Portland region’s predominant freight carrier now and into the future, currently carrying almost 75% of the area’s freight.
In 2014, the annual estimated highway congestion cost in the Portland MSA was $1.8 billion, ranked 11th in the nation among urban areas.
The Olympic Pipeline transports 65 percent of the petroleum products that Oregon uses. The pipeline delivers daily the equivalent of 750 tanker trucks of fuel between Puget Sound and the Portland tank farm located in the Northwest Portland industrial area.
The Portland Harbor, located at the junction of the navigable portions of the Columbia and Willamette Rivers, handles the majority of marine freight in Oregon. The Columbia River’s 43- foot channel depth gives Portland access to Pacific Rim trade.
The majority of Oregon’s population resides in Portland. Between 2010 and 2040, the metro region is expected to add 917,000 residents and 597,000 jobs.
Sources for Freight Facts: FAF4 Data, Bureau of Economic Analysis,TTI 2015 Urban Mobility Scorecard,Oregon Freight Plan2011, Metro RTP 2014
To view PDF files, you can use the Adobe® Reader®.

