U.S. Department of Transportation
Federal Highway Administration
1200 New Jersey Avenue, SE
Washington, DC 20590
202-366-4000
Freight Economy
Date: June 24, 2016
Our Host: Greater Des Moines Partnership
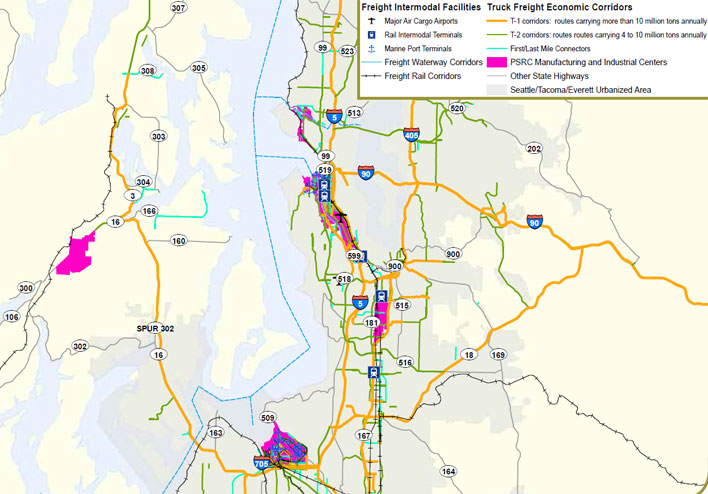
| HIGHWAYS | I-5, I-90, SR 18, SR 167, I-405, SR 512, SR 518, SR 529 | |
| RAILROADS | BNSF Railway, Union Pacific Railroad, Tacoma Rail | |
| AIRPORTS | Sea-Tac International Airport, Paine Field Airport, Boeing Field/King County International Airport. | |
| WATERBORNE | Port of Seattle, Port of Tacoma. |
Source: WSDOT
| Commodity | Value (millions $) | % of total |
|---|---|---|
| Transport equip. | 255,239 | 29% |
| Electronics | 96,924 | 11% |
| Mixed freight | 63,758 | 7% |
| Misc. mfg. prods. | 62,200 | 7% |
| Machinery | 45,429 | 5% |
| All commodities | 874,497 | 100% |
| Commodity | Tons (thousands) | % of total |
|---|---|---|
| Other ag prods. | 28,377 | 9% |
| Gravel | 25,076 | 8% |
| Nonmetal min. prods. | 23,463 | 7% |
| Gasoline | 22,918 | 7% |
| Logs | 22,726 | 7% |
| All commodities | 318,239 | 100% |
| Trade partner | Tonnage | % of total |
|---|---|---|
| Eastern Asia | 47,665 | 42% |
| Canada | 14,737 | 13% |
| Washington | 12,481 | 11% |
| Oregon | 7,386 | 7% |
| SE Asia & Oceania | 6,506 | 6% |
| Total outbound | 112,523 | 100% |
| Trade partner | Tonnage | % of total |
|---|---|---|
| Canada | 27,758 | 27% |
| California | 12,646 | 12% |
| Washington | 10,344 | 10% |
| Idaho | 9,912 | 9% |
| Eastern Asia | 9,526 | 9% |
| Total inbound | 104,727 | 100% |
Based on FAF4.2 data with base year 2012 and forecasts upto 2045
In 2014, the Washington State GDP was $422.9 billion and ranked 14th among states in the U.S. The Seattle region’s GDP was 71% of the state’s GDP.
About 40% of the Seattle region’s employment is generated by freight-intensive industries.
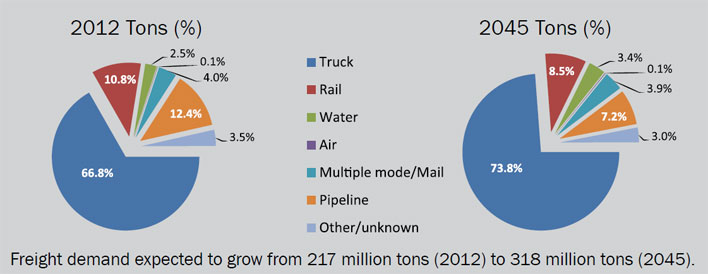
Between 2012 and 2045, the Seattle region will see freight activity increase by about 50% in tonnage and about 120% in value.
The Seattle region’s share of international freight by both value and tonnage is projected to grow from about 20% in 2012 to about 40% in 2045.
A key commodity in the Seattle region, transport equipment is projected to grow to $255 billion in 2045, which will represent 29% of total freight value.
The estimated annual highway congestion cost in 2014 for the Seattle region was $3.3 billion, ranking 5th among 11th among all U.S. urban areas.
The I-5 section near Tacoma had the highest average daily truck traffic in Washington State in 2014, with 8% (15,226 trucks) of average daily traffic volume.
Demand for public rest areas on the I-5, I-90, and I-82 corridors is expected to substantially exceed capacity by the year 2030. The highest priority locations for new or expanded truck parking are along the I-5/I-90 corridor serving the Puget Sound Region.
In 2011, about 51% of Washington’s air cargo traveled through Seattle-Tacoma (Sea-Tac) International Airport. Sea-Tac’s freight activity is 65% domestic and 35% international.
Marine cargo operations at the ports of Seattle and Tacoma supported more than 48,000 jobs in 2013, generating nearly $4.3 billion in economic activity and more than $378 million in local and State tax revenues.
Sources for Freight Facts: FAF4 Data, Bureau of Economic Analysis, TTI 2015 Urban Mobility Scorecard, Washington State Freight Mobility Plan 2014
To view PDF files, you can use the Adobe® Reader®.

