U.S. Department of Transportation
Federal Highway Administration
1200 New Jersey Avenue, SE
Washington, DC 20590
202-366-4000
Freight Economy
Date: May 16, 2016
Our Host: New York State Department of Transportation, Syracuse Metropolitan Transportation Council, Center State Corporation for Economic Opportunity, and the Central New York Regional Economic Development Council
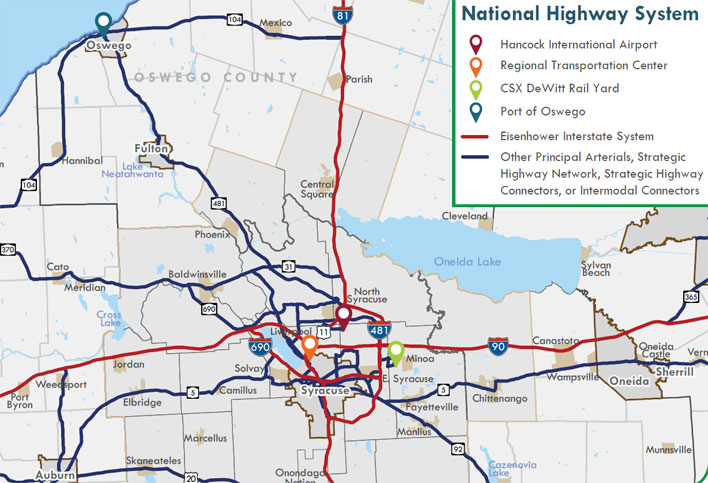
| HIGHWAYS | I-81, I-90, I-481, I-690, State Routes 481 and 690 | |
| RAILROADS | CSX Transportation; New York, Susquehanna & Western Railway; and Finger Lakes Railway | |
| AIRPORTS | Syracuse Hancock International Airport | |
| WATERBORNE | Port of Oswego (outside of Syracuse planning area) |
Source:SMTC
"Rest of NYS" FAF zone
| Commodity | Value (millions $) | % of total |
|---|---|---|
| Mixed freight | 45,435 | 14% |
| Electronics | 37,334 | 11% |
| Pharmaceuticals | 27,082 | 8% |
| Machinery | 26,301 | 8% |
| Other foodstuffs | 25,565 | 8% |
| All commodities | 330,473 | 100% |
| Commodity | Tons (thousands) | % of total |
|---|---|---|
| Natural gas (Coal-n.e.c.) | 39,813 | 15% |
| Gravel | 37,829 | 14% |
| Other foodstuffs | 27,155 | 10% |
| Nonmetal min. prods. | 18,212 | 7% |
| Waste/scrap | 14,995 | 6% |
| All commodities | 262,791 | 100% |
| Trade partner | Tonnage | % of total |
|---|---|---|
| Europe | 18,297 | 23% |
| New York | 15,882 | 20% |
| Pennsylvania | 9,450 | 12% |
| Connecticut | 6,512 | 8% |
| Massachusetts | 4,602 | 6% |
| Total outbound | 80,934 | 100% |
| Trade partner | Tonnage | % of total |
|---|---|---|
| New York | 22,991 | 30% |
| Pennsylvania | 13,473 | 18% |
| Canada | 10,982 | 14% |
| New Jersey | 5,213 | 7% |
| Connecticut | 2,180 | 3% |
| Total inbound | 75,842 | 100% |
Based on FAF4.1 data with base year 2012 and forecasts up to 2045
Between 2012 and 2045, freight activity will increase in value by 60% in Albany and by 73% in Rochester.
Freight activity in parts of upstate NY (Central NY, North Country, Southern Tier, and Chautauqua County) will grow by 76% in value between 2012 and 2045.
This part of upstate NY has a domestic freight activity share of 95% by value in 2012 expected to decrease to 91% in 2045.
By 2045, outbound shipments from upstate NY to Europe will reach a tonnage share of 23% up from 14% in 2012.
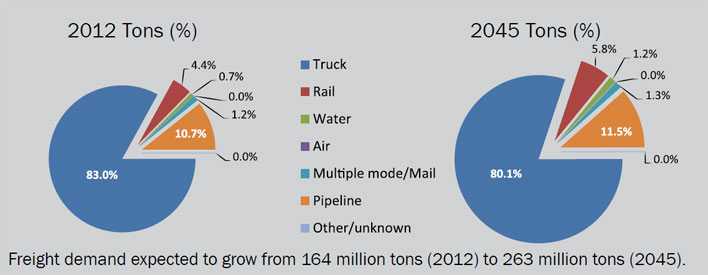
In 2012, trucks carried most of the freight in upstate NY--representing 80% in value and 83% in tonnage.
A cluster of freight generating businesses is located in the northern half of Onondaga County, close to I-90 and I-81.
In 2014, more than 40% of Onondaga County’s employment was from freight-intensive industries.
Air cargo totalling 162,500 tons landed at Syracuse’s Hancock International Airport in 2013, which was an almost 3% increase from 2012. The top three air cargo destinations from Syracuse are Memphis, Louisville, and Buffalo.
Syracuse is home to Destiny USA, the 6th largest shopping mall in North America, which attracts visitors from New York, New England, and Canada. Three of the largest Canadian cities (Toronto, Montreal, and Ottawa) are within a four-hour drive of the mall.
Two major interstates, I-81 and I-90, intersect just north of Syracuse, in the center of Onondaga County. The heavy vehicle interstate traffic share ranges between 11% and 15% in the Syracuse area.
Sources for Freight Facts: FAF4 Data, Bureau of Transportation Statistics (BTS), SMTC, NYSDOT
To view PDF files, you can use the Adobe® Reader®.

