| FHWA Policy Memorandums - Office of Environment and Planning | |
This order was canceled on July 27, 2004
| INFORMATION: Conformity and Nitrogen Oxides (Nox) | May 17, 1994 |
|
Director, FHWA Office of Environment and Planning Director, FTA Office of Planning |
HEP-40 |
|
Directors, FHWA Office of Planning and Program Development (Regions 1-7 and 10) Directors, FHWA Office of Program Development (Regions 8 and 9) Directors, FTA Office of Program Development (Regions 1-10) |
On March 10, 1994, we provided you with information and guidance on NOx emissions because of the difficulty that some State and metropolitan areas are experiencing with the new NOx requirements in the EPA's transportation conformity regulation. Attached is further information on efforts being made to understand and evaluate the NOx impacts of transportation plans and programs, The material summarizes what we have learned from Ohio's NOx modeling experiences, and suggestions we provided to further refine their NOx modeling capabilities.
Some key observations and conclusions from the Ohio analyses are as follows:
Another potential source of NOx reductions is from traffic flow improvements and demand management on highly congested arterial and local roadways. Typically, under the no-build alternative, these facilities operate at speeds below the NOx minimum point for significant time periods of the day. Any NOx increases from freeway improvements can often be offset by NOx reductions on arterials and local streets. This occurs on facilities parallel to the freeway because of traffic diversions, but this can also be aggressively pursued by including transportation demand management strategies and/or traffic flow improvement projects in the TIP for small congested facilities throughout the region as an offset for any emissions increases for the freeway or other high speed facility.
The best way to estimate emissions reductions from small facility improvements is to incorporate them into the simulation model network. This procedure directly estimates the effect of these improvements on operating speed and VMT. If the highway network of a given region is inadequate to support this level of detail, reasonable professional methodologies may be developed.
Also attached for your information is a copy of a memorandum dated April 5, 1994, from David J. Brzezinski, Chief of EPA's Model Development Section in Ann Arbor, Michigan, regarding the effect of VMT growth on MOBILE5A NOx estimates. The FHWA is currently reviewing this material and intends to discuss the methodology and conclusions with EPA. The EPA conducted an analysis on the effect of VMT growth rates because of the concern that even moderate growth rates would cause mobile source NOx emissions to exceed the 1990 base-year levels. Not surprisingly, the results show that as VMT growth rates increase, the 1990 base year emission levels will be exceeded sooner. For example, for an area that has a basic I/M program and a 2 percent annual growth rate, the 1990 levels would not be exceeded until 2020. However, the same area with a 4 percent annual VMT growth rate would exceed 1990 levels by 1992 and beyond. The analysis also shows that technology will also increase the time period before the 1990 levels are exceeded. For example, an area with an enhanced I/M program and the introduction of Low Emitting Vehicles will not exceed the 1990 base-year levels by 2020 for either a 2 percent or 4 percent annual VMT growth rate. Consequently, areas that are projecting their NOx emissions to exceed 1990 base-year levels will need to more aggressively pursue transportation demand management strategies and/or "opt" into additional technological programs.
As additional information on this important subject becomes available, we will continue to provide national distribution. We would also appreciate learning of other State and localmethodologies and insights for possible distribution.
| Samuel L. Zimmerman | Kevin E. Heanue |
9 Attachments
cc: Jane Garvey
Tony Kane
Ed Kussy
Reid Alsop
Abbe Marner, FTA
Camille Mittelholtz, OST
Phil Lorang, EPA
Paula Van Lare, EPA
Jon Kessler, EPA
Dave Clawson, AASHTO
Nancy Krueger, STAPPA/ALAPCO
Rich Weaver, APTA
Becky Brady, NCSL
Lydia Conrad, NGA
Joan Glickman, ICMA
Janet Oakley, NARC
Robert Fogel, NACO
Cara Woodsen, NLC
Kevin McCarthy, USCM
Leo Penne, Nevada Office
Mike McGarry, Ohio Office
Attachment 1
SUMMARY
Ohio NOx Analysis Methods
and
Opportunities for Further Refinement
INTRODUCTION
The Ohio DOT (ODOT) has done extensive work on their transportation modeling processes in order to comply with the air quality analysis requirements of the CAA and the recently enacted transportation conformity requirements. On March 10, 1994, Fred Ducca and John Byun of FHWA Headquarters visited ODOT to discuss issues related to conformity and NOx. Chuck Gebhardt represented ODOT. The following are findings from the visit:
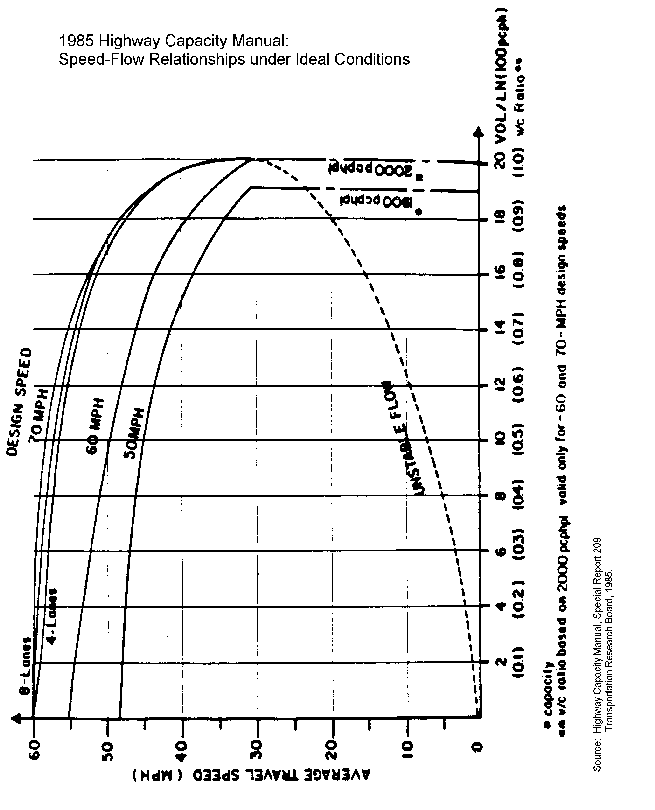
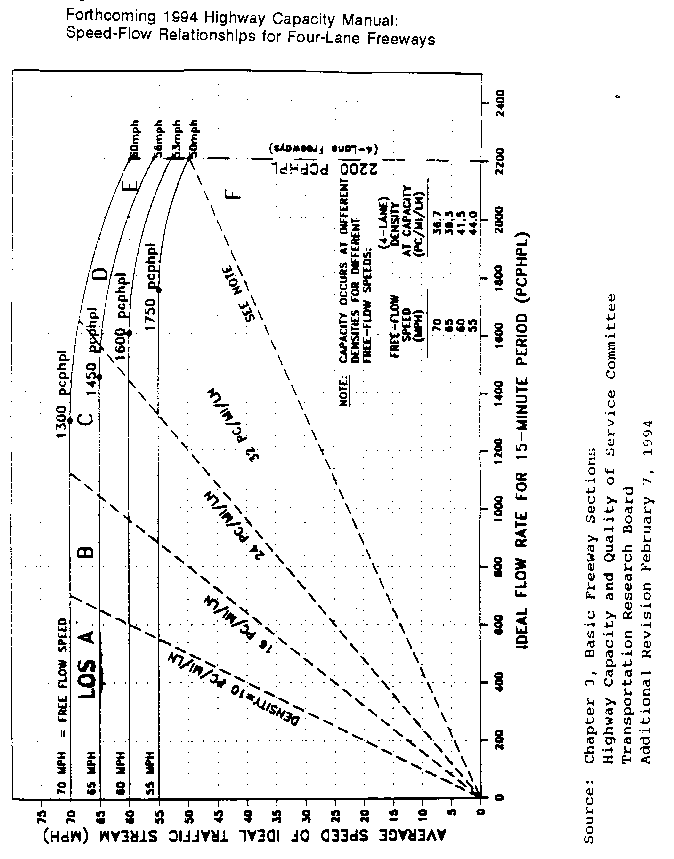
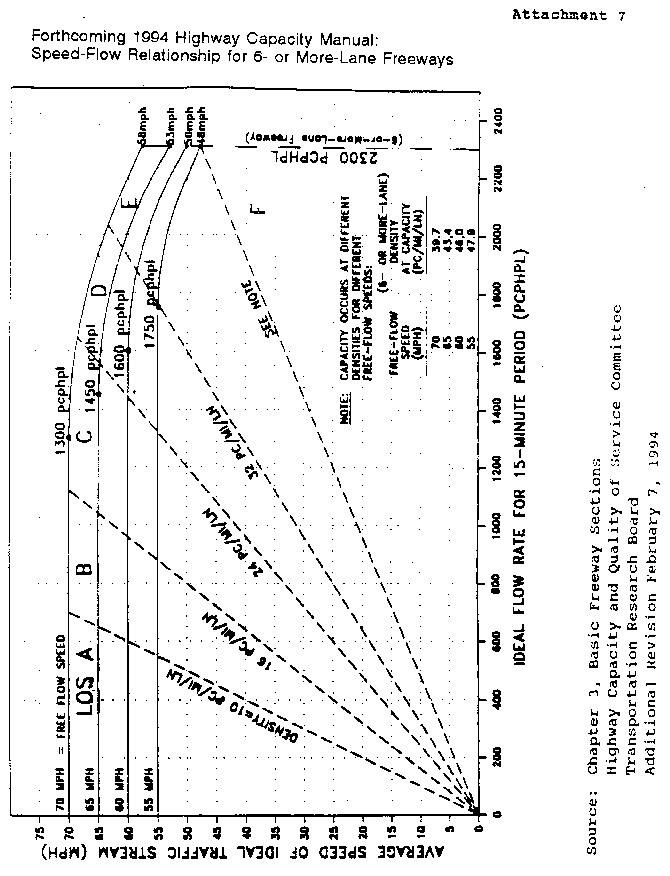
However, updates of these speed/capacity relationships are currently underway by the TRB Highway Capacity and Quality of Service Committee. New updates of the freeway curves were approved by the Committee in 1992 and were printed for the Committee on February 7, 1994. The latest research indicates that speed is almost constant with all Levels Of Service until volume reaches the critical level (see Attachments 6 and 7). Also, the Committee adopted increased freeway lane capacities from 2000 passenger cars per hour per lane (PCPHPL) to 2200 PCPHPL for 4-lane freeways and 2300 PCPHPL for 6-lane freeways. Publication of the new material as a formal part of the HCM is expected later this year.
It was expected that incorporating these updates in the model would reduce the difference in NOx emissions between build and no-build analysis. Also, the entire NOx analysis would need to be re-run within the modeling framework because the assignment process would redistribute traffic among arterials and freeways based on the newly adjusted link speeds. The results of making this is change in Ohio (see Attachment 8) raised the overall NOx estimates for both the build and the no-build cases slightly, but the build alternative became better than the no-build alternative for NOx in Springfield and Toledo, and NOx differences were reduced in the other areas.
The ODOT re-ran the NOx emissions model with revised speed curves for Cincinnati and modeled a strict late night speed limit enforcement. The results are shown below:
build alternative: 99.026 metric tons/day
no-build alternative: 98.657 metric tons/day
---------------------------------------------------------------
difference: 0.369 metric tons/day
percent difference: 0.37 percent
Therefore, speed enforcement for any 3-hour period between 11 p.m. and 6 a.m. would produce NOx reductions greater than the build/no-build difference in Cincinnati.
CONCLUSIONS
Attachment 2
| Factors for Pollutant | |||
| HC | CO | NOx | |
| For Ramps: | 1.5 | 1.5 | 110 |
| For Surface Arterials: | 110 | 1.0 | 110 |
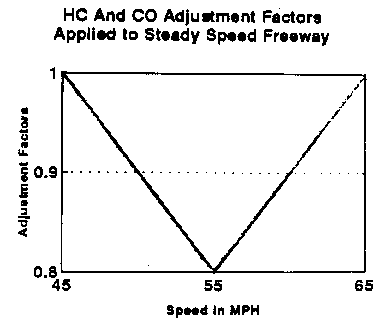
For freeways operating in a steady state mode with speed equal to or greater than 72 KPH (45 mph):·580
Attachment 3
| Without Factors # | With Factors # | ||||
| Study Area | Scenrio | NOx* Tons/Day | Difference In NOx | NOx Tons/Day | Difference In NOx |
| AKRON | No-Build | 38.375 | 34.280 | ||
| Build | 38.837 | 34.610 | |||
| 0.462 | 1.19% | 0.330 | 0.95% | ||
| CINCINNATI | No-Build | 92.610 | 84.225 | ||
| Build | 93.831 | 84.943 | |||
| 1.021 | 1.09% | 0.718 | 0.85% | ||
| SPRINGFIELD | No-Build | 8.273 | 7.443 | ||
| BuiId | 8.323 | 7.474 | |||
| 0.050 | 0.60% | 0.031 | 0.41% | ||
| TOLEDO | No-Build | 30.811 | 28.218 | ||
| Build | 30.975 | 28.366 | |||
| 0.164 | 0.53% | 0.148 | 0.52% | ||
| YOUNGSTOWN | No-Build | 27.315 | 25.105 | ||
| Build | 27.929 | 25.399 | |||
| 0.514 | 1.85% | 0.294 | 1.16% | ||
Source: OHIO DOT. Chuck Gebhardt
* Units are In metric tons and can be converted to English tons by multiplying by 1.1024.
# ODOT developed factors associated with freeway ramp and mainline operations (see Attachment 2).
Attachment 4
| Description | Transit Trips | NOx Tons/Day* | Difference in NOx# |
| 1996 No-Build Base Case | 22,966 | 20.285 | |
| Base Transit Fare = $0.50 | |||
| Transit Fare = $0.25 | 37,244 | 20.231 | -0.26% |
| Transit Fare = $0.00 | 61,232 | 20.l33 | -0.75% |
| Add Parking Cost $5.00 | 65,170 | 20.093 | -0.94% |
| (where fee imposed) | |||
| Auto Out of Pocket Cost | 25,436 | 20.148 | -0.68% |
| (10% Increase) | |||
| Auto Out of Pocket Cost | 28,104 | 20.074 | -1.04% |
| (25% Increase) | |||
| Transit Frequency | 33,042 | 20.236 | -0.24% |
| (50% Increase) | |||
| Transit Frequency | 38,952 | 20.2l2 | -0.36% |
| (100% Increase) | |||
| Auto Work Trip | 22,966 | 20.2O3 | -0.40% |
| (5% Reduction) | |||
| Auto Work Trip | 22,966 | 19.9l6 | -l.82% |
| (10% Reduction) |
Source: OHIO DOT, Chuck Gobhardt
*Total daily mobil source NOX in metric tons. MOBILE4.1 was used for the study.
#Individual TCM9 wore evaluated and compared with 1996 no-build base Cass.
1985 Highway Capacity Manual:
Speed-Flow Relationships under Ideal Conditions
Attachmen*. c.
Attachment 6
Attachment a
| Study Area | Scenario NOx | Tons/Day | Difference in NOx |
| AKRON | No-Build | 40.641 | |
| Build | 40.837 | ||
| 0.196 | 0.48% | ||
| CINCINNATI | No-Build | 98.657 | |
| Build | 99.026 | ||
| 0.369 | 0.37% | ||
| SPRINGFIELD | No-Build | 8.525 | |
| Build | 8.516 | ||
| -0.009 | -0.10% | ||
| TOLEDO | No-Build | 32.691 | |
| Build | 32.667 | ||
| -0.024 | -0.07% | ||
| YOUNGSTOWN | No-Build | 28.046 | |
| Build | 28.445 | ||
| 0.399 | 1.40% |
Source: OHIO DOT, Chuck Gobhardt
* Units are In metric tons and can be converted to English tons by multiplying by 1.1024.

April 5, 1994
MEMORANDUM
| SUBJECT: | Effect of VMT Growth on MOBILE5 NCx Estimates | ||
| FROM: | David J..Brzezinski, Chief Model Development Section, AQAB | ||
| TO: | Philip A. Lorang, Director Emission Planning and strategies Division, OMS THRU: | Lois A. Platte, Chief | Air Quality Analysis Branch, EPSD |
There is some concern that future highway mobile source fleet emissions of oxides of nitrogen (NOx) will exceed base year 1990 levels even with moderate growth in vehicle miles travelled (VMT). We have examined this issue and provide the following analysis.
Using the latest version of the MOBILE5 model (March 26, 1993), a base scenario was chosen using the following parameters:
Other parameters were varied to investigate their effect on the trend in emissions. Primary in these was the assumed I/M program description, since I/M can affect current and future NOx emission levels. The following I/M program descriptions were used:
Basic
IM240 Program
All scenarios were done at 19.6 miles per hour. Non-I/M cases were done at 27 and 50 miles per hour to investigate the potential effect of speed on the Nox results. Also, one case 4as done assuming introduction of new vehicles certified to the ne,4 Low Emitting Vehicle (LEV) standards proposed by California. The model was evaluated every other calendar year from 1990 through 2020. Growth rates from zero to 6% were assumed and applied linearly to the 1990 base NOx levels. The results of the analyses are presented in the attached tables.
Table I shows the non-1/m case at 19.6 miles per hour. In this case a growth rate of 2% will cause NOx emission levels to exceed 1990 base Nox emission levels, but not until calendar year 2020. A 3% growth will cause NOx emission levels to exceed the 1990 base NOx emission levels immediately. Fleet turnover, however, keeps NOx levels close to the 1990 levels until 2010, when the growth in VMT overcomes fleet turnover and emission increase continuously.
Table 2 shows the Basic I/M case at 19.6 miles per hour. The Basic I/M program design reduces NOx emissions by deterrence of tampering behaviour and repairs of tampering with emission control@ devices that control Nox emissions. In this case, as in the nonI/M case, a growth rate of 2% will cause NOx emission levels to exceed 1990 base NOx emission levels, but not until calendar year 2020. A 3% growth will not cause NOx emission levels to exceed the 1990 base NOx emission levels until calendar year 2000. A 4% growth causes NOx emissions to increase continuously. In this case, if it is assumed that in the 1990 base year there was no I/'M program, the 1990 NOx emission target would be 3.000 g/mi. Therefore, if the I/M program were applied after the base year as a control strategy, at a 3% growth, the I/M program would delay the exceedance of the 1990 base levels until calendar year 2010.
Table 3 shows the IM240 I/M case at 19.6 miles per hour. The IM240 I/M program design identifies high Nox emitting vehicles using an IM240 test and requires their repair in addition to identifying vehicles with tampering. In this case, a growth rate of 2% will not cause NOx emission levels to exceed 1990 base NC:-, emission levels until sometime after calendar year 2020 (the ii M4@ of the model). A 3% growth will not cause Nox emission levels t:) exceed the 1990 base NOx emission levels until calendar year 2020. A 4% growth causes NOx emissions to exceed 1990 levels in calendar year 2012. A 5% growth causes NOx emissions increase continuously. As before for the Basic I/M case, if it is assumed that 4@n the '990 base year t.@ere was no 7@/'M program, the emission-target would be 3.000 g/mi. Tlierefore, iO tire I/'M pr-,zram were applied after the base year as a control strategy, at a 3% growth, the I/M przgram would not exceed the 1990 base levels unt4.1 afl-.i.ar calendar year 2020. '@"he exceedance for a 4% growth woul-4@ !me delayed until calendar year 2014. Even a 5* growth would not cause an ex@.eedance unt4.1 calendar year 2008.
Table 4 repeat3 the 'LM240 I/M case at 19.6 miles per h@u" assuming introduction of new vehicles certified to the new Lc w Emitting vehicle (LEV) standards proposed by California. 7hese vehicles will be subject to a moze stringent IM240 exhaust emissions cutpoints resulting in emission rates which will, ^.n average, meet the emission standards for these vehicles at miles. The LEV program is phased in starting in 1994 and is fully operational by 2003. in addit4.on to the NOx reducing effects @f the I/M program, the lower new iehicle NOx standards continues @-he effect of fleet vzehicle turnover. :n this case, a growth rate o.' 5% will cause NOx emission levels to exceed 1990 base NOx emission levels until 2000 when the reduction in emissions due to the LEV program outweighs the VMT growth. The LEV program continues to cause reductions until sometime after calendar year 2020 (the limit of the model). Similarlyt a 6% growth will cause Nox emission levels to exceed the 1990 base Nox emission levels unt4.1 calendar year 2000. But, the LEV program causes a reduction for the period 2000 through 2012. As before for the Basic I/M case, if it is assumed that in the 1990 base year there was no I/M program, the 1990 Nox emission target would be 3.000 g/mi. Therefore, if the I/M program were applied after the base year as a control strategy, up to a 6% growth, the I/M program would not exceed the 1990 base levels until after calendar year 2020.
Most urban areas have fleet average trip speeds greater than 19.6 miles per hour. For comparison, the non-I/M case was repeated assuming an average trip speed of 27 miles per hour and are shown in Table 5. In this case, although the absolute NOx emission rates have changed, the effect of growth on exceedance of the 1990 base NOx emission levels is similar. A similar table done with a speed of 50 miles per hour shoW3 a similar outcome. This demonstrates that the effect of speed on absolute NOx emission'levels is not a major factor in the exceedance of 1990 ba3e NOx emission levels.
Tabld 6 shows the factors used to increase the emission rate3 to reflect increases in VMT as a result of growth. Growth was assumed to be a linear increase in @-MT from the base year level.
cc: T. Newell
C. Radwan
J. Armstrong, ECSB
Table 1
All Vehicle Fleet NOx Emission Rate (g/mi) with Growth
Without I/M Case (1 9.6 mph)
| Growth Rate | ||||||||
| Calendar Year | Year | 0% | 1% | 2% | 3% | 4% | 5% | 6% |
| 1990 | 0 | 3.000 | 3.000 | 3.000 | 3.000 | 3.000 | 3.000 | 3.C)OO |
| 1991 | 1 | |||||||
| 1992 | 2 | 2.830 | 2.887 | 2.943 | 3.000 | 3.056 | 3.113 | 3.170 |
| 1993 | 3 | |||||||
| 1994 | 4 | 2.689 | 2.797 | 2.904 | 3.012 | 3.119 | 3.227 | 3.334 |
| 1995 | 5 | |||||||
| 1996 | 6 | 2.536 | 2.688 | 2.840 | 2.992 | 3.145 | 3.297 | 3.449 |
| 1997 | 7 | |||||||
| 1998 | 8 | 2.419 | 2.613 | 2.806 | 3.000 | 3.193 | 3.387 | 3.580 |
| 1999 | 9 | |||||||
| 2000 | 10 | 2.274 | 2.501 | 2.729 | 2.956 | 3.184 | 3.411 | 3.638 |
| 2001 | 11 | |||||||
| 2002 | 12 | 2.153 | 2.411 | 2.670 | 2.928 | 3.186 | 3.445 | 3.703 |
| 2003 | 13 | |||||||
| 2004 | 14 | 2.061 | 2.350 | 2.638 | 2.927 | 3.215 | 3.504 | 3.792 |
| 2005 | 15 | |||||||
| 2006 | 16 | 2.015 | 2.337 | 2.660 | 2.982 | 3.305 | 3.627 | 3.949 |
| 2007 | 17 | |||||||
| 2008 | 18 | 1.973 | 2.328 | 2.683 | 3.038 | 3.394 | 3.749 | 4.104 |
| 2009 | 19 | |||||||
| 2010 | 20 | 1.950 | 2.340 | 2.730 | 3.120 | 3.510 | 3.900 | 4.290 |
| 2011 | 21 | |||||||
| 2012 | 22 | 1.931 | 2.356 | 2.781 | 3.205 | 3.630 | 4.055 | 4.480 |
| 2013 | 23 | |||||||
| 2014 | 24 | 1.920 | 2.381 | 2.842 | 3.302 | 3.763 | 4.224 | 4.685 |
| 2015 | 25 | |||||||
| 2016 | 26 | 1.916 | 2.414 | 2.912 | 3.410 | 3.909 | 4.407 | 4.905 |
| 2017 | 27 | |||||||
| 2018 | 28 | 1.916 | 2.452 | 2.989 | 3.525 | 4.062 | 4.598 | 5.135 |
| 2019 | 29 | |||||||
| 2020 | 30 | 1.917 | 2.492 | 3.067 | 3.642 | 4.217 | 4.793 | 5.368 |
NOXCAP2.XLS 3/21/94
Table 2
All Vehicle Fleet NOx Emission Rate (g/mi) with Growth
Basic I/M & ATP Case (1 9.6 mph)
| Growth Rate | ||||||||
| Calendar Year | Year | 0% | 1% | 2% | 3% | 4% | 5% | 6% |
| 1990 | 0 | 2.947 | 2.947 | 2.947 | 2.947 | 2.947 | 2.947 | 2.947 |
| 1991 | 1 | |||||||
| 1992 | 2 | 2.764 | 2.819 | 2.875 | 2.930 | 2.985 | 3.040 | 3.096 |
| 1993 | 3 | |||||||
| 1994 | 4 | 2.614 | 2.719 | 2.823 | 2.928 | 3.032 | 3.137 | 3.241 |
| 1995 | 5 | |||||||
| 1996 | 6 | 2.470 | 2.618 | 2.766 | 2.915 | 3.063 | 3.211 | 3.359 |
| 1997 | 7 | |||||||
| 1998 | 8 | 2.357 | 2.546 | 2.734 | 2.923 | 3.111 | 3.300 | 3.488 |
| 1999 | 9 | |||||||
| 2000 | 10 | 2.215 | 2.437 | 2.658 | 2.880 | 3.101 | 3.323 | 3.544 |
| 2001 | 11 | |||||||
| 2002 | 12 | 2.097 | 2.349 | 2.600 | 2.852 | 3.104 | 3.355 | 3.607 |
| 2003 | 13 | |||||||
| 2004 | 14 | 2.007 | 2.288 | 2.569 | 2.850 | 3.131 | 3.412 | 3.693 |
| 2005 | 15 | |||||||
| 2006 | 16 | 1.962 | 2.276 | 2.590 | 2.904 | 3.218 | 3.532 | 37846 |
| 2007 | 17 | |||||||
| 2008 | 18 | 1.921 | 2.267 | 2.613 | 2.958 | 3.304 | 3.650 | 3.996 |
| 2009 | 19 | |||||||
| 2010 | 20 | 1.898 | 2.278 | 2.657 | O3.037 | 3.416 | 3.796 | 4.176 |
| 2011 | 21 | |||||||
| 2012 | 22 | 1.879 | 2.292 | 2.706 | 3.119 | 3.533 | 3.946 | 4.359 |
| 2013 | 23 | |||||||
| 2014 | 24 | 1.868 | 2.316 | 2.765 | 3.213 | 3.661 | 4.110 | 4.558 |
| 2015 | 25 | |||||||
| 2016 | 26 | 1.864 | 2.349 | 2.833 | 3.318 | 3.803 | 4.287 | 4.772 |
| 2017 | 27 | |||||||
| 2018 | 28 | 1.864 | 2.386 | 2.908 | 3.430 | 3.952 | 4.474 | 4.996 |
| 2019 | 29 | |||||||
| 2020 | 30 | 1.865 | 2.425 | 2.984 | 3.544 | 4.103 | 4.663 | 5.222 |
NOXCAP2.XLS 3/21/94
Table 3
All Vehicle Fleet NOx Emission Rate (g/mi) with Growth
IM240 & ATP I/M Case (1 9.6 mph)
| Growth Rate | ||||||||
| Calendar Year | Year | 0% | 1% | 2% | 3% | 4% | 5% | 6% |
| 1990 | 0 | 2.854 | 2.854 | 2.854 | 2.854 | 2.854 | 2.854 | 2.854 |
| 1991 | 1 | |||||||
| 1992 | 2 | 2.615 | 2.667 | 2.720 | 2.772 | 2.824 | 2.877 | 2.929 |
| 1993 | 3 | |||||||
| 1994 | 4 | 2.408 | 2.504 | 2.601 | 2.697 | 2.793 | 2.890 | 2.986 |
| 1995 | 5 | |||||||
| 1996 | 6 | 2.213 | 2.346 | 2.479 | 2.611 | 2.744 | 2.877 | 3.010 |
| 1997 | 7 | |||||||
| 1998 | 8 | 2.062 | 2.2.27 | 2.392 | 2.557 | 2.722 | 2.887 | 3.052 |
| 1999 | 9 | |||||||
| 2000 | 10 | 1.906 | 2.097 | 2.287 | 2.478 | 2.668 | 2.859 | 3.050 |
| 2001 | 11 | |||||||
| 2002 | 12 | 1.784 | 1.998 | 2.212 | 2.426 | 2.640 | 2.854 | 3.068 |
| 2003 | 13 | |||||||
| 2004 | 14 | 1.691 | 1.928 | 2.164 | 2.401 | 2.638 | 2.875 | 3.111 |
| 2005 | 15 | |||||||
| 2006 | 16 | 1.643 | 1.906 | 2.169 | 2.432 | 2.695 | 2.957 | 3-220 |
| 2007 | 17 | |||||||
| 2008 | 18 | 1.599 | 1.887 | 2.175 | 2.462 | 2.750 | 3.038 | 3.326 |
| 2009 | 19 | |||||||
| 2010 | 20 | 1.576 | 1.891 | 2.206 | 2.522 | 2.837 | 3.152 | 3.467 |
| 2011 | 21 | |||||||
| 2012 | 22 | 1.561 | 1.904 | 2.248 | 2.591 | 2.935 | 3.278 | 3.622 |
| 2013 | 23 | |||||||
| 2014 | 24 | 1.552 | 1.924 | 2.297 | 2.669 | 3.042 | 3.414 | 3.787 |
| 2015 | 25 | |||||||
| 2016 | 26 | 1.549 | 1.952 | 2.354 | 2.757 | 3.160 | 3.563 | 3.965 |
| 2017 | 27 | |||||||
| 2018 | 28 | 1.550 | 1.984 | 2.418 | 2.852 | 3.286 | 3.720 | 4.154 |
| 2019 | 29 | |||||||
| 2020 | 30 | 1.551 | 2.016 | 2.482 | 2.947 | 3.412 | 3.878 | 4.343 |
NOXCAP2.XLS 3/21/94
Table 4
All Vehicle Fleet NOx Emission Rate (g/mi) with Growth
LEV Stds. with Full IM240 & ATP I/M Case (19.6 mph)
| Growth Rate | ||||||||
| Calendar Year | Year | 0% | 1% | 2% | 3% | 4% | 5% | 6% |
| 1990 | 0 | 2.854 | 2.854 | 2.854 | 2.854 | 2.854 | 2.854 | 2.854 |
| 1991 | 1 | |||||||
| 1992 | 2 | 2.615 | 2.667 | 2.720 | 2.772 | 2.824 | 2.877 | 2.929 |
| 1993 | 3 | |||||||
| 1994 | 4 | 2.403 | 2.499 | 2.595 | 2.691 | 2.787 | 2.884 | 2.980 |
| 1995 | 5 | |||||||
| 1996 | 6 | 2.183 | 2.314 | 2.445 | 2.576 | 2.707 | 2.838 | 2.969 |
| 1997 | 7 | |||||||
| 1998 | 8 | 2.028 | 2.190 | 2.352 | 2.515 | 2.677 | 2.839 | 3.001 |
| 1999 | 9 | |||||||
| 2000 | 10 | 1.847 | 2.032 | 2.216 | 2.401 | 2.586 | 2.771 | 2.955 |
| 2001 | 11 | |||||||
| 2002 | 12 | 1.670 | 1.870 | 2.071 | 2.271 | 2.472 | 2.672 | 2.872 |
| 2003 | 13 | |||||||
| 2004 | 14 | 1.496 | 1.705 | 1.915 | 2.124 | 2.334 | 2.543 | 2.753 |
| 2005 | 15 | |||||||
| 2006 | 16 | 1.364 | 1.582 | 1.800 | 2.019 | 2.237 | 2.455 | 2.673 |
| 2007 | 17 | |||||||
| 2008 | 18 | 1.252 | 1.477 | 1.703 | 1.928 | 2.153 | 2.379 | 2.604 |
| 2009 | 19 | |||||||
| 2010 | 20 | 1.163 | 1.396 | 1.628 | 1.861 | 2.093 | 2.326 | 2.559 |
| 2011 | 21 | |||||||
| 2012 | 22 | 1.094 | 1.335 | 1.575 | 1.816 | 2.057 | 2.297 | 2.538 |
| 2013 | 23 | |||||||
| 2014 | 24 | 1.056 | 1.309 | 1.563 | 1.816 | 2.070 | 2.323 | 2.577 |
| 2015 | 25 | |||||||
| 2016 | 26 | 1.036 | 1.305 | 1.575 | 1.844 | 2.113 | 2.383 | 2.652 |
| 2017 | 27 | |||||||
| 2018 | 28 | 1.025 | 1.312 | 1.599 | i.Sm | 2.173 | 2.460 | 2.747 |
| 2019 | 29 | |||||||
| 2020 | 30 | 1.021 | 1.327 | 1.634 | 1.940 | 2.246 | 2.553 | 2.859 |
NOXCAP2.XLS 4/1/94
Table 5
All Vehicle Feet NOx Emission Rate (g/mi) with. Growth
Without I/M Case (27 mph)
| Growth Rate | ||||||||
| Calendar Year | Year | 0% | 1% | 2% | 3% | 4% | 5% | 6% |
| 1990 | 0 | 2.968 | 2.968 | 2.968 | 2.968 | 2.968 | 2.968 | 2.968 |
| 1991 | 1 | |||||||
| 1992 | 2 | 2.801 | 2.857 | 2.913 | 2.969 | 3.025 | 3.081 | 3.137 |
| 1993 | 3 | |||||||
| 1994 | 4 | 2.670 | 2.777 | 2.884 | 2.990 | 3.097 | 3.204 | 3.311 |
| 1995 | 5 | |||||||
| 1996 | 6 | 2.522 | 2.673 | 2.825 | 2.976 | 3.127 | 3.279 | 3.430 |
| 1997 | 7 | |||||||
| 1998 | 8 | 2.401 | 2.593 | 2.785 | 2.977 | 3.169 | 3.361 | 3.553 |
| 1999 | 9 | |||||||
| 2000 | 10 | 2.255 | 2.481 | 2.706 | 2.932 | 3.157 | 3.383 | 3.608 |
| 2001 | 11 | |||||||
| 2002 | 12 | 2.133 | 2.389 | 2.645 | 2.901 | 3.157 | 3.413 | 3.669 |
| 2003 | 13 | |||||||
| 2004 | 14 | 2.043 | 2.329 | 2.615 | 2.901 | 3.187 | 3.473 | 3.759 |
| 2005 | 15 | |||||||
| 2006 | 16 | 1.997 | 2.317 | 2.636 | 2.956 | 3.275 | 3.595 | 3.914 |
| 2007 | 17 | |||||||
| 2008 | 18 | 1.955 | 2.307 | 2.659 | 3.011 | 3.363 | 3.715 | 4.066 |
| 2009 | 19 | |||||||
| 2010 | 20 | 1.933 | 2.320 | 2.706 | 3.093 | 3.479 | 3.866 | 4.253 |
| 2011 | 21 | |||||||
| 2012 | 22 | 1.913 | 2.334 | 2.755 | 3.176 | 3.596 | 4.017 | 4.438 |
| 2013 | 23 | |||||||
| 2014 | 24 | 1.902 | 2.358 | 2.815 | 3.271 | 3.728 | 4.184 | 4.641 |
| 2015 | 25 | |||||||
| 2016 | 26 | 1.897 | 2.390 | 2.883 | 3.377 | 3.870 | 4.363 | 4.856 |
| 2017 | 27 | |||||||
| 2018 | 28 | 1.897 | 2.428 | 2.959 | 3.490 | 4.022 | 4.553 | 5.084 |
| 2019 | 29 | |||||||
| 2020 | 30 | 1.897 | 2.466 | 3.035 | 3.604 | 4.173 | 4.743 | 5.312 |
NOXCAP2.XLS 3/21 @'94
Table 6
All Vehicie Fleet NOx Emission Rate (g/mi) wft Growth
Without I/M Case (50 mph)
Calendar Growth Rate
Year Year 0% 1% 2% 3% 4% 5% 6%
| Growth Rate | ||||||||
| Calendar Year | Year | 0% | 1% | 2% | 3% | 4% | 5% | 6% |
| 1990 | 0 | 3.499 | 3.499 | 3.499 | 3.499 | 3.499 | 3.499 | 3.499 |
| 1991 | 1 | |||||||
| 1992 | 2 | 3.264 | 3.329 | 3.395 | 3.460 | 3.525 | 3.590 | 3.656 |
| 1993 | 3 | |||||||
| 1994 | 4 | 3.088 | 3.212 | 3.335 | 3.459 | 3.582 | 3.70.6 | 3.829 |
| 1995 | 5 | |||||||
| 1996 | 6 | 2.900 | 3.074 | 3.248 | 3.422 | 3.596 | 3.770 | 3.944 |
| 1997 | 7 | |||||||
| 1998 | 8 | 2.741 | 2.960 | 3.180 | 3.399 | 3.618 | 3.837 | 4.057 |
| 1999 | 9 | |||||||
| 2000 | 10 | 2.560 | 2.816 | 3.072 | 3.328 | 3.584 | 3.840 | 4.096 |
| 2001 | 11 | |||||||
| 2002 | 12 | 2.410 | 2.699 | 2.988 | 3.278 | 3.567 | 3.856 | 4.145 |
| 2003 | 13 | |||||||
| 2004 | 14 | 2.299 | 2.621 | 2.943 | 3.265 | 3.586 | 3.908 | 4.230 |
| 2005 | 15 | |||||||
| 2006 | 16 | 2.244 | 2.603 | 2.962 | 3.321 | 3.680 | 4.039 | 4.398 |
| 2007 | 17 | |||||||
| 2008 | 18 | 2.195 | 2.590 | 2.985 | 3.380 | 3.T75 | 4.171 | 4.566 |
| 2009 | 19 | |||||||
| 2010 | 20 | 2.168 | 2.602 | 3.035 | 3.469 | 3.902 | 4.336 | 4.770 |
| 2011 | 21 | |||||||
| 2012 | 22 | 2.143 | 2.614 | 3.086 | 3.557 | 4.029 | 4.500 | 4.972 |
| 2013 | 23 | |||||||
| 2014 | 24 | 2.130 | 2.641 | 3.152 | 3.664 | 4.175 | 4.686 | 5.197 |
| 2015 | 25 | |||||||
| 2016 | 26 | 2.125 | 2.678 | 3.230 | 3.783 | 4.335 | 4.888 | 5.440 |
| 2017 | 27 | |||||||
| 2018 | 28 | 2.125 | 2.720 | 3.315 | 3.910 | 4.505 | 5.100 | 5.695 |
| 2019 | 29 | |||||||
| 2020 | 30 | 2.125 | 2.763 | 3.400 | 4.038 | 4.675 | 5.313 | 5.950 |
NOXCAP2.XLS 3,'24,'94
Table 7
NOx Emission Rate
Assumed Linear Growth Factors
Calendar Growth Rate
Year Year 0% 1% 2% 3% 4% 5% 6%
| Growth Rate | ||||||||
| Calendar Year | Year | 0% | 1% | 2% | 3% | 4% | 5% | 6% |
| 1990 | 0 | 1.000 | 1.000 | 1.000 | 1.000 | 1.000 | 1.000 | 1.000 |
| 1991 | 1 | |||||||
| 1992 | 2 | 1.000 | 1.020 | 1.040 | 1.060 | 1.080 | 1.100 | 1.120 |
| 1993 | 3 | |||||||
| 1994 | 4 | 1.000 | 1.040 | 1.080 | 1.120 | 1.160 | 1.200 | 1.240 |
| 1995 | 5 | |||||||
| 1996 | 6 | 1.000 | 1.060 | 1.120 | 1.180 | 1.240 | 1.300 | 1.360 |
| 1997 | 7 | |||||||
| 1998 | 8 | 1.000 | 1.080 | 1.160 | 1.240 | 1.320 | 1.400 | 1.480 |
| 1999 | 9 | |||||||
| 2000 | 10 | 1.000 | 1.100 | 1.200 | 1.300 | 1.400 | 1.500 | 1.600 |
| 2001 | 11 | |||||||
| 2002 | 12 | 1.000 | 1.120 | 1.240 | 1.360 | 1.480 | 1.600 | 1.720 |
| 2003 | 13 | |||||||
| 2004 | 14 | 1.000 | 1.140 | 1.280 | 1.420 | 1.560 | 1.700 | 1.840 |
| 2005 | 15 | |||||||
| 2006 | 16 | 1.000 | 1.160 | 1.320 | 1.480 | 1.640 | 1.800 | 1-.960 |
| 2007 | 17 | |||||||
| 2008 | 18 | 1.000 | 1.180 | 1.360 | 1.540 | 1.720 | 1.900 | 2.080 |
| 2009 | 19 | |||||||
| 2010 | 20 | 1.000 | 1.200 | 1.400 | 1.600 | 1.800 | 2.000 | 2.200 |
| 2011 | 21 | |||||||
| 2012 | 22 | 1.000 | 1.220 | 1.440 | 1.660 | 1.880 | 2.100 | 2.320 |
| 2013 | 23 | |||||||
| 2014 | 24 | 1.000 | 1.240 | 1.480 | 1.720 | 1.960 | 2.200 | 2.440 |
| 2015 | 25 | |||||||
| 2016 | 26 | 1.000 | 1.260 | 1.520 | 1.780 | 2.040 | 2.300 | 2.560 |
| 2017 | 27 | |||||||
| 2018 | 28 | 1.000 | 1.280 | 1.560 | 1.840 | 2.120 | 2.400 | 2.680 |
| 2019 | 29 | |||||||
| 2020 | 30 | 1.000 | 1.300 | 1.600 | 1.900 | 2.200 | 2.500 | 2.800 |
NOXCAP2.XLS 3.'2 4.94