| Highway Statistics 2000 | OHPI > Highway Statistics > 2000 > Roadway Extent > Congestion Trends |

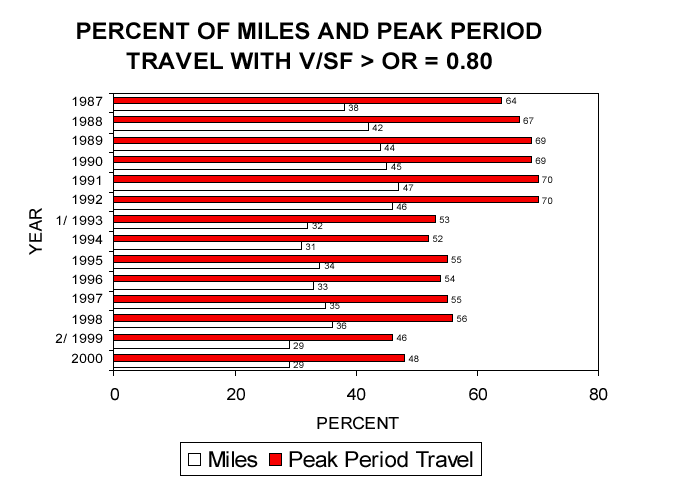
| Year | Miles (percent) | Peak Period Travel (percent) |
|---|---|---|
| 1987 | 38 | 64 |
| 1988 | 42 | 67 |
| 1989 | 44 | 69 |
| 1990 | 45 | 69 |
| 1991 | 47 | 70 |
| 1992 | 46 | 70 |
| 1993 | 32 | 53 |
| 1994 | 31 | 52 |
| 1995 | 34 | 55 |
| 1996 | 33 | 54 |
| 1997 | 35 | 55 |
| 1998 | 36 | 56 |
| 1999 | 29 | 46 |
| 2000 | 29 | 48 |

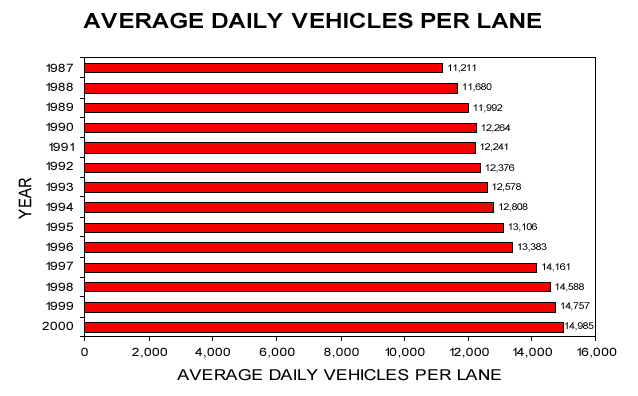
| Year | Average Daily Vehicles per Lane |
|---|---|
| 1987 | 11,211 |
| 1988 | 11,680 |
| 1989 | 11,992 |
| 1990 | 12,264 |
| 1991 | 12,241 |
| 1992 | 12,376 |
| 1993 | 12,578 |
| 1994 | 12,808 |
| 1995 | 13,106 |
| 1996 | 13,383 |
| 1997 | 14,161 |
| 1998 | 14,588 |
| 1999 | 14,757 |
| 2000 | 14,985 |
This chart is also availible for download in the following format:
To view PDF files, you need the Acrobat® Reader®.
OHPI Home | Highway Statistics 2000 | Data Feedback