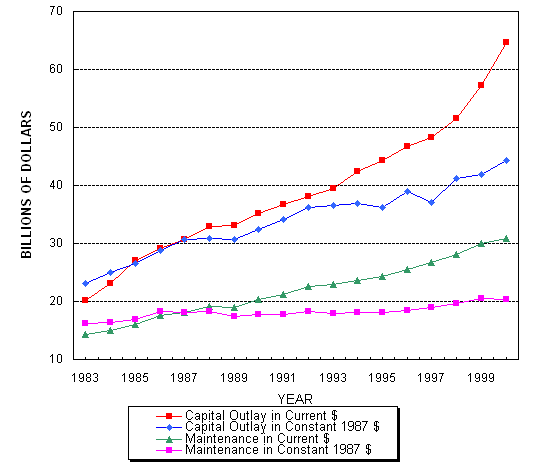
| Highway Statistics 2000 | OHPI > Highway Statistics > 2000 > Highway Finance > Highway Expenditures Chart |
HIGHWAY PRICE TRENDS AND CONSUMER PRICE INDEX
Maintenance Constant 1987 Dollars are calculated using the Consumer Price Index |

| Year | Capital Outlay in Current $ | Capital Outlay in Constant 1987 $ | Maintenance in Current $ | Maintenance in Constant 1987 $ |
|---|---|---|---|---|
| 1983 | 20.22 | 23.09 | 14.24 | 16.24 |
| 1984 | 23.12 | 24.97 | 15.01 | 16.40 |
| 1985 | 27.14 | 26.61 | 16.03 | 16.93 |
| 1986 | 29.18 | 28.86 | 17.65 | 18.29 |
| 1987 | 30.67 | 30.67 | 18.15 | 18.15 |
| 1988 | 32.88 | 30.85 | 19.11 | 18.36 |
| 1989 | 33.14 | 30.77 | 18.95 | 17.36 |
| 1990 | 35.15 | 32.40 | 20.37 | 17.69 |
| 1991 | 36.64 | 34.08 | 21.22 | 17.70 |
| 1992 | 38.07 | 36.22 | 22.58 | 18.28 |
| 1993 | 39.53 | 36.50 | 22.89 | 18.00 |
| 1994 | 42.38 | 36.82 | 23.55 | 18.05 |
| 1995 | 44.23 | 36.22 | 24.32 | 18.12 |
| 1996 | 46.81 | 38.94 | 25.57 | 18.51 |
| 1997 | 48.36 | 37.03 | 26.78 | 18.95 |
| 1998 | 51.61 | 41.22 | 28.17 | 19.64 |
| 1999 | 57.23 | 41.93 | 30.00 | 20.46 |
| 2000 | 64.57 | 44.35 | 30.92 | 20.40 |
This chart is also availible for download in the following format:
To view PDF files, you need the Acrobat® Reader®.
OHPI Home | Highway Statistics 2000 | Data Feedback