| Highway Statistics 2000 | OHPI > Highway Statistics > 2000 > Roadway Extent > Volumes and Loadings |

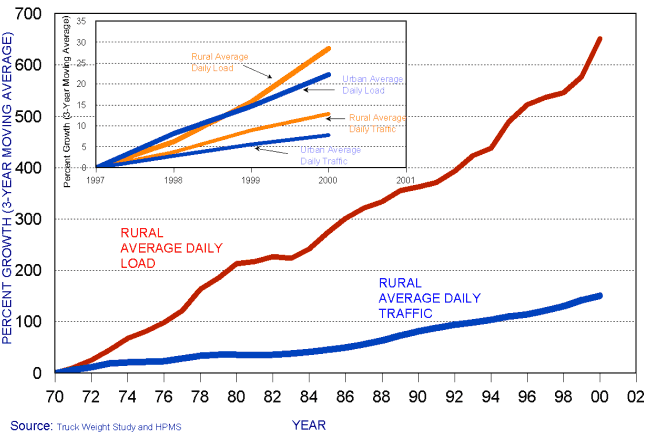
| Year | Rural Average Daily Traffic | Rural Average Daily Load |
|---|---|---|
| 1970 | 0.0 | 0.0 |
| 1971 | 5.6 | 10.6 |
| 1972 | 11.6 | 25.1 |
| 1973 | 18.6 | 45.4 |
| 1974 | 20.5 | 67.6 |
| 1975 | 21.7 | 81.0 |
| 1976 | 22.9 | 98.1 |
| 1977 | 28.5 | 121.5 |
| 1978 | 33.8 | 163.5 |
| 1979 | 36.1 | 185.1 |
| 1980 | 36.2 | 213.1 |
| 1981 | 34.6 | 216.9 |
| 1982 | 35.4 | 226.6 |
| 1983 | 37.5 | 223.3 |
| 1984 | 41.1 | 241.7 |
| 1985 | 45.1 | 273.6 |
| 1986 | 49.6 | 301.2 |
| 1987 | 55.8 | 321.6 |
| 1988 | 63.6 | 334.1 |
| 1989 | 72.7 | 355.7 |
| 1990 | 81.3 | 362.9 |
| 1991 | 88.1 | 370.9 |
| 1992 | 93.6 | 393.4 |
| 1993 | 98.0 | 422.7 |
| 1994 | 103.8 | 438.1 |
| 1995 | 110.4 | 490.0 |
| 1996 | 114.8 | 522.4 |
| 1997 | 122.0 | 536.2 |
| 1998 | 130.4 | 546.6 |
| 1999 | 141.9 | 577.3 |
| 2000 | 150.6 | 651.8 |
| Year | Urban Average Daily Traffic | Urban Average Daily Load | Rural Average Daily Traffic | Rural Average Daily Load |
|---|---|---|---|---|
| 1997 | 0 | 0 | 0 | 0 |
| 1998 | 2.8 | 8.2 | 3.794 | 6.244 |
| 1999 | 5.5 | 14.7 | 8.963 | 15.784 |
| 2000 | 7.8 | 22.2 | 12.879 | 28.528 |
Source: Truck Weight Study and HPMS
This chart is also availible for download in the following format:
To view PDF files, you need the Acrobat® Reader®.
OHPI Home | Highway Statistics 2000 | Data Feedback