| << Previous | Contents | Next >> |
An Investigation of the Endurance Limit of Hot-Mix Asphalt Concrete Using a New Uniaxial Fatigue Test Protocol
Final Report
Experimental Results
Temperature Control
An important aspect of HMA testing in general is the control of the temperature, since at ambient temperatures a variation of 1°C typically results in a 6 percent variation in the HMA modulus. The control of temperature during HMA testing for determination of endurance limit becomes particularly important since very small variations of modulus are investigated to establish the asymptote. If temperature is not well controlled the variation of modulus caused by temperature variations will mask or overwhelm the effect of fatigue or recovery.
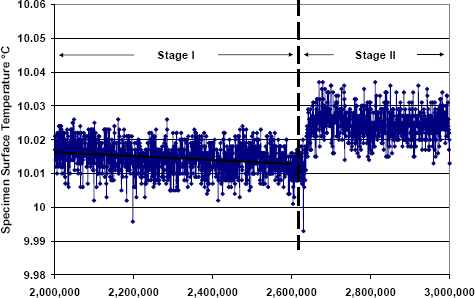
In this study the temperature of the specimen was very well controlled as shown by Figure 8, which shows data obtained from the temperature of air in the test chamber during the testing of specimen M32987. The standard deviation in the temperature is 0.0243°C. With the improvements made during this study to the temperature control and data acquisition system, the amount of self heating at very low strain was directly measured at the specimen surface. One example of such a measurement, accomplished for the first time on HMA for the very small strains used in this study, is shown in Figure 9. In this figure part of the test between cycles 2,000,000 and 3,000,000 containing Stages I and II for Specimen M21673 is presented. Specimen surface temperature data in this figure were obtained from TC 2, located on the surface of the test specimen midway between the contact points for the control transducer, Figure 2. As can be seen in Figure 9, the increase of strain amplitude from 20 to 30 µ-strain generates about 0.01°C self-heating at the specimen surface, approximately a 0.05 percent in modulus. This temperature change has minimal effect on the modulus.
Figure 8. Air temperature in the environmental chamber during M32987 testing.
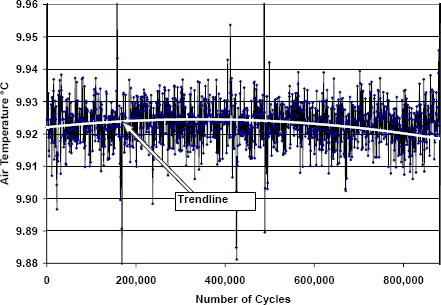
Figure 9. M21673 specimen surface temperature at location TC2.
Fatigue Response
The results presented here were generated from millions of cycles of loading. Unfortunately, due to the impact of several problems (primarily external to the testing itself), continuity in the test conditions could not be fully maintained throughout the period of testing. A list of the various problems that were encountered during the testing is given in Table 3. Specific events occurred at different times to either halt the testing or to change the test conditions. Once such an event occurred, proper action took place to either resume the test or to bring the testing conditions back to normal. Each label is subsequently followed by an explanation of the event and the action taken to resolve the issue.
In each test, the objective was to generate a continuous testing condition for the three stages needed to verify the existence of an endurance limit. As a result, if the impact of an interfering event was considerable, a new three-stage testing sequence was imposed on the specimen after corrective action was taken. The results of this study on the endurance limit can be valid only if continuity in the loading was maintained during the three successive stages of the fatigue protocol. This is because the HMA recovers its modulus immediately after any interruption in the loading. If the loading is interrupted, the testing must be re-started for Stage I, only after giving a few hours of rest time to the specimen. This ensures that the difference between the moduli at the end of Stages I and III is not related to any self-healing as a result of loading interruption.
| Problem | Solution |
|---|---|
| A. Fast Track 8800 GPIB board ceased to function. | Purchased new board. |
| B. Computer motherboard ceased to function. | Purchased new board. |
| C. Hydraulic power shut down because of Master frame interference caused by running two machines simultaneously. | Coordinated with other researchers to prevent testing simultaneously on different machines using the same hydraulic power supply. Adjustments to the software system were needed to allow other tests to be conducted simultaneously with the fatigue test. |
| D. Temperature in walk-in chamber out of control. | Repaired twice and finally a new compressor was purchased and installed. |
| E. Unscheduled loss of electrical power. | Rebooted the system and restarted the loading (return to start of Stage I). |
| F. Loading synchronization disabled. | Partial loss of data. |
| G. Fast Track 8800 would not reset after rebooting. | New clock chipsets were purchased and installed on each of the 4 GPIB boards. |
Because this project was of short duration (four months of actual activity period) and with limited resources it was decided to maximize the results by fully allocating the four months of the project to the laboratory testing. A total of six specimens were tested during the course of this project. Table 4 shows the testing schedule for the tested specimens. The first five weeks of the project were spent on the specimen fabrication, installation and calibration of a new load cell, making new fixtures for the attachment of the new load cell, programming software for data analysis, adaptation of the existent software to the loading of the new fatigue protocol, a new program for temperature data collection, improvements in the insulation of the testing chamber, installation of temperature acquisition devices and thermocouples, running dummy testing and adjustment of new PID settings for the loading control. During this time the data acquisition board of the Fast Track 8800 ceased to function and was replaced by a new one. The experimental part of the research was organized so that during each testing sequence the next specimen would have been prepared and conditioned at the desire temperature. This allowed the testing to be run nearly continuously with almost no lost testing time. While the research was in progress many changes and improvements were made to the control and data acquisition and analysis software, especially to address the problems external to the testing itself, Table 4 presents the tested specimens and the corresponding testing schedule.
| Specimen ID | Start Date | Start Time | Completion Date | Completion Time | Remarks |
|---|---|---|---|---|---|
| M21677 | 10/10/2005 | After installation and before loading, due to hydraulic problems, specimen broke. | |||
| M21676 | 10/11/2005 | 8:02 | 10/25/2005 | 8:12 | Several interfering events delayed testing. |
| I80-60 | 10/26/2005 | 11:01 | 11/15/2005 | 10:47 | |
| M21673 | 11/17/2005 | 18:08 | 12/6/2005 | 16:37 | |
| M32987 | 12/6/2005 12/7/2005 | 17:37 9:26 | 12/6/2005 12/8/2005 | 9:54 | Specimen broke at the top at the beginning of the test. Only load control compression test was applied. |
| M32986 | 12/8/2005 | 16:43 | 12/31/2005 | 16:34 | |
| M12415 | 1/2/2006 | 14:37 | 1/6/2006 | 14:00 | Tested only at 30 microstrain for all cycles. |
As shown in the preceding table, of the seven specimens subject to testing, for only four specimens (i.e. M21676, I-80, M21673, and M32986) could the conditions of the proposed protocol be met. Table 4 also indicates that for some of the specimens testing took considerable time to complete. This was partly because a test has to be restarted when a loading interruption occurs and partly because of some extra testing that was added for further study of material behavior. For example, the start and completion dates for specimen M32986 are 12/8/2005 and 12/31/2005, respectively, indicating a testing period of 23 days. The first two weeks of this period included two attempts to conduct the fatigue protocol. The remaining period dealt with various tests on the specimen to investigate the impact of various factors on the results as discussed later. This period also included frequency sweep testing and final breaking of the specimen.
The loading history and the reduced data for the entire loading sequence for each of the four specimens are presented in Appendix B as a series of graphs. A summary of the results is presented in Table 5. All of the tests were conducted at 10°C and 10 Hz. Each attempt at applying the test protocol represents the application of three successive stages until the completion of Stage III, where a definite asymptote is reached. When for any reason this sequence was not obtained, another test was attempted after allowing the specimen to rest for a few hours. If the operator observed that an asymptote was not reached in Stage II, Stage III could be initiated without additional waiting (rest). Similarly the operator could stop the test if Stage III did not show the possibility that the specimens would fully recover. This was in particular the case of specimen M21673, which failed to reach an asymptote during low strain level, indicating the absence of an endurance limit. However, the loading history of this specimen prior to the application of the protocol loading is suspect with the likelihood that it was damaged before the testing was started. Only three of the test specimens (I-80, M32986, and M21696) were loaded in a manner that could be used to test for the existence of an endurance limit.
Parameters Derived from Protocol Testing
The various parameters reported in Table 5 were used to verify the presence of an endurance limit. Eo (not to be confused with initial modulus) and En are the specimen moduli at cycle No and Nn, respectively. Both are obtained based on a linear regression on the modulus data between cycles No and Nn. Cycles No and Nn are arbitrarily chosen at the end of any given stage in order to estimate the slope of modulus versus number of cycles.
ΔN represents the total number of cycles on which the slope of the regressed line was obtained. It is equal to the difference between En and Eo. Slope, expressed as a percentage, represents the slope of regressed line after being normalized by the value of Eo. Slope is given in terms of the percentage of variation of normalized modulus per million cycles, on the order of 10-8 per cycle. Its sign is negative (positive) for decreasing (increasing) values of modulus versus number of cycles. This is an extremely small rate of change and may for practical purposes be considered as a zero slope.
Period of calculation indicates the stage for which No and Nn were chosen. The number of cycles given under the heading "1st cycle of the test" indicates the total number of cycles that the specimen has sustained in the previous attempts at applying the protocol.
Reaching a line with a slope equal to exactly zero (a horizontal asymptote) is practically impossible when it comes to the variation of modulus versus number of cycles. In this research the criterion chosen to conclude that such a line was reached was the point at which the absolute value of the normalized slope of the regressed line at the end of Stage I and II was less than 0.2 × 10⁻⁸ GPa per cycle. Although this value was chosen arbitrarily, its choice can be justified because it is exceedingly small and would be of no consequence in terms of pavement life. Further, the calculated values for the slope were often negative, indicating that the small values reported for the slope may be the result of experimental error rather than material behavior.
| Specimen | Test Seq. | Eo MPa | En MPa | No | Nn | ℵN (Nn-No) | Slope % / million cycle | Period of calc- ulation | 1st cycle of the attempted test |
|---|---|---|---|---|---|---|---|---|---|
| M32986 | First Attempt | 11,909 | 11,889 | 877,000 | 1,821,310 | 944,310 | -0.175 | End of Stage I | 1 |
| 11,628 | 11,606 | 2,894,000 | 3,170,000 | 276,000 | -0.687 | End of Stage II | |||
| Second Attempt | 11,947 | 11,942 | 3,625,000 | 4,099,919 | 474,919 | -0.082 | End of Stage I | 3,200,000 | |
| 11,539 | 11,526 | 7,465,000 | 8,309,937 | 844,937 | -0.129 | End of Stage II | |||
| 11,773 | 11,778 | 10,124,000 | 10,847,010 | 723,010 | 0.056 | End of Stage III | |||
| M21673 | First Attempt | 14,672 | 14,659 | 399,000 | 2,637,700 | 2,238,700 | -0.038 | End of Stage I | 1 |
| 14,045 | 13,959 | 7,155,000 | 7,952,000 | 797,000 | -0.769 | End of Stage II | |||
| 14,162 | 14,171 | 9,968,000 | 10,484,170 | 516,170 | 0.134 | End of Stage III | |||
| I-80 | First Attempt | 12,008 | 12,007 | 241,000 | 822,000 | 581,000 | -0.014 | End of Stage I | 1 |
| 11,716 | 11,699 | 1,251,000 | 1,363,000 | 112,000 | -1.342 | End of Stage II | |||
| Second Attempt | 11,516 | 11,516 | 2,111,000 | 2,654,000 | 543,000 | -0.007 | End of Stage I | 1,850,000 | |
| 11,212 | 11,203 | 3,628,050 | 3,953,050 | 325,000 | -0.255 | End of Stage II | |||
| Third Attempt | 11,480 | 11,480 | 4,704,000 | 5,171,906 | 467,906 | -0.003 | End of Stage I | 4,490,000 | |
| 11,128 | 11,126 | 7,122,000 | 7,787,000 | 665,000 | -0.028 | End of Stage II | |||
| 11,473 | 11,473 | 13,686,000 | 14,764,000 | 1,078,000 | -0.003 | End of Stage III | |||
| M21676 | First Attempt | 14,593 | 14,584 | 2,845,000 | 3,539,008 | 694,008 | -0.087 | End of Stage I | 1 |
| 14,425 | 14,414 | 4,158,000 | 4,523,000 | 365,000 | -0.200 | End of Stage II | |||
| Second Attempt | 14683 | 14672 | 4789000 | 6113906 | 1324906 | -0.055 | End of Stage I | 4,523,000 | |
| 14452 | 14443 | 8367000 | 10369938 | 2002938 | -0.030 | End of Stage II | |||
| 14544 | 14558 | 10812000 | 11372000 | 560000 | 0.169 | End of Stage III |
Discussion, Comments, and Findings
The primary focus of this work was to verify the existence of an endurance limit for HMAC under uniaxial cyclic compression-tension fatigue testing. Under the conditions of the test procedure used for this research, the primary criterion in deciding whether such a limit exists is the difference between the magnitude of modulus at the end of Stage I and at the end of Stage III. In the case that there is no difference, it can be concluded that the maximum strain applied to the specimen (30 µ-strain for this study) does not exceed the endurance limit and indeed such a limit exists. If there is a difference between the magnitude of modulus from the end of Stage I compared with the end of Stage III, it could be concluded that fatigue damage has occurred and the applied strain exceeds the endurance limit, or that artifacts in the test procedure have caused the loss in modulus. It should be pointed out that the stress levels are very low and the test duration is very long, such that small testing artifacts can potentially lead to significant effects on the results.
The graphs detailing variation of modulus, phase angle, and temperature as functions of loading cycles are presented in Appendix B. In the tests conducted in this research, the slope of the line defining modulus as a function of number of cycles was the criterion used to decide when the strain level should be changed from Stage I to Stage II (i.e., from 20 µ-strain to 30 µ-strain) or from Stage II to Stage III (i.e., from 30 µ-strain to 20 µ-strain). Ideally, this slope should approach zero before the stage is changed. The line used for determining this slope was the regression line for the last several hundred thousand loading cycles of each stage. As shown in Table 5, for those cases in which the testing proceeded to Stage III, for all specimens, the slope was less than 0.2 percent per million cycles of loading (i.e., every million cycles of loading causes a 0.2 percent drop in modulus).
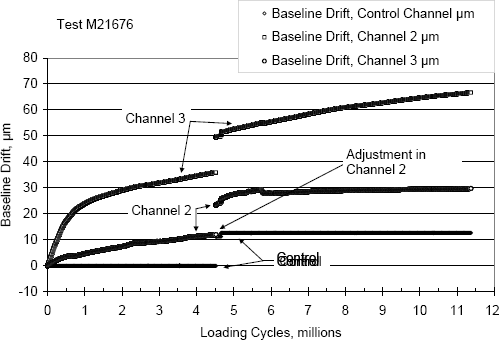
The major question to answer, in case there is a drop of modulus from the end of Stage I to the end of Stage III, is whether an acceptable limit could be adopted for this drop in modulus to allow the confirmation of an endurance limit. Indeed, due to many contributing factors, it would be logical to expect small changes in the modulus without concluding that such a change is the result of fatigue damage. Table 6 provides a summary of results for modulus and the percent drop for each specimen at the end of Stages I and III for the last cycle of loading. It could safely be concluded that specimens I-80 and M21676 have not exhibited any damage. However, the response for specimens M32986 and M21673 is questionable in this regard. M21673 and M21676 are replicate specimens from the same mix, showing very different behaviors in terms of damage. A closer investigation of the results indicates that specimen M21673 has been exposed to expansive drift during the test while specimen M21676 has tolerated a compressive drift (Figures 9 and 10, respectively). This conclusion is evident from the strain values plotted for each of these two specimens.
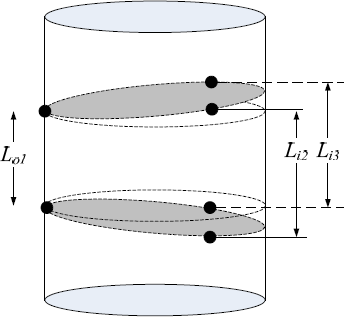
The drift that occurred in the displacement measurements for the two transducers that were not in the control loop is of concern. Little information can be found in the literature regarding this effect, its cause, and its effect on the modulus or fatigue behavior. The researchers concluded that further investigation is required into the cause of this effect and its influence on the interpretation of the test results before continuing with the validation of the proposed fatigue protocol. The test results presented in this report are based on controlled strain conditions; that is, one of the displacement transducers was included in the testing machine control loop. The drift issue can be best explained by reference to Figure 10, where Lo represents the initial gauge length for the control transducer. The baseline gauge length of this transducer remains constant because it is in the control loop. The "drift," as it is referred to in this report, is the change in the baseline gauge length of the two transducers that are not in the control loop. (Note that the oscillatory strain is superimposed on the baseline gauge length. The baseline represents the center of the amplitude of the sinusoidal strain.)
The drift recorded for test specimens M21673 and M21676 is shown in Figures 11 and 12, respectively. The drift in the baseline gauge length for the strain 2 and strain 3 transducers is on the order of tens of microns, whereas the amplitude of the strain is approximately 2 microns. If the gauge length between the transducers were to change uniformly by 75 microns (µm), the axial strain would be 1000 µ-strain (i.e., one tenth of a percent), exceedingly large in comparison to the 20-30 µ-strain which is the peak-to-peak strain amplitude applied as part of the protocol. To gain a further insight as to the relevance of the baseline drift, if the specimen undergoes 1000 µ-strain in the axial direction without any change in lateral dimension, the change in volume would be one tenth of a percent, slightly affecting the modulus. If lateral dimension change is considered, assuming a Poisson's ratio of 0.2, the change in volume would be approximately 0.06 percent, resulting in an even smaller impact on modulus. The change in modulus caused by such a volume change (due to drift) will not be very important for cases when the modulus is used for pavement design purposes. However, for endurance limit fatigue tests, where very slight variations in modulus should be investigated for establishing the endurance limit, such volume changes may become important. Therefore, the cause and effect of the baseline drift needs to be investigated with the objective of identifying its cause and minimizing it to the extent that the test results are not affected. Although it was beyond the scope of this project to research the baseline drift, a number of reasons for this drift can be postulated. These include rotation of the ends of the specimen caused by insufficient rigidity of the system, which would cause the specimen to "bend." Even assuming that the ends of the specimen do not rotate, there is the possibility that the internal displacements within the test specimen are not symmetric with respect to the axis of the specimen, thereby causing it to distort.
A number of sources for rotation and distortion can be postulated; lateral deflection of the actuator and the rotational stiffness of the load cell or other fixture components exacerbated by inhomogeneity of the specimen (i.e., modulus), differences in the tensile and compressive moduli, and eccentricity of the applied load. These and other effects need to be evaluated in a follow-on study before any additional fatigue testing is performed. The behavior of the specimen should also be investigated when measuring the specimen deformation from the top platen to the bottom platen at the same time measurements are conducted within the 75 mm gauge length. This measurement technique will help to investigate how deformation is taking place within the specimen.
Figure 10. Schematic demonstrating drift phenomenon.
| Specimen | En-I, MPa | En-III, MPa | Drop in E, % |
|---|---|---|---|
| M32986 | 11,942 | 11778 | 1.37 |
| M21673 | 14,659 | 14171 | 3.33 |
| I-80 | 11,480 | 11473 | 0.06 |
| M21676 | 14672 | 14558 | 0.78 |
Figure 11. Drift during the test for specimen 21673.
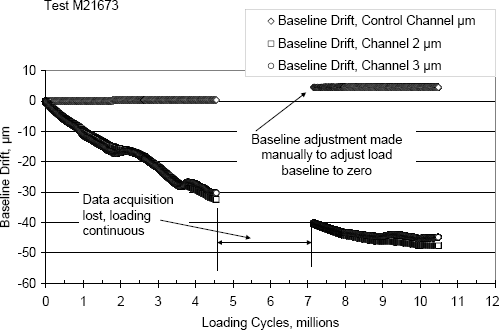
Figure 12. Drift during the test for specimen 21676.
Conclusions
Based on the work conducted during this study and the materials and testing protocols that were used, the following conclusions are drawn:
- Under the testing procedure followed during this research some specimens have shown no fatigue damage after millions of cycles of loading when subjected to strain amplitudes of 30 µ-strain. These results suggest that an endurance limit exists for at least some mixtures and that the endurance limit is at least 30µ-strain at 10°C and under the other testing conditions used for the study.
- One of the test specimens showed significant damage as a result of the testing protocol followed during this study, while the others did not. From this it can be concluded that if all HMAC mixtures possess an endurance limit, testing anomalies caused load-induced damage during the loading of this specimen. Alternatively it can be concluded that either the endurance limit for the specimen in question is less than 30 µ-strain, or not all HMAC mixtures exhibit an endurance limit.
- Anomalies in the test data suggest that the test as performed may be less homogeneous than assumed. Of particular concern is the baseline drift observed in the uncontrolled displacement transducers. From this it can be concluded that additional effort is needed to refine the test procedure and to identify and eliminate as best possible the anomalous behavior.
- The results of this study provide strong evidence for the presence of an endurance limit for HMAC. However, the results are not conclusive because the effect of testing anomalies is not known. Consequently, a review of the testing conditions is needed to identify and correct the source of anomalous behavior.
Recommendations
Based on the results of this study the authors recommend that the research be continued, with two short-term objectives.
- First, before any additional fatigue testing is conducted, the testing configuration need should be reviewed in detail to minimize the anomalous behavior that was observed during this study. Of particular concern is the nonuniformity in the displacement measurements as evidenced by the sometimes large drift in the baseline readings as experienced by the two displacement transducers that were not in the feedback loop. Items that need to be investigated include eccentricity in the applied load, homogeneity of the modulus across the test specimen, the rotational and axial compliance of the testing machine and its fixtures and the protocol used to mount the test specimen among other items that have not yet been identified. Both analytical and laboratory testing will be required to accomplish this task.
- The main objective of a follow-on study should be to continue the effort required to validate the presence of an endurance limit using the specimens that were not tested during this study. This would include replicate test specimens to provide information on the repeatability of the test results. The study should be extended to include the mixtures that were not tested during this study, ideally to include some of the mixtures being evaluated as part of the NCHRP 9-38 Project. The testing must also include provision for replicate measurements at different strain levels.
- Future studies should expand the protocol to larger Stage II strains and to testing conducted in load control and in compression-only and tension-only modes.
- Investigating fatigue behavior and the existence of an endurance limit requires lengthy and extensive testing for each specimen. Unfortunately, because of equipment problems encountered in the course of testing as well as the extended time required for testing each individual specimen, it was not possible to conduct the tests on all of the specimens prepared for this study. It is recommended that the tests be conducted on the remaining prepared specimens so that conclusive evidence could be provided for an endurance limit.
A detailed work plan for a follow-on study is presented in Appendix A. The work plan includes a key detailed review of the test apparatus and the testing of mixtures that were not tested during this study to include replicate measurements.
References
- Monismith, C. L., J. A. Epps, D. A. Kasianchunk, and D. B. McLean, Asphalt Mixture Behavior in Repeated Flexure, Report No. TE 70-5, Institute of Transportation and Traffic Engineering, University of California, Berkeley, 1970.
- Carpenter, S. H., K. A. Ghuzlan, and S. Shen, "A Fatigue Endurance Limit for Highway and Airport Pavements." Paper No. 03-3428, presented at the Annual Meeting of the Transportation Research Board, January 2003.
- Soltani, A., "Comportement en Fatigue des Enrobes Bitumineux," Doctoral Dissertation, Ecole Nationale des Travaux Publics de l'Etat - INSA, Lyon, France, 1998.
- Soltani, A., and D. A. Anderson, Uniaxial Fatigue of Asphalt Mixes: A New Approach, Report No. PTI 2003-13, Pennsylvania Transportation Institute, The Pennsylvania State University, January 2005.
- Chapra, S.C., and R.P. Canale, Numerical Methods for Engineers, McGraw-Hill, New York, 1988, Section 13.1.
- Soltani, A., and D. A. Anderson, "New Test Protocol to Measure Fatigue Damage in Asphalt Mixtures," Journal of Road Materials and Pavement Design, Vol. 4, 2005.
| << Previous | Contents | Next >> |

