

| << Previous | Contents |
An Investigation of the Endurance Limit of Hot-Mix Asphalt Concrete Using a New Uniaxial Fatigue Test Protocol
Final Report
Appendix B: Graphs Presenting Fatigue Test Results
I80-60
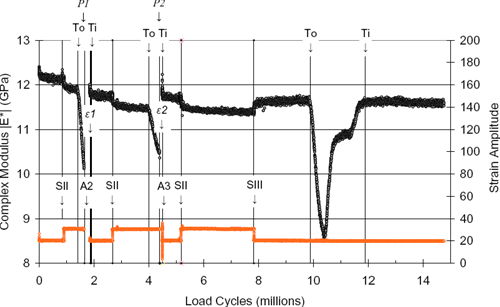
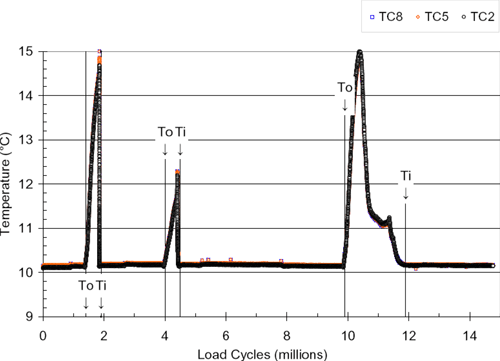
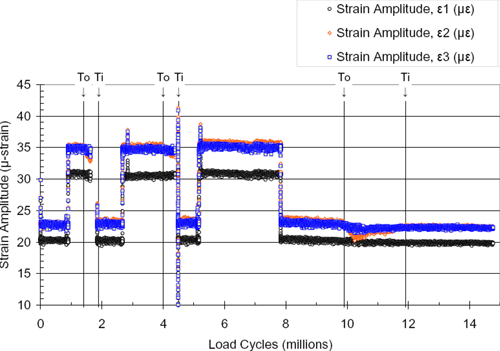
The code given below describes the various events shown in the plots on the pages that follow:
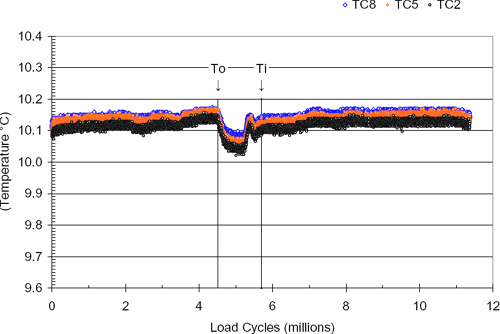
| Temperature: | |||
|---|---|---|---|
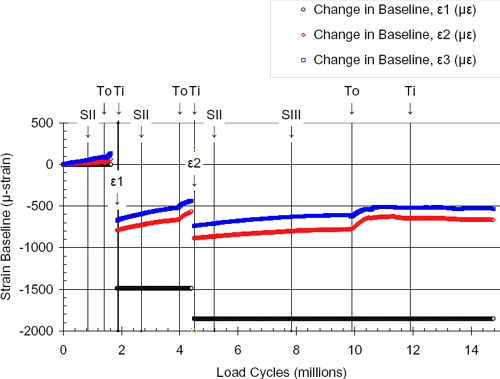
| No. 1 | T0 | @ 1.4 million cycles | Indicates out of control. Data after this point is invalid. |
| No. 2 | Ti | @ 1.9 million cycles | Indicates in control. Data after this point is valid. |
| No. 3 | T0 | @ 4.0 million cycles | Indicates out of control. Data after this point is invalid. |
| No. 4 | Ti | @ 4.5 million cycles | Indicates in control. Data after this point is valid. |
| No. 5 | T0 | @ 9.9 million cycles | Indicates out of control. Data after this point is invalid. |
| No. 6 | Ti | @ 11.9 million cycles | Indicates in control. Data after this point is valid. |
| Attempt to Apply Protocol: | |||
| No. 7 | A2 | @ 1.89 million cycles | Second attempt at running test, Start Stage I. |
| No. 8 | A2 | @ 4.51 million cycles | Third attempt at running test, Start Stage I. |
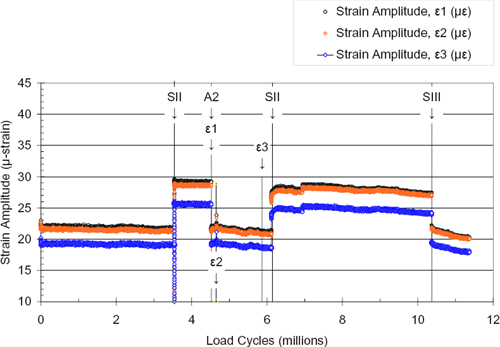
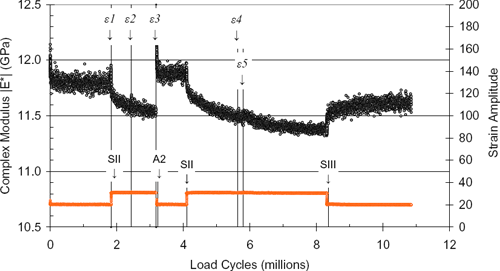
| Start Stage: | |||
| No. 9 | SII | @ 0.85 million cycles | Start of Stage II (First Attempt) |
| No. 10 | SII | @ 2.67 million cycles | Start of Stage II (Second Attempt) |
| No. 11 | SII | @ 5.18 million cycles | Start of Stage II (Third Attempt) |
| No. 12 | SIII | @ 7.83 million cycles | Start of Stage III (Third Attempt) |
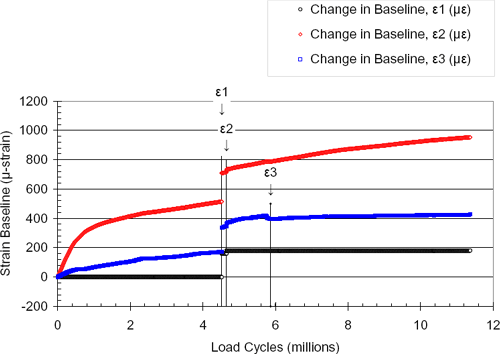
| Strain Baseline Adjusted: | |||
| No. 13 | σ1 | @ 1.86 million cycles | Strain baseline adjusted. |
| No. 14 | σ2 | @ 4.49 million cycles | Strain baseline adjusted. |
| Equipment Issues: | |||
| No. 15 | P1 | @ 1.65 million cycles | Strain baseline adjusted. |
| No. 16 | P2 | @ 4.40 million cycles | Strain baseline adjusted. |
Test I80-60
M21673
The code given below describes the various events shown in the plots on the pages that follow:
| Start Stage: | |||
|---|---|---|---|
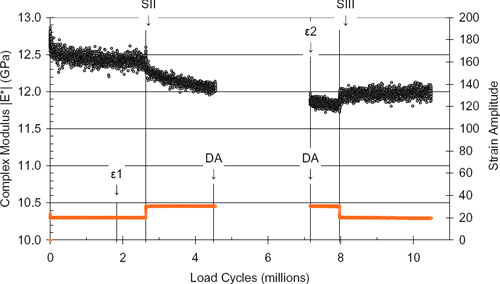
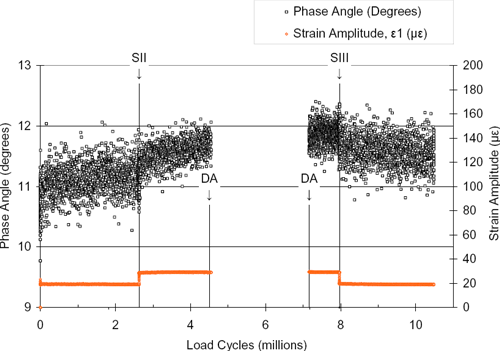
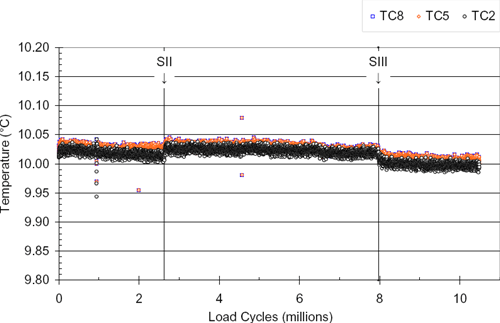
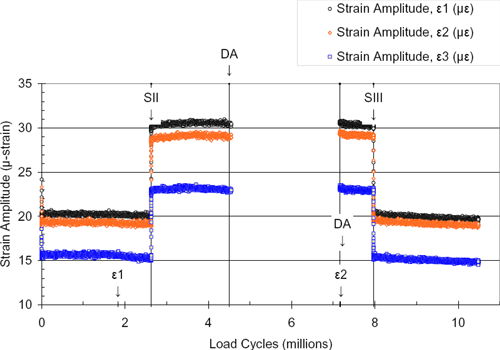
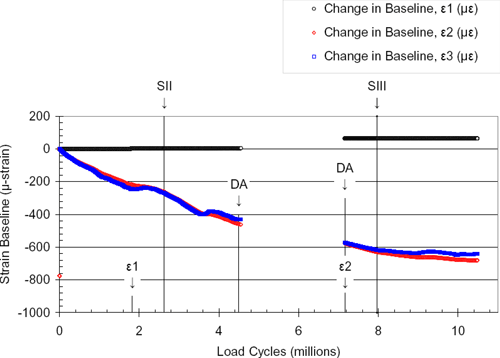
| No. 1 | SII | @ 2.63 million cycles | Stage II started. |
| No. 2 | SIII | @ 7.97 million cycles | Stage III started. |
| Equipment Issues: | |||
| No. 3 | DA1 | @ 4.50 million cycles | Data acquisition lost, test continued. |
| No. 4 | DA2 | @ 7.16 million cycles | Data acquisition regained. |
| Strain Baseline Adjusted: | |||
| No. 5 | σ1 | @ 1.83 million cycles | Strain baseline adjusted. |
| No. 6 | σ2 | @ 7.17 million cycles | Strain baseline adjusted. |
M21676
The code given below describes the various events shown in the plots on the pages that follow:
| Temperature: | |||
|---|---|---|---|
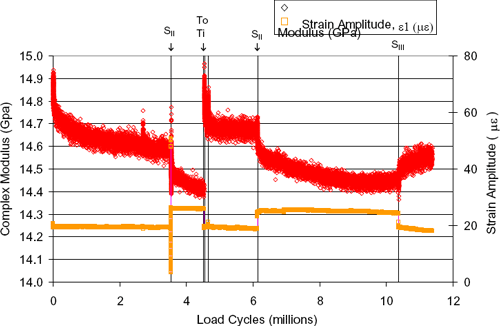
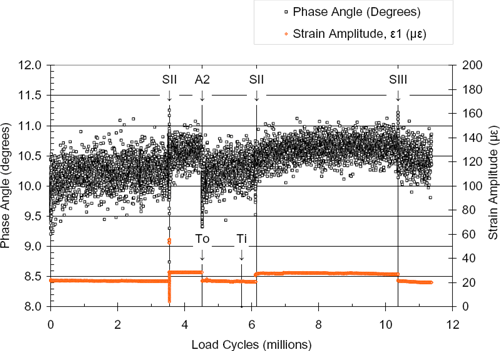
| No. 1 | T0 | @ 4.52 million cycles | Indicates out of control. Data after this point is invalid. |
| No. 2 | Ti | @ 4.52 million cycles | Indicates in control. Data after this point is valid. |
| Attempt to Apply Protocol: | |||
| No. 3 | A2 | @ 4.52 million cycles | Second attempt at running test, Start Stage I. |
| Start Stage: | |||
| No. 4 | SII | @ 3.54 million cycles | Start of Stage II (First Attempt). |
| No. 5 | SII | @ 6.14 million cycles | Start of Stage II (Second Attempt). |
| No. 6 | SIII | @ 10.37 million cycles | Start of Stage III (Second Attempt). |
| Strain Baseline Adjusted: | |||
| No. 7 | σ1 | @ 4.55 million cycles | Strain baseline adjusted. |
| No. 8 | σ2 | @ 4.66 million cycles | Strain baseline adjusted. |
| No. 9 | σ3 | @ 5.87 million cycles | Strain baseline adjusted. |
M32986
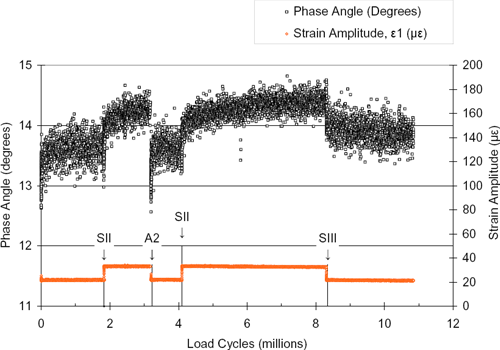
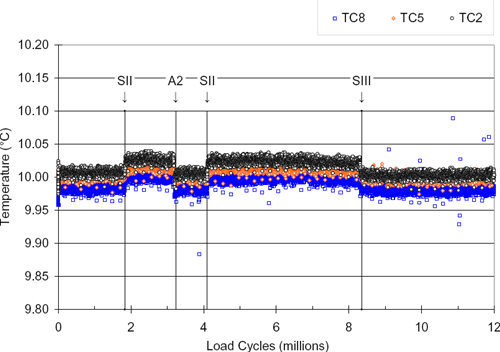
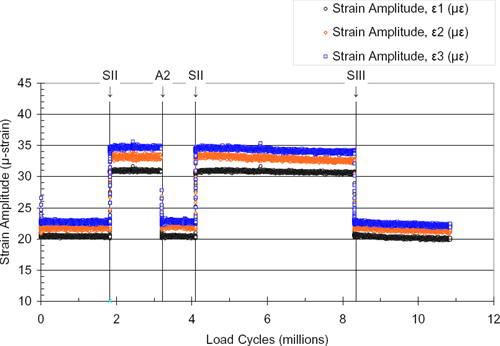
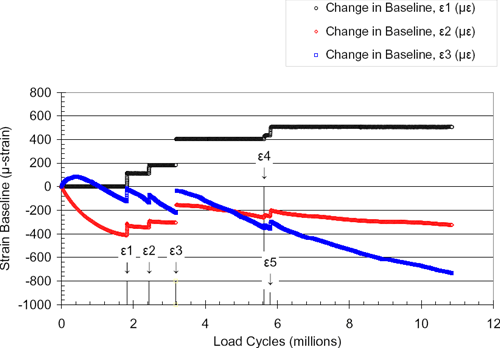
The code given below describes the various events shown in the plots on the pages that follow:
| Attempt to Apply Protocol: | |||
|---|---|---|---|
| No. 1 | A2 | @ 3.23 million cycles | Second attempt to apply protocol. |
| Start Stage: | |||
| No. 2 | SII | @ 1.83 million cycles | Start of Stage II in 1st attempt. |
| No. 3 | SII | @ 4.10 million cycles | Start of Stage II for 2nd attempt. |
| No. 4 | SIII | @ 8.35 million cycles | Start of Stage III for 2nd attempt. |
| Strain Baseline Adjusted: | |||
| No. 5 | σ1 | @ 1.82 million cycles | Strain baseline adjusted. |
| No. 6 | σ2 | @ 2.44 million cycles | Strain baseline adjusted. |
| No. 7 | σ3 | @ 3.18 million cycles | Strain baseline adjusted. |
| No. 8 | σ4 | @ 5.63 million cycles | Strain baseline adjusted. |
| No. 9 | σ5 | @ 5.80 million cycles | Strain baseline adjusted. |
| << Previous | Contents |