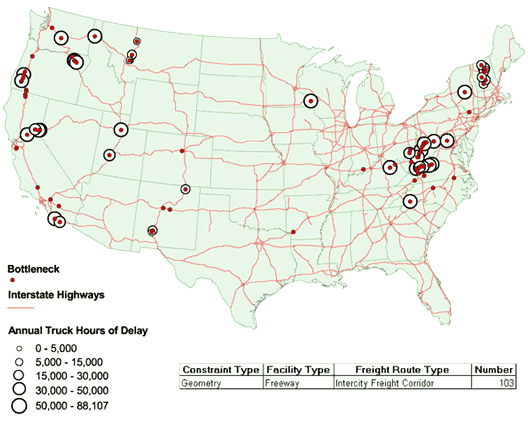
Figure B.1 Steep-Grade Bottlenecks on Freeways Used As Intercity Truck Corridors
HPMS Sample Sections Only

| Route Number | Bottleneck Location | No. of Lanes | All Vehicles-2004 | All Trucks-2004 | |||
|---|---|---|---|---|---|---|---|
| AADT | AADTT | Percent of All Vehicles | Annual Hours of Delay All Trucks | Annual Hours of Delay All Trucks (Expanded) | |||
| 5 | Kern, California | 8 | 66,763 | 22,032 | 33% | 1,119,438 | 1,272,800 |
| 15 | San Bernardino, California | 8 | 122,751 | 22,095 | 18% | 1,049,160 | 1,403,777 |
| 10 | Riverside, California | 4 | 22,279 | 8,689 | 39% | 466,219 | 699,328 |
| IS81 | Montgomery, Virginia | 4 | 44,039 | 14,092 | 32% | 456,645 | 2,141,666 |
| 77 | Mercer, West Virginia | 4 | 31,051 | 6,521 | 21% | 414,253 | 433,723 |
| IS81 | Smyth, Virginia | 4 | 32,174 | 8,365 | 26% | 352,215 | 1,357,789 |
| 5 | Jackson, Oregon | 4 | 16,345 | 6,701 | 41% | 342,763 | 342,763 |
| 5 | Josephine, Oregon | 4 | 20,767 | 7,061 | 34% | 314,310 | 314,310 |
| 5 | Siskiyou, California | 4 | 15,234 | 4,875 | 32% | 267,495 | 299,326 |
| 40 | St. Francis, Arkansas | 4 | 31,716 | 14,589 | 46% | 260,546 | 876,997 |
| 8 | San Diego, California | 4 | 21,009 | 4,202 | 20% | 252,015 | 378,022 |
| 84 | Umatilla, Oregon | 4 | 10,144 | 4,058 | 40% | 247,521 | 247,521 |
| 84 | Malheur, Oregon | 4 | 8,543 | 4,015 | 47% | 242,338 | 242,338 |
| 5 | Josephine, Oregon | 4 | 20,231 | 7,890 | 39% | 238,749 | 238,749 |
| 77 | Raleigh, West Virginia | 4 | 42,029 | 8,826 | 21% | 227,184 | 234,681 |
| 40 | Guilford, North Carolina | 8 | 82,904 | 15,752 | 19% | 221,883 | 777,257 |
| 5 | Douglas, Oregon | 4 | 19,857 | 6,751 | 34% | 214,815 | 214,815 |
| 5 | Marion, Oregon | 4 | 64,150 | 13,472 | 21% | 214,408 | 214,408 |
| 64 | Crawford, Indiana | 4 | 17,430 | 5,229 | 30% | 203,965 | 271,681 |
| 30 | Hempstead, Arkansas | 4 | 23,030 | 10,594 | 46% | 191,543 | 964,992 |
| 5 | Jackson, Oregon | 4 | 15,300 | 6,273 | 41% | 186,236 | 186,236 |
| 64 | Carter, Kentucky | 4 | 15,098 | 4,529 | 30% | 179,446 | 179,446 |
| 95 | Northampton, North Carolina | 4 | 36,071 | 6,853 | 19% | 168,934 | 258,130 |
| 77 | Kanawha, West Virginia | 4 | 32,315 | 6,786 | 21% | 163,371 | 172,683 |
| 40 | Torrance, New Mexico | 4 | 15,448 | 6,179 | 40% | 161,660 | 495,488 |
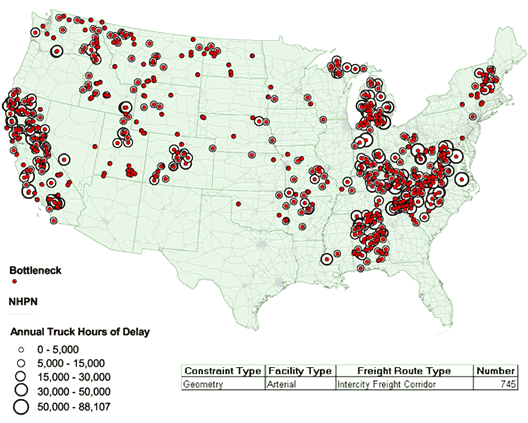
Figure B.2 Steep-Grade Bottlenecks on Arterials Used As Intercity Truck Corridors Used As Urban Truck Corridors
HPMS Sample Sections Only

| Route Number | Bottleneck Location | No. of Lanes | All Vehicles-2004 | All Trucks-2004 | |||
|---|---|---|---|---|---|---|---|
| AADT | AADTT | Percent of All Vehicles | Annual Hours of Delay All Trucks | Annual Hours of Delay All Trucks (Expanded) | |||
| 58 | Kern, California | 4 | 20,813 | 6,868 | 33% | 334,820 | 758,033 |
| 131 | Kent, Mississippi | 4 | 42,604 | 5,112 | 12% | 191,106 | 445,851 |
| 18 | San Bernardino, California | 2 | 10,757 | 1,936 | 18% | 169,939 | 855,813 |
| 58 | Kern, California | 4 | 21,961 | 7,247 | 33% | 146,081 | 330,726 |
| 101 | Santa Barbara, California | 4 | 30,027 | 3,904 | 13% | 134,025 | 303,433 |
| 17 | Santa Clara, California | 4 | 63,616 | 2,545 | 4% | 128,589 | 143,891 |
| 17 | Santa Cruz, California | 4 | 63,654 | 3,183 | 5% | 114,915 | 128,589 |
| U.S. 220 | Franklin, Virginia | 4 | 15,365 | 2,458 | 16% | 104,076 | 726,033 |
| 299 | Shasta, California | 2 | 4,084 | 1,266 | 31% | 85,000 | 194,650 |
| 223 | Lenawee, Mississippi | 2 | 10,227 | 1,841 | 18% | 84,656 | 364,866 |
| 23 | Madison, North Carolina | 2 | 8,419 | 1,179 | 14% | 81,267 | 149,693 |
| 15 | Perry, Kentucky | 2 | 11,029 | 1,654 | 15% | 79,887 | 158,976 |
| 31 | Miami, Indiana | 4 | 21,874 | 3,937 | 18% | 74,565 | 195,285 |
| 74 | Cleveland, North Carolina | 4 | 26,261 | 3,677 | 14% | 68,099 | 226,632 |
| 31 | Berrien, Mississippi | 2 | 20,001 | 1,600 | 8% | 61,697 | 404,609 |
| 80 | Floyd, Kentucky | 4 | 14,454 | 1,734 | 12% | 58,703 | 116,819 |
| U.S. 220 | Henry, Virginia | 4 | 17,823 | 3,030 | 17% | 57,441 | 422,710 |
| 19 | Haywood, North Carolina | 2 | 10,100 | 1,010 | 10% | 55,453 | 546,157 |
| U.S. 30 | Bannock, Idaho | 4 | 5,102 | 1,429 | 28% | 53,570 | 104,782 |
| 50 | El Dorado, California | 4 | 26,577 | 1,860 | 7% | 53,480 | 121,080 |
| 154 | Santa Barbara, California | 2 | 14,140 | 1,131 | 8% | 52,873 | 266,266 |
| 23 | Macon, North Carolina | 4 | 23,231 | 3,252 | 14% | 52,222 | 173,794 |
| 25E | Bell, Kentucky | 4 | 20,446 | 2,045 | 10% | 50,443 | 88,276 |
| 89 | Siskiyou, California | 2 | 2,254 | 766 | 34% | 49,531 | 113,425 |
| U.S. 58 | Halifax, Virginia | 4 | 9,069 | 1,723 | 19% | 49,200 | 162,853 |
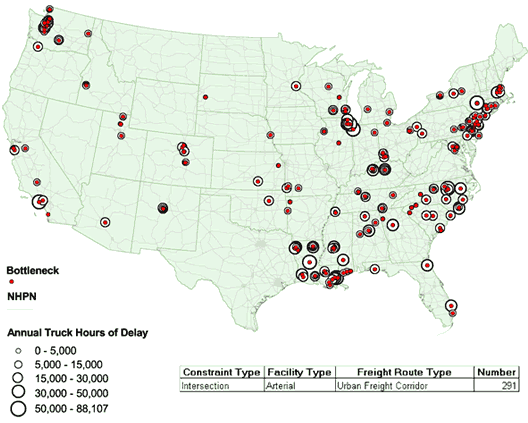
Figure B.3 Steep-Grade Bottlenecks on Arterials Used As Urban Truck Corridors
HPMS Sample Sections Only

| Route Number | Bottleneck Location | No. of Lanes | All Vehicles-2004 | All Trucks-2004 | |||
|---|---|---|---|---|---|---|---|
| AADT | AADTT | Percent of All Vehicles | Annual Hours of Delay All Trucks | Annual Hours of Delay All Trucks (Expanded) | |||
| 280 | Shelby, Alabama | 4 | 51,411 | 5,141 | 10% | 177,156 | 415,961 |
| 1 | Aiken, South Carolina | 4 | 20,889 | 2,298 | 11% | 72,395 | 95,199 |
| 14 | Los Angeles, California | 4 | 20,115 | 1,006 | 5% | 27,184 | 476,319 |
| 74 | Riverside, California | 4 | 20,269 | 1,419 | 7% | 23,025 | 28,666 |
| 100 | St. Louis, Missouri | 4 | 25,265 | 1,516 | 6% | 16,609 | 233,485 |
| CR 948 | 12086 | 6 | 19,371 | 969 | 5% | 16,567 | 34,178 |
| 21 | Jefferson, Missouri | 4 | 17,830 | 1,070 | 6% | 14,992 | 153,311 |
| 78 | Jackson, Missouri | 4 | 24,869 | 1,492 | 6% | 13,227 | 44,945 |
| 60 | Boyd, Kentucky | 4 | 25,559 | 1,022 | 4% | 8,608 | 9,443 |
| SR 43 | Jefferson, Ohio | 4 | 20,322 | 813 | 4% | 7,317 | 7,485 |
| 431 | Madison, Alabama | 4 | 20,687 | 414 | 2% | 5,064 | 10,006 |
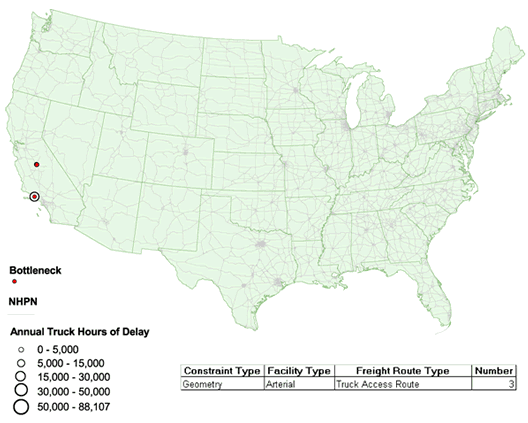
Figure B.4 Steep-Grade Bottlenecks on Arterials Used As Truck Access Routes
HPMS Sample Sections Only

| Route Number | Bottleneck Location | No. of Lanes | All Vehicles-2004 | All Trucks-2004 | |||
|---|---|---|---|---|---|---|---|
| AADT | AADTT | Percent of All Vehicles | Annual Hours of Delay All Trucks | Annual Hours of Delay All Trucks (Expanded) | |||
| - | Fresno, California | 4 | 35,858 | 3,227 | 9% | 42,064 | 276,610 |
| - | Ventura, California | 4 | 36,728 | 1,102 | 3% | 13,043 | 13,043 |
| - | Fresno, California | 4 | 15,118 | 454 | 3% | 5,517 | 13,257 |