Figure C.1 Signalized Intersection Bottlenecks on Arterials Used As Intercity Truck Corridors
HPMS Sample Sections Only
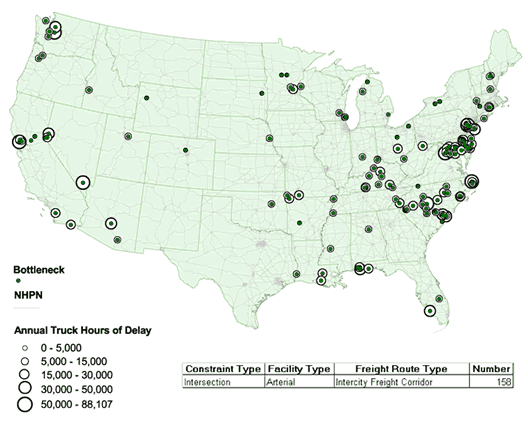
| Route Number | Bottleneck Location | No. of Lanes | All Vehicles-2004 | All Trucks-2004 | |||
|---|---|---|---|---|---|---|---|
| AADT | AADTT | Percent of All Vehicles | Annual Hours of Delay All Trucks | Annual Hours of Delay All Trucks (Expanded) | |||
| 158 | Dare, North Carolina | 4 | 41,299 | 4,130 | 10% | 118,559 | 426,458 |
| 501 | Horry, South Carolina | 4 | 49,465 | 5,936 | 12% | 97,115 | 176,555 |
| U.S. 202 | Hunterdon, New Jersey | 4 | 38,825 | 2,330 | 6% | 87,978 | 499,893 |
| 17 | Horry, South Carolina | 6 | 65,620 | 7,874 | 12% | 66,950 | 74,046 |
| Del1 | Sussex, Delaware | 5 | 58,915 | 7,070 | 12% | 65,427 | 110,965 |
| 169 | King, Washington | 2 | 27,134 | 2,713 | 10% | 55,367 | 72,253 |
| 9 | Snohomish, Washington | 2 | 21,338 | 2,561 | 12% | 52,243 | 68,177 |
| 50 | Dearborn, Indiana | 4 | 37,396 | 6,731 | 18% | 49,035 | 148,820 |
| 37 | Sonoma, California | 4 | 45,817 | 4,124 | 9% | 47,584 | 95,835 |
| 74 | Union, North Carolina | 4 | 56,465 | 4,517 | 8% | 46,806 | 60,146 |
| 430 | Washoe, Nevada | 4 | 40,401 | 6,868 | 17% | 45,085 | 85,301 |
| U.S. 41 | Lee, Florida | 4 | 48,271 | 2,896 | 6% | 43,316 | 329,635 |
| NJ 31 | Hunterdon, New Jersey | 2 | 21,693 | 1,519 | 7% | 40,711 | 256,562 |
| 70 | Pima, Arizona | 4 | 30,166 | 6,033 | 20% | 39,307 | 93,945 |
| 301 | Prince Georges, Maryland | 4 | 69,883 | 6,988 | 10% | 39,049 | 81,379 |
| 1 | Moore, North Carolina | 4 | 35,226 | 4,932 | 14% | 37,243 | 171,617 |
| U.S. 29 | Fauquier, Virginia | 4 | 45,853 | 3,210 | 7% | 37,141 | 233,802 |
| 59 | Baldwin, Alabama | 4 | 25,865 | 2,069 | 8% | 36,605 | 94,697 |
| NJ 31 | Hunterdon, New Jersey | 4 | 25,808 | 2,065 | 8% | 36,407 | 229,435 |
| 231 | Warren, Kentucky | 4 | 39,035 | 1,952 | 5% | 35,195 | 62,894 |
| 50 | Dearborn, Indiana | 4 | 32,254 | 5,806 | 18% | 35,144 | 106,662 |
| U.S. 9 | Sussex, Delaware | 5 | 44,363 | 5,324 | 12% | 34,670 | 62,475 |
| U.S. 29 | Prince William, Virginia | 4 | 53,955 | 3,777 | 7% | 34,181 | 35,891 |
| 158 | Dare, North Carolina | 4 | 41,299 | 4,130 | 10% | 34,143 | 122,812 |
| 65 | Taney, Missouri | 2 | 15,857 | 2,537 | 16% | 33,290 | 208,359 |
Figure C.2 Signalized Intersection Bottlenecks on Arterials Used As Intermodal Connectors
HPMS Sample Sections Only
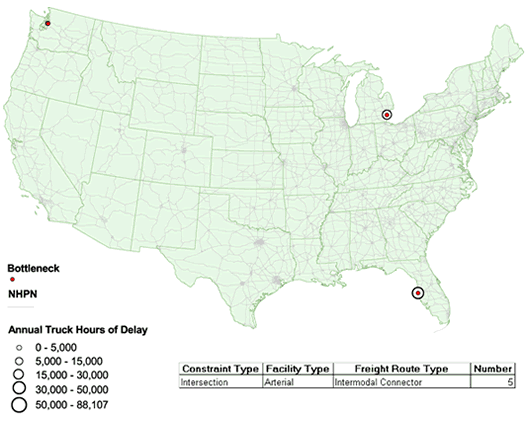
| Route Number | Bottleneck Location | No. of Lanes | All Vehicles-2004 | All Trucks-2004 | |||
|---|---|---|---|---|---|---|---|
| AADT | AADTT | Percent of All Vehicles | Annual Hours of Delay All Trucks | Annual Hours of Delay All Trucks (Expanded) | |||
| 165 | Ouachita, Louisiana | 4 | 66,448 | 11,296 | 17% | 335,812 | 335,812 |
| 110 | Suffolk, New York | 4 | 74,289 | 5,200 | 7% | 193,803 | 383,537 |
| 1 | Caddo, Louisiana | 4 | 29,553 | 9,161 | 31% | 165,532 | 271,637 |
| 90 | Orleans, Louisiana | 6 | 43,720 | 4,809 | 11% | 161,489 | 694,566 |
| 165 | Ouachita, Louisiana | 4 | 37,625 | 9,406 | 25% | 126,208 | 182,623 |
| 90 | Orleans, Louisiana | 6 | 45,929 | 4,593 | 10% | 125,005 | 293,011 |
| 29 | Greenville, South Carolina | 6 | 35,177 | 3,869 | 11% | 112,798 | 465,970 |
| 17 | Horry, South Carolina | 6 | 45,993 | 5,059 | 11% | 104,662 | 150,400 |
| 90 | Lafayette, Louisiana | 4 | 47,763 | 10,985 | 23% | 95,410 | 109,721 |
| S12 | San Diego, California | 6 | 53,495 | 4,280 | 8% | 94,645 | 383,406 |
| U.S. 59 | Webb, Texas | 4 | 28,369 | 6,241 | 22% | 83,354 | 150,704 |
| 47 | St. Bernard, Louisiana | 4 | 30,820 | 5,856 | 19% | 75,717 | 182,024 |
| 264 | Pitt, North Carolina | 4 | 33,539 | 2,683 | 8% | 70,925 | 96,529 |
| 50 | 11002 | 6 | 72,048 | 15,851 | 22% | 65,705 | 84,431 |
| 71 | Rapides, Louisiana | 4 | 34,826 | 3,831 | 11% | 64,550 | 84,754 |
| 25 | Rankin, Mississippi | 4 | 57,474 | 8,621 | 15% | 63,682 | 63,682 |
| U.S. 1 | Mercer, New Jersey | 6 | 75,347 | 8,288 | 11% | 60,983 | 65,374 |
| 41 | Lake, Illinois | 4 | 71,043 | 8,525 | 12% | 59,737 | 2,011,173 |
| 200 | Wake, North Carolina | 4 | 37,026 | 2,962 | 8% | 58,371 | 189,530 |
| Hinds, Mississippi | 4 | 39,584 | 5,938 | 15% | 57,649 | 112,127 | |
| U.S. 30 | Camden, New Jersey | 4 | 33,054 | 3,636 | 11% | 55,555 | 535,382 |
| 90 | Orleans, Louisiana | 4 | 31,061 | 3,106 | 10% | 54,618 | 131,303 |
| SH 289 | Collin, Texas | 6 | 53,359 | 3,202 | 6% | 53,141 | 172,442 |
| 90 | Dutchess, New York | 6 | 52,111 | 2,606 | 5% | 51,653 | 60,950 |
| NJ 73 | Burlington, New Jersey | 4 | 64,355 | 7,079 | 11% | 49,604 | 458,590 |
Figure C.3 Signalized Intersection Bottlenecks on Arterials Used As Urban Truck Corridors
HPMS Sample Sections Only
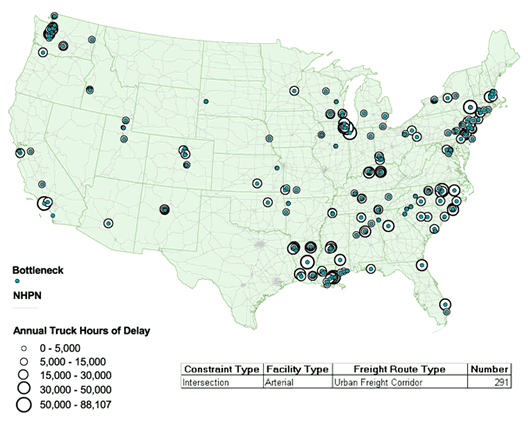
| Route Number | Bottleneck Location | No. of Lanes | All Vehicles-2004 | All Trucks-2004 | |||
|---|---|---|---|---|---|---|---|
| AADT | AADTT | Percent of All Vehicles | Annual Hours of Delay All Trucks | Annual Hours of Delay All Trucks (Expanded) | |||
| Collier, Florida | 6 | 54,106 | 2,164 | 4% | 41,106 | 98,162 | |
| SR 686 | Pinellas, Florida | 6 | 90,397 | 6,328 | 7% | 38,914 | 43,661 |
| SR 686 | Pinellas, Florida | 4 | 90,397 | 6,328 | 7% | 30,598 | 34,330 |
| - | Wayne, Mississippi | 4 | 43,595 | 2,616 | 6% | 17,826 | 254,471 |
| - | King, Washington | 4 | 55,416 | 3,325 | 6% | 9,927 | 37,227 |
Figure C.4 Signalized Intersection Bottlenecks on Arterials Used As Truck Access Routes
HPMS Sample Sections Only
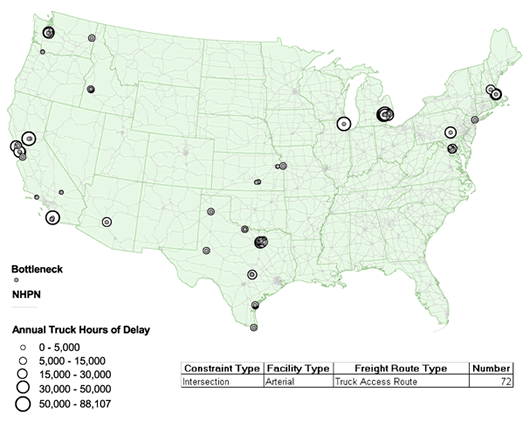
| Route Number | Bottleneck Location | No. of Lanes | All Vehicles-2004 | All Trucks-2004 | |||
|---|---|---|---|---|---|---|---|
| AADT | AADTT | Percent of All Vehicles | Annual Hours of Delay All Trucks | Annual Hours of Delay All Trucks (Expanded) | |||
| - | Sacramento, California | 6 | 86,185 | 18,099 | 21% | 320,265 | 320,265 |
| - | San Diego, California | 6 | 100,194 | 8,016 | 8% | 215,711 | 215,711 |
| - | San Diego, California | 4 | 55,814 | 8,372 | 15% | 161,312 | 180,669 |
| - | Oakland, Mississippi | 6 | 56,513 | 17,519 | 31% | 106,834 | 392,937 |
| - | King, Washington | 4 | 45,571 | 3,646 | 8% | 93,466 | 294,979 |
| - | Oakland, Mississippi | 4 | 38,825 | 1,941 | 5% | 59,550 | 850,070 |
| - | San Bernardino, California | 4 | 37,942 | 5,691 | 15% | 58,749 | 92,177 |
| - | Santa Clara, California | 6 | 80,790 | 7,271 | 9% | 53,662 | 53,662 |
| - | Oakland, Mississippi | 4 | 58,601 | 2,930 | 5% | 53,592 | 197,111 |
| - | Santa Clara, California | 6 | 84,103 | 2,523 | 3% | 46,754 | 46,754 |
| - | Oakland, Mississippi | 4 | 74,876 | 3,744 | 5% | 40,058 | 121,455 |
| - | Dallas, Texas | 6 | 54,617 | 1,639 | 3% | 37,581 | 121,952 |
| - | Sacramento, California | 4 | 53,508 | 4,816 | 9% | 35,150 | 56,345 |
| - | Santa Clara, California | 6 | 55,526 | 3,887 | 7% | 34,893 | 148,332 |
| - | Oakland, Mississippi | 4 | 74,876 | 8,236 | 11% | 34,572 | 104,821 |
| - | Spokane, Washington | 4 | 25,549 | 2,555 | 10% | 30,681 | 100,603 |
| - | San Diego, California | 4 | 34,064 | 1,703 | 5% | 30,138 | 306,077 |
| - | Pierce, Washington | 4 | 45,074 | 3,155 | 7% | 28,163 | 88,884 |
| - | 11002 | 7 | 77,772 | 3,111 | 4% | 26,818 | 34,461 |
| - | Dallas, Texas | 6 | 64,524 | 1,936 | 3% | 24,597 | 228,211 |
| - | Cook, Illinois | 8 | 93,702 | 3,748 | 4% | 19,831 | 172,172 |
| - | Hillsborough, New Hampshire | 4 | 29,705 | 2,079 | 7% | 19,261 | 36,981 |
| - | Dallas, Texas | 6 | 40,492 | 1,215 | 3% | 18,998 | 88,854 |
| - | Dallas, Texas | 6 | 49,322 | 1,480 | 3% | 17,280 | 56,075 |
| - | Maricopa, Arizona | 4 | 28,139 | 3,658 | 13% | 16,650 | 155,811 |