Impacts of Higher Fuel Costs
Dan Brand, CRA International
Introduction and Objective
This is a brief paper on the impacts of higher fuel costs on the demand for surface passenger transportation in the United States. It outlines what generally is known about how surface transportation will change or be changed by sustained higher fuel costs based on a scan of recent literature and national data.
Some Recent Events and Data
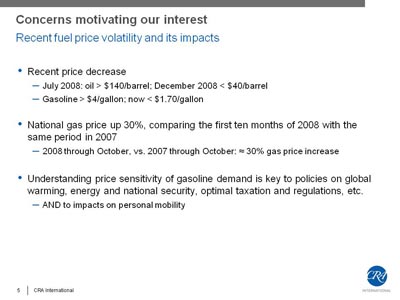
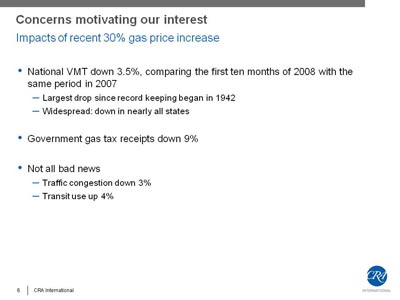
The most recent concern motivating an examination of the impacts of higher fuel prices is their recent extreme volatility. The per-barrel price of oil on world markets has decreased from about $140 to around $40, just in the last six months! The average price at the pump for unleaded regular gasoline was $4.09 a gallon in July, and was below $1.70 in December 2008! A year earlier, in July 2007, the average price per gallon was $2.96, for an increase of 38% from July 07 to July 081. For the months of August, September, and October, from 07 to 08, the percent price increases were 36%, 32%, and 12%. These price increases resulted in the largest monthly, year-over-year declines in U.S. vehicle miles traveled (VMT) since record keeping began in 1942. The VMT declines in 2008 over 2007 have been 3.6% in July, 5.6% in August, 4.4% in September, and 3.5% in October. For the year 2008 through October, the latest month for which FHWA Traffic Volume Trends data are available, the decline has been 3.5% or about 90 billion vehicle miles2. These declines are widely distributed across the country; 48 states experienced VMT declines in September 2008 as compared to September 2007. Whether these declines continued as gas prices declined so rapidly in November and December is a very interesting question. Presumably, the current economic slowdown and rising unemployment will offset part of the effect of declining gas prices.
A positive result of these VMT declines is a small decline in traffic congestion in the United States. The average gas price increase of 28% in the first half of 2008 over 2007 “influenced a 3% reduction in the Travel Time Index (the ratio of peak period travel time to free flow travel time) for the nation as a whole, slightly below 2006 levels. Ninety six of the nation's top 100 markets (by population) had drops in traffic congestion in the first half of 2008 compared to 2007.”3
Another important result of these VMT declines is that fuel consumption also is down. Energy Information Administration (EIA) data for all of 2008 show that motor gasoline consumption declined by 3.3%, compared to 20074. For the last two months of 2008, VMT declines have been slightly less than in previous months in 2008, and still less due to fuel price increases and more due to the economic decline that accelerated in the last two months of 20085. Thus, we may postulate that gasoline consumption for the year 2008 through October is down about 4% due to gas price increases. This drop in gas consumption shows that not only are Americans driving less, but they also are switching to transit, buying more fuel efficient cars, and in multicar households, shifting to their more fuel efficient cars.
Annual transit ridership has increased by about 420 million passengers in the last year, or about 4% to 10.6 billion passengers6. The increase is widespread, with 86% of transit agencies reporting ridership increases. However, comparing this increase of 420 million passenger trips to the decline of 90 billion VMT on our streets and highways means that only a small fraction of highway travel has diverted to transit (5% or less). In the major cities where transit is more available, highway traffic was down more than the national VMT declines. For example, in New York City, traffic on the Lincoln and Holland Tunnels fell 6.3% in September compared with 2007, and more than 7% in October on the four MTA controlled bridges and tunnels.
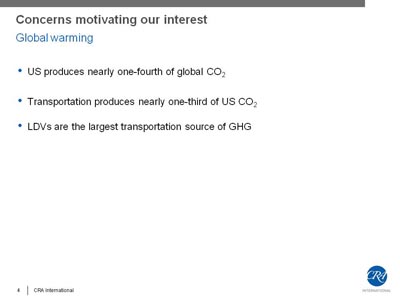
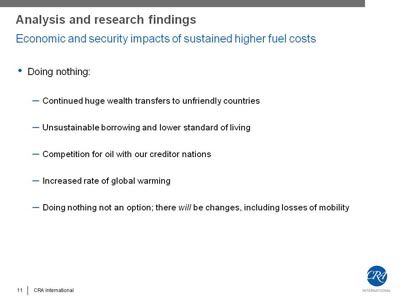
The impacts of recent oil and gasoline price swings notwithstanding, the huge impacts of transportation on U.S. energy independence and global warming are continuing primary concerns affecting national transportation policy. Transportation consumes more than 70% of all oil used in North America, and there is evidence “that oil consumption is set to become increasingly concentrated in the transportation sector.”7 Ninety nine percent of all energy consumed in transportation (all modes) currently is oil based, and 58% of that energy is used by light duty vehicles (LDVs). This means that more than 40% of all oil used in the United States is used by LDVs on highways. Because we import about 60% of our oil, this means we are using the equivalent of all our domestically produced oil for highway passenger transportation! Importing the remaining 60% of our domestic consumption, much of it from quite unfriendly countries, has annual costs for the United States in the hundreds of billions of dollars in transfers of wealth, price shocks, military costs in blood and treasure, and other costs such as for the Strategic Petroleum Reserve. The current economic situation has shown that adding these costs annually to our national debt may be unsustainable.
Finally, global warming is a huge and still emerging concern, both for its consequences and the costs of measures to mitigate it. As long as carbon-based fuels are used to provide the basic energy used in transportation, whether oil based or for electric power generation, greenhouse gas production will continue to increase with increased energy consumption in transportation. Currently, the United States emits a little less than a quarter of global carbon dioxide emissions, and transportation is the single largest source of these emissions, emitting 32% of the U.S. total8.
Short- and Long-Run Travel Behavior Changes: Some Analysis
Developing policies to respond to the impacts of higher fuel prices in the most effective and equitable manner requires a better understanding of the causes and components of the VMT and fuel consumption behaviors described above. As one published paper puts it: “Understanding the sensitivity of gasoline demand to changes in prices and income has important implications for policies related to climate change, optimal taxation and national security, to name only a few.”9 I begin by computing the price elasticities implied by the recent VMT and gasoline consumption changes described above, compare them with values in the recent literature, and then use both to better understand whose travel and fuel consumption is being affected.
Travel and Gasoline Price Elasticities from the Above Data
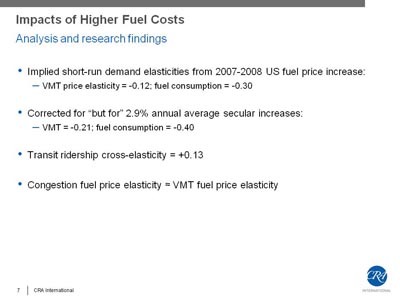
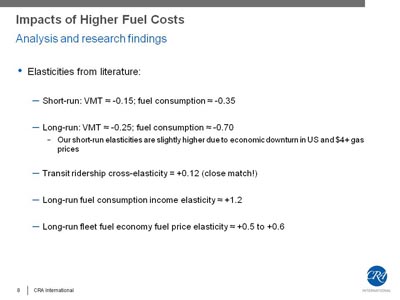
The short-run VMT price elasticities computed from the above changes from 2007 to 2008 are -0.17 for the four-month period July to October, and about -0.12 (=3.5% VMT decline/30% price increase) for 2008 through October. The short-run gasoline price elasticity for the year through October is only slightly larger at -0.13 (=4% gas decline/30% price increase).
However, these price elasticities do not account for the “but for” effect of the long-term secular trends of VMT and gas consumption in the United States. FHWA data for the increase in VMT in the United States between 1983 and 2004 when nominal gas prices fluctuated between about 80 cents and $1.70 a gallon for unleaded regular gas indicate a fairly steady average annual VMT increase of about 2.9%. EIA Petroleum Supply Monthly data over the same period show the annual average gasoline consumption growth to be 1.2%. If we assume the “but for” cases to be a 2.9% VMT increase and a 1.2% fuel consumption increase between 2007 and 2008, the VMT and fuel consumption price elasticities increase to levels more consistent with values quoted in the literature. The short-run VMT fuel price elasticity adjusted for the secular trends for the four months of July through October 2008 versus 2007 is about -0.30, and for the first ten months of 2008 versus 2007 it is -0.21. The 10-month fuel consumption price elasticity increases to about -0.17.
Travel and Gasoline Consumption Price Elasticities from the Literature
The range of VMT fuel price elasticities reported in the literature is certainly wide: “The short-term elasticity of traffic with respect to price is about -0.15; the long-term is about -0.30.”10 “The (long run) elasticity of household VMT with respect to gasoline prices ranges from -0.19 to -0.32.”11 The short-run VMT price elasticity estimates in the literature are a little lower than those computed with the recent data above. However, there also is evidence that the elasticity increases as the before and after prices move higher: “$4 per gallon appears to be a significant breakpoint for many respondents, both in terms of curbing single occupancy vehicle (SOV) commuting and making hybrid engine vehicle (HEV) ownership a popular investment.”12 Also, we need to understand that our elasticities computed above may be somewhat high because the early effect of the current economic downturn is included in the data.
There appears to be a larger literature on fuel consumption price elasticities than on VMT fuel price elasticities. Our computed short-run gas price elasticity of about -0.17 is less than the range reported in the literature: “When we use….1-year lags as other studies have used, we obtain elasticity estimates in the range of -0.35.”13 “Typically, short-term (fuel consumption) price elasticities are in the region of -.3 and long-term elasticities are between -0.6 and -0.8.”10 A possible reason for our low fuel consumption price elasticities is the contradictory evidence on changes in fuel consumption between 2008 and 2007. U.S. Treasury data on gas tax receipts for the two years show a negligible decline, while EIA data show the modest decline referred to above. The VMT declines from their secular trends suggest the possibility that the gasoline consumption decline is larger than that reported by either agency.
Finally, an interesting note here is that the aggregate cross elasticity of transit ridership with respect to gas price that we can compute from the above data is right on the mark with at least one reported result in the literature. Our gas price cross elasticity is +0.13 (= 4% ridership increase/30% price increase over the first ten months of 2008 versus 2007). “Research in 2007 established that for every 10% increase in gas prices, U.S. transit demand has increased by 1.2%, a cross elasticity of demand to gas prices (e) of +0.12”14.
The Components of the Behavioral Changes
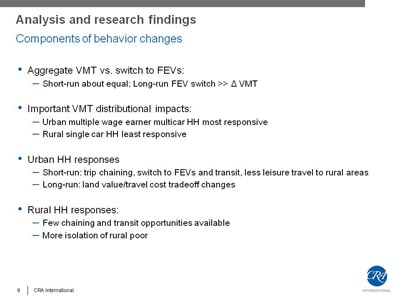
The impacts of gas price changes on specific behaviors of the population as a whole, as well as on sub groups of the population, are key to developing transportation policies that mitigate negative impacts and increase benefits. Without accounting for the long-term secular (“but for”) trends, our aggregate data above suggests that in the short term, the reduction in VMT contributes much more to the reduction in gas consumption than switching to vehicles with higher gas mileage. The reduction in VMT has been 3.5% for 2008 through October, while the gas consumed has declined by about 4%. While the two behavior changes are very similar in size, this agrees with a finding in the literature that “households respond to price changes by adjusting VMT more than composite miles per gallon in the year after a price change.”13 However, in the long run, there is general agreement in the literature that “about two thirds of this (fuel consumption decline) results from the purchase of more fuel efficient vehicles and only about a third results from reduced travel.”15 “So motorists do find ways of economizing on their use of fuel, given time to adjust. Raising fuel prices will therefore be more effective in reducing the quantity of fuel used than in reducing the volume of traffic.”10
However, the consequences of reducing traffic volumes on congestion may still be large. We know from traffic engineering that small changes in traffic volumes on congested highways make a big difference in travel speeds. An indication of this is given above in the data section in which the average gas price increase of 28% over the first half of 2008 over 2007 resulting in about a 3% reduction in VMT over 2007 “influenced a 3% reduction in the Travel Time Index for the nation as a whole.”16 This one-to-one correspondence of VMT reduction to travel time reduction is an important finding.
The impact of higher fuel costs on the automotive industry is another important concern in the current economy, particularly for the domestic car manufacturing industry. There is again, a wide range of fleet fuel economy fuel price elasticities, but with a strong central tendency in the 0.5 to 0.6 range17. This is consistent with the long-run fuel consumption price elasticity range of -0.6 to -0.8 reported above, with the greatest impact of fuel price increases being increases in fleet fuel economy rather than decreases in VMT. Charlie Wilson's old saying, “what's good for GM is good for the country” doesn't hold these days. Instead, what's good for the country may not be good for GM. The country is demanding fuel-efficient, low-polluting, economical cars these days. We can only hope that the domestic auto industry meets this challenge.
A cautionary note on the long-run demand for fuel-efficient cars is that “the long run income elasticity of fuel demand is typically found to fall in the range of 1.1 to 1.3.”10 This also includes the effects of increasing travel as income increases. “The implication is that fuel prices must rise faster than the rate of income growth, even to stabilize consumption at existing levels.” 10 However, in the current economy, income growth isn't the major concern.
There is important evidence from the literature that the distributional impacts of fuel price increases on households extends well beyond simply income effects. “Urban households in general are more price elastic than rural households. Urban multiple vehicle, multiple wage earner households are the most (fuel consumption) price responsive (-0.577), whereas single earner, single vehicle rural households are the least responsive (-0.091). It is therefore clearly evident that the price elasticity of different types of households can be very different.”18 Trip chaining as a response to higher gas prices is strongly suggested by various studies, meaning that neighborhoods with multiple opportunities for satisfying household needs lend themselves more easily to VMT decreases. Multiple wage earner households also have more flexibility in rearranging their travel patterns.
Single- or no-wage earner rural and exurban households have the least flexibility to adjust their travel patterns, and the least opportunity to engage in trip chaining. That they have been hit the hardest by the recent round of gas price spikes is consistent with recent housing price declines in areas populated by long-distance commuters. For example, the two worst hit areas in the country during the first three quarters of 2008 were Stockton and Merced, CA, each with price declines over 32%.19
Some papers “suggest that urban form, more than demographics, dictates the behavioral responses (to spikes in gas prices, and)…..higher gas prices may cause people to select better planned neighborhoods, with more mixed land uses and more transit- and pedestrian-friendly travel options.”12 This can put a positive spin on policies to keep gas prices high as is discussed in the final section of this brief paper. Indeed, social commentators are calling for transportation policies that would “encourage clustering,…. bringing Americans together in new ways. It would help maintain the social capital that's about to be decimated by the economic downturn.”20
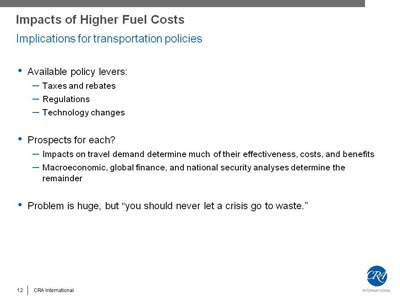
Implications for Transportation Policies
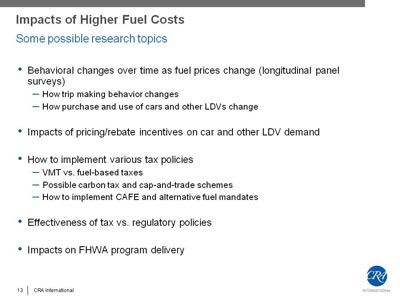
This brief paper is intended to summarize the issues and current knowledge about the impacts of higher fuel prices on the demand for surface transportation in the United States. It is intended to help workshop participants avoid spending time discussing what has already been researched in order to more efficiently identify important research needs for information to evaluate policies and procedures to foster or prevent certain changes from occurring to our transportation system.
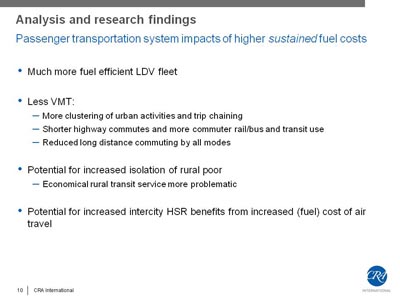
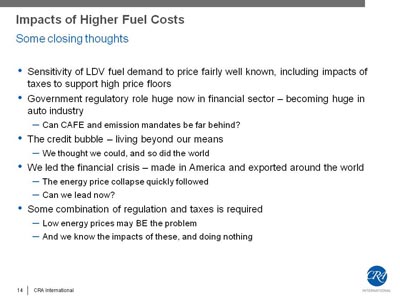
The research findings summarized in this paper do indicate that America`s surface transportation system will change with sustained high fuel prices. We can look forward to much more fuel-efficient cars and other LDVs, shorter highway commutes to work, more use of public transportation, more clustering of urban activities with shorter trip lengths and more opportunities for ridesharing matches, but also to the potential for more isolation of rural populations, particularly the rural poor. To the extent that urban densities increase, the market for public transportation will increase, probably offsetting their higher fuel costs. However, as the commuting population thins out in distant suburbs and rural areas, serving them economically with higher cost public transportation will be much more problematic. On the other hand, high-speed intercity surface transportation – true high-speed rail with travel times competitive with airlines trips between 180 and 350 miles – will find a ready market as air travel costs increase dramatically due to the sustained fuel price increases under this scenario.
In preparation for the January 9 workshop, it is useful to lay out some ground rules for considering the kinds of policies the nation may consider in responding to a high fuel price scenario. First, it's regulatory and investment decisions need to be based on a systematic analysis of economic benefits to ensure that scarce resources are flowing to projects with the most net public benefits. In this regard, we may want to consider early sayings of President-elect Barack Obama. He stated on Meet the Press, December 7: “We need to provide incentives for fuel efficient cars.” However, when asked: “what about a tax that brings gas up to $4 a gallon?”, Obama replied, “People are suffering, they can't afford $4 a gallon.” This is consistent with the general finding that mandating fuel economy standards is “politically more feasible than (raising) taxes. In the U.S. polls show broad popular support for standards but much less support for taxation.”21
On the other hand, there is a current outpouring of support for major gas tax increases by prominent commentators from all sides of the political spectrum, and by acknowledged experts. On the “left”, ”Thomas Friedman in The NY Times, “Win, Win, Win, Win, Win,…”22 and on the right, Charles Krauthammer in the Weekly Standard, “The Net Zero Gas Tax,”23 both argue passionately and eloquently for major gas tax increases. Daniel Sperling and Deborah Gordon, noted transportation energy researchers, argue for a variable gas tax, which produces a $3.50 a gallon floor gas price.24
Workshop Presentation
1 Energy Information Administration, http://tonto.eia.doe.gov/oog/info/gdu/gasdiesel.asp.
2 FHWA Traffic Volume Trends, https://www.fhwa.dot.gov/ohim/tvtw/tvtpage.cfm.
3 INREX National Traffic Scorecard Special Report "The Impact of Fuel Prices on Consumer Behavior and Traffic Congestion".
4 Energy Information Administration, http://tonto.eia.doe.gov/dnav/pet/pet_cons_psup_dc_nus_mbblpd_a.htm.
5 FHWA Traffic Volume Trends, https://www.fhwa.dot.gov/ohim/tvtw/tvtpage.cfm.
6 American Public Transportation Association web-site, http://www.apta.com/media/facts.cfm#hw02.
7 OECD ITF Joint Transport Research Centre Paper "Oil Dependence: Is Transport Running out of Affordable Fuel?" February 2008, http://www.sourceoecd.org/10.1787/235517712500.
8 Energy Information Administration, "Greenhouse Gases, Climate Change, and Energy" May 2008.
9 Jonathan E. Hughes, Christopher R. Knittel, and Daniel Sperling, "Evidence of a Shift in the Short-Run Price Elasticity of Gasoline Demand", National Bureau of Economic Research, Working Papers number 12530, 2006.
10 Daniel J. Graham and Stephen Glaister, "The Demand for Automobile Fuel: A Survey of Elasticities," Journal of Transport Economics and Policy, Volume 36, Part 1, January 2002.
11 Paul Schimek, "Trends in Personal Motor Vehicle Ownership and Use: Evidence from the Nationwide Personal Transportation Survey", 1998.
12 Bomberg, Kockelman, "Traveler Response to 2005 Gas Price Spike", TRB 2007.
13 Steven L. Puller, Lorna A. "Greening, Household adjustment to gasoline price change: an analysis using 9 years of US survey data," Energy Economics, 21 (1999).
14 Graham Currie, "Understanding Links Between Transit Ridership and Auto Gas Prices - US and Australian Evidence", TRB, 2008.
15 Todd Litman, "Changing Transportation Trends and Their Implications for Transport Planning", TRB 2008.
16 American Public Transportation Association, "Rising Fuel Costs: Impacts on Transit Ridership and Agency Operations, follow-up to September 2008 report.
17 Don Pickrell, Report to the Presidential Commission on Greenhouse Gas Reduction, 1995.
18 Wadud, Graham and Noland, "Gasoline Demand with Heterogeneity in Household Responses," TRB 2008.
19 Zillow.com.
20 David Brooks, op ed, NYTimes, December 9, 2008.
21 Clerides and Zachariadis, "The Effect of Standards and Fuel Prices on Automobile Fuel Economy: An International Analysis", Energy Economics 30 (2008).
24 NY Times, "How High Gas Prices Can Save the Car Industry," 11/16/08.