Achieving Intermodal Interoperability for Freight Movements
Joe Bryan, Halcrow
The Issue
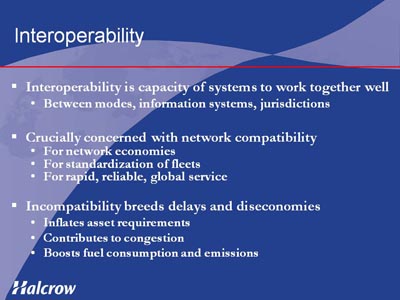
Interoperability is the ability of diverse systems and organizations to work together well. In freight transportation, the question of interoperability most often is between modes, but it can be between information systems, or between jurisdictions when standards or regulations differ. In transportation, the crucial question is about the compatibility of networks and their ability to function as one. The importance of this is threefold: first, for the achievement of network economies; second, for the related standardization of fleets; and third, for the provision of rapid and reliable service to markets, ranging from regional to global. Interoperability is a visible issue in the aspiration of services to be “seamless” and the stress placed on transportation performance measured door to door. The delays and diseconomies that come from incompatibility add to asset requirements, traffic congestion, fuel consumption, and emissions.
Several of the more prominent interoperability issues in the United States lie with operating equipment: trucks, railcars, trailers, containers, and such. In one case, regulatory nonalignment affects the configuration of equipment allowed to travel between domestic jurisdictional regions and across the NAFTA borders. Nonalignment also extends to other elements governing operations, like driver rules and cabotage laws. The operating constraint here is not due to the regulations per se, but rather to their differences, and the resulting effect on the free flow of fleets across boundaries. Once again, the fundamental limitation from restricted interoperability occurs in the network, which encounters diseconomies and loss of mobility.
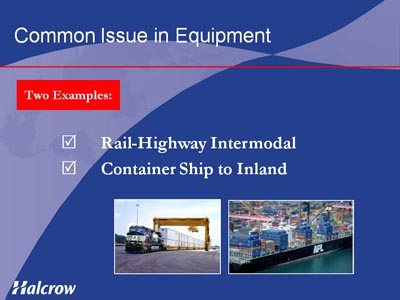
This paper will review two further issues of equipment interoperability, one in rail-highway intermodal and the other in container ship to inland. It will consider why they occur and persist, the implications for the transportation network, and the kinds of policies that might prompt a more efficient and integrated system.
Rail-Highway Intermodal
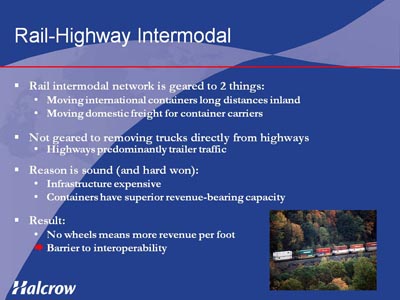
The dominant form of commercial truck equipment on the nation's highways is a wheeled trailer, with dry vans being the most common type. On the nation's rail intermodal network, the dominant form of equipment is an unwheeled container, with dry vans being almost the exclusive type. The network is not geared to removing trucks directly from the highway; it is geared first to moving international containers long distances inland and second to moving freight from the small set of domestic operators who own and can substitute containers for trailers. The incompatibility of highway with intermodal equipment has a sound logic, based in the need for trains to have high revenue-bearing capacity and to run on a capital-intensive network of controlled scale. To manage capital intensity, the system of rail infrastructure has been reduced over decades to a viable size. The financial return on that now-limited capacity can be measured in its revenue utilization per foot of train. The highest intermodal revenue per foot comes from containers moving stacked atop one another, which means they cannot have wheels. This operating configuration has persuasive economies in dense lanes that can keep trains full. It is a linehaul and not a pickup-and-delivery economy, so it has its greatest effect at long distances, and railroads have invested heavily to exploit it. Trailers – normally reinforced for rail lifting – continue to be carried in intermodal service, but railroads no longer own them, and, in most cases, trailer trains are neither the leading product nor the impetus for private investment.
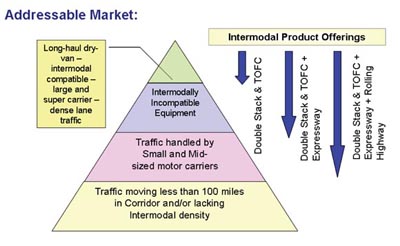
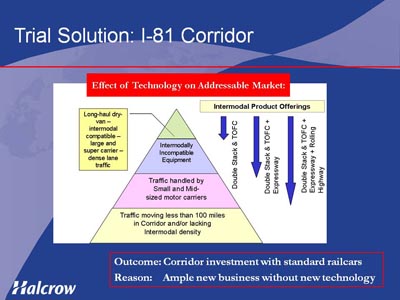
This lack of interoperable equipment between the highway and the intermodal networks restricts the size of the market rail services address. A 2003 study for the Commonwealth of Virginia looked at this problem along the I-81 corridor, and with railroad cooperation attempted to resolve it1. A graphic from that study appears at left, illustrating the way that adoption of different railcar technologies increases the size of the addressable rail market, by deepening intermodal penetration among highway equipment types and the truck lines operating them. The key technology was the Expressway railcar platform used by Canadian Pacific (CP) Rail in Canada, which is able to handle virtually any type of trailer on the road without modification. By eliminating the barrier of interoperability for most motor carriers (including smaller and private ones), their utilization of rail services could be expected to go up and highway diversions increase, which in turn became part of the logic for public investment in rail. The subsequent result of that study is instructive. The railroad went ahead with investments and new service development along the corridor, but stayed with conventional railcar technology. Their reasoning is that the quantity of new business they can attract conventionally seems sufficient to them, and still appears to warrant public support. A second reason may be that the economies of the new technology are in terminals and pickup and delivery, which favors shorter distances and less revenue per foot. The technology in question presented its own challenges of interoperability within the railroad, in that it required either utilization in fixed corridors or an expensive, broader roll out in order to achieve network balance. In Canada, where it remains in service, the first solution has been adopted over a relatively short distance route.2
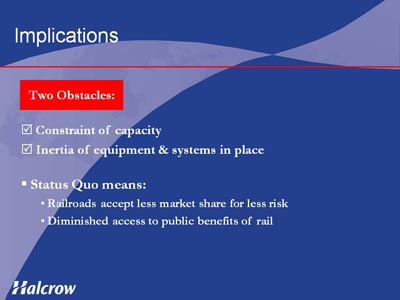
Implications – There are two obstacles to interoperability in rail-highway intermodal. The first is the constraint of capacity, which then must be devoted only to the most beneficial uses. In the absence of public investment, the measure of benefit will be private financial returns, and it will favor and should favor long-haul stack trains. The second obstacle is the inertia of equipment and systems in place. Much capital has been sunk into railcars and rail yards designed to optimize on a limited network. Even if that limitation were lifted, a different and parallel technology would have to develop its own set of operational economies. Continuance of the status quo means that railroads may take on less traffic than the public may like, with consequences for roadway congestion, national energy consumption, carbon management, shipping costs, and the cost of goods.
Container to Ship Inland
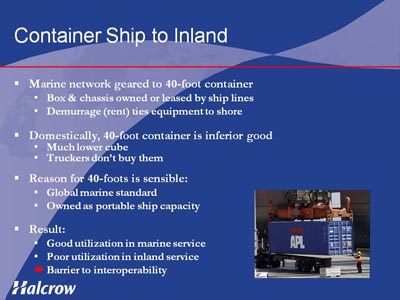
The principal international marine container is a 40-foot dry box, without wheels. Containers of 20 feet and 45 feet exist, as well as isotainers to handle certain bulks, but the 40-foot box is the dominant form of equipment used in U.S. foreign trade and around the world. Container ships and handling systems are designed to optimize its transport, and while a larger container can be managed above decks, irregularity can challenge efficiency. This equipment is owned or leased primarily by steamship lines, which also provide a wheeled chassis to transport the box in pickup and delivery.
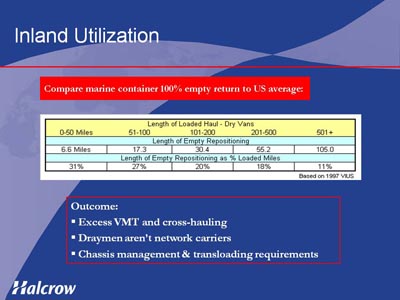
By domestic standards, the 40-foot box is an inferior good: it offers roughly two-thirds less cubic carrying capacity than the 53-foot trailer normally run by a U.S. truck line and its chassis doesn't have use in ordinary domestic service. Moreover, the ship lines make an understandable effort to control their assets and keep them tied to their ports, by limiting the time allowed for pickup-and-delivery service and charging demurrage fees on a rising scale for overage. The consequence is that the carriage networks for international and domestic goods are separate. The average dray distance for most ports is well within the overnight distance for a single truck driver, and dray carriers typically do not operate as network fleets that interlink and balance many lanes. Instead, pricing normally is based on 100% empty return, which carriers portray as operationally factual; export lanes are not the reverse of import in any case, while time, ownership, and cube all work against triangulation with domestic freight. Even allowing for the higher degree of imbalance characteristic of shorter haul distances, this is poor utilization. By comparison, national average empty returns for all dry vans appear in the table below, and they show a far more efficient pattern: the worst empty factor is 31%, not 100%.3
| Length of Loaded Haul - Dry Vans | ||||
|---|---|---|---|---|
| 0-50 Miles | 51-100 | 101-200 | 201-500 | 500+ |
| Length fo Empty Repositioning | ||||
| 6.6 Miles | 17.3 | 30.4 | 55.2 | 105.0 |
| Length fo Empty Repositioning | ||||
| 31% | 27% | 20% | 18% | 11% |
The problem of inland interoperability has additional repercussions. First, the separation of the wheel set from the box creates a parallel group of assets to be managed and matched, and this is further complicated by the relegation of both components of equipment to use by the owning ship lines – a prescription for inefficiency that chassis pools are just beginning to address. Next, the arrangement where trucking companies contribute only tractors and none of the trailing equipment is unique to the United States and is otherwise rare in U.S. common carriage; for the operator best able to improve utilization, it diminishes the incentive to do so, contributing to cross-hauling and excess vehicle miles traveled (VMT). Last, the transloading of goods from marine containers to domestic equipment arose partly as a solution to the disconnected networks, and partly for reasons of consolidation and supply chain management. To the extent that the former is a motivation, it is an extra step and an extra cost.
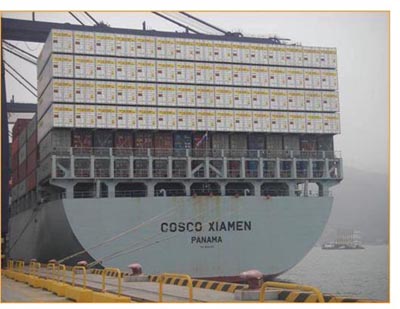
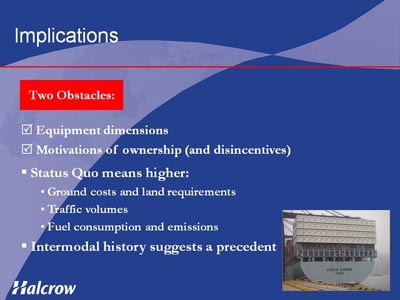
Implications – The chief obstacles to interoperability in container ship to inland are the dimensions of the equipment and the motivations of ownership. The misalignment of international containers with domestic service is more importantly a matter of cubic capacity than of chassis requirement. In any case, the latter is a necessary corollary of ship loading, where the former is not – as the photograph at left illustrates for 53-foot top loading. The problem of ownership is that marine operators have every reason to maintain a standard box and keep it close to shore, while the groundside operators have little reason and some disincentive to improve the productivity of someone else's asset. In this sense, it wouldn't matter if container leasing companies introduced bigger equipment, because of the party to whom they would offer it. The ground carrier doesn't bear the burden of the lease and the obligation to make it lucrative; the ship line does, but considers it for a portable unit of vessel capacity. Economic interests thus prevent the marine and land networks from meshing.
The situation may be reminiscent of the rail intermodal industry 20 years ago. To assure service, railroads at that time supplied trailing equipment to draymen, which ran balkanized operations with low utilization around rail ramps. When the railroads withdrew the equipment because the business had matured, groundside operators who had or could develop networks to support their own assets stepped up. Interestingly, this also stimulated development of railcars that could fully accommodate 53-foot domestic boxes. Steamship lines are not likely to stop supplying containers, but ground carriers with fleets might alter the situation from the land side. Meanwhile, continuance of the status quo brings excessive repositioning of too much equipment and with it higher ground costs, land requirements, traffic volumes, fuel consumption, and emissions of carbon and other substances.
Policy Options
Limitations to interoperability bring with them a mixture of private handicaps and public burdens. Drawbacks on the private side may not involve inefficiencies: the rail position for highway diversion is about accepting less market share for less risk. It is productive on its own terms, and it is satisfactory to railroads that have seen the downside of the fixed costs of infrastructure. Thus, drawbacks may be tolerable to the existing private interests: port draymen aren't bothered by high empty returns they can charge for, and ship lines want their carrying equipment back. If problems of interoperability are most importantly a disconnect between networks, then one source of difficulty can be that players are happy in their parts, and the public interest in the whole either has to be asserted on its own, or borne by new or evolving players with system ambitions. To the public sector, the value of solutions lies in the matters cited above: management of congestion and roadway costs, economic competitiveness, land use, energy requirements, air quality, and carbon control. Policy responses to promote interoperability can include direct investment and eligibility requirements, multijurisdictional programs, pricing and incentives, setting or encouragement of standards, pursuit of consistent regulation - and keeping an informed eye on markets as they sort themselves out.
One useful development from a policy perspective is the rise of intermodal corridors linking gateways to distribution hubs - the Heartland Corridor between Norfolk and Columbus is an example of this. Because they are intended as integrated intermodal products, and the promoters want public support, public agencies can seek the inclusion of desirable features. An example might be additional capacity to foster domestic trailer service on the corridor, or on a different route; another would be incorporation of an initiative for domestic size containers in overseas trade. Linkage of these corridors into larger networks is essential; system plans could be stipulated as a condition for rail investment, and core freight routes that also accommodate drayage could be required in the transportation plans of involved communities. Corridor applications are one of the central arguments for multijurisdictional programs; the furtherance of such programs is consistent with interoperability goals because they help integrate networks, so support for them as a matter of policy makes sense.
Pricing tools may become more diverse in the next few years. If fuel taxes are increased or freight user fees are imposed, reductions could be allowed for trucks in intermodal service, provided they met certain, perhaps escalating, standards for empty returns. Should carbon monetization be introduced, it could substantially change the calculus for interoperability. Higher cube containers might acquire greater value, and better equipment utilization might earn better credits. Conceivably, it could make shorter distance rail lanes more attractive to railroads simply by adding another element to profitability, which could in turn boost operating models that are focused on terminal and pickup-and-delivery efficiency.
As a final point, it is worth noting that players with committed capital and entrenched interests may support the status quo, and that change may come from outside with new players possessing different objectives. One of the real improvements to interoperability in recent years occurred in information technology. The conventional effort to stitch together legacy information systems with electronic data interchange was transformed by the arrival of web-based platforms, which were simpler, more effective, and much more accessible. (Transformation in this realm will continue; for example, as the technology communicating terminal and road conditions moves from passive information pools to proactive streams, it will reach deeper into user environments and sharpen operating decisions.) Public policy generally may favor standing out of the way of innovation, but it also can see to it that competition is allowed, and the path to new developments is not blocked.
Workshop Presentation
1 The Northeast – Southeast – Midwest Corridor Marketing Study, Examining The Potential To Divert Highway Traffic From Interstate 81 To Rail Intermodal Movement: Final Report to Virginal Department of Rail and Public Transportation, Reebie Associates, 2003
2 CP Rail invested $52M in Expressway's introduction, primarily for equipment and terminals. Originally hoped to spur a public-private partnership to finance double tracking of the Montreal-Detroit corridor, the heavy public investment did not occur.
3 VIUS (the since-discontinued federal Vehicle Inventory and Use Survey) relied on operator reporting, the figures are ten years old, and the conversion of distances to percentages is estimated. It also is possible for load factors to be lighter on "backhaul" segments. However, dry vans are the most versatile of equipment, and the pattern is clear: van carriers do not normally run half their miles empty.