





Our Nation’s Highways 2026
Roads
The economic growth of the United States in the 250 years of its existence and the record of individual prosperity achieved by its people in this short period of time are attributable to the success of the transportation system it developed - a system almost totally dependent on our highways. Over its history, the U.S. has devoted significant resources to the creation of a road network that connects its people, agriculture, and industry. In 1900, the U.S. had an estimated 2.3 million miles of roads. The first census of rural roads occurred in 1904 and recorded 2.2 miles of rural roads, of which 7 percent were “surfaced.” Most of the designated systems of State highways were established during the early years of the 20th century, and many resulted from the Federal-Aid Road Act of 1916. The Nation reached 3.0 million miles of roads in 1918 but did not see substantial growth again until the 1950s. The Nation surpassed 4.0 million miles of roads in 2005. Public roads, which include interstates, U.S. highways, State highways, and local roads, now stretch 4.2 million miles throughout the country.
Drive Through History
February 2, 1938
President Roosevelt gives Thomas MacDonald, then Chief of the Bureau of Public Roads, the map, pictured right, with his own hand-drawn blue lines illustrating where five north-south and east-west transcontinental highway routes should be built.
In 2026, the U.S. celebrates the 70th anniversary of the Interstate System. From the day President Dwight D. Eisenhower signed the Federal-Aid Highway Act of 1956, the Interstate System has been a part of our culture as construction projects, as transportation in our daily lives, and as an integral part of the American way of life. And similar to the growth in all public roads, the U.S. Interstate System has grown from 39,990 miles in 1956 to 48,830 miles today with an additional 286 miles in Puerto Rico.
Public Road and Interstate System Miles, 1900-2024
| Year | Public Road Miles (in millions) |
Interstate Miles |
|---|---|---|
| 1900 | 2.3 | |
| 1901 | 2.3 | |
| 1902 | 2.3 | |
| 1903 | 2.3 | |
| 1904 | 2.4 | |
| 1905 | 2.4 | |
| 1906 | 2.4 | |
| 1907 | 2.4 | |
| 1908 | 2.4 | |
| 1909 | 2.4 | |
| 1910 | 2.4 | |
| 1911 | 2.5 | |
| 1912 | 2.5 | |
| 1913 | 2.6 | |
| 1914 | 2.7 | |
| 1915 | 2.7 | |
| 1916 | 2.9 | |
| 1917 | 2.9 | |
| 1918 | 3.0 | |
| 1919 | 3.1 | |
| 1920 | 3.1 | |
| 1921 | 3.2 | |
| 1922 | 3.2 | |
| 1923 | 3.2 | |
| 1924 | 3.2 | |
| 1925 | 3.2 | |
| 1926 | 3.2 | |
| 1927 | 3.3 | |
| 1928 | 3.3 | |
| 1929 | 3.3 | |
| 1930 | 3.3 | |
| 1931 | 3.3 | |
| 1932 | 3.3 | |
| 1933 | 3.3 | |
| 1934 | 3.3 | |
| 1935 | 3.3 | |
| 1936 | 3.3 | |
| 1937 | 3.2 | |
| 1938 | 3.3 | |
| 1939 | 3.3 | |
| 1940 | 3.3 | |
| 1941 | 3.3 | |
| 1942 | 3.3 | |
| 1943 | 3.3 | |
| 1944 | 3.3 | |
| 1945 | 3.3 | |
| 1946 | 3.3 | |
| 1947 | 3.3 | |
| 1948 | 3.3 | |
| 1949 | 3.3 | |
| 1950 | 3.3 | |
| 1951 | 3.3 | |
| 1952 | 3.3 | |
| 1953 | 3.4 | |
| 1954 | 3.4 | |
| 1955 | 3.4 | |
| 1956 | 3.4 | 39,990 |
| 1957 | 3.5 | 39,223 |
| 1958 | 3.5 | 40,675 |
| 1959 | 3.5 | 40,614 |
| 1960 | 3.5 | 40,617 |
| 1961 | 3.6 | 40,790 |
| 1962 | 3.6 | 40,859 |
| 1963 | 3.6 | 40,847 |
| 1964 | 3.6 | 40,930 |
| 1965 | 3.7 | 40,931 |
| 1966 | 3.7 | 40,956 |
| 1967 | 3.7 | 40,970 |
| 1968 | 3.7 | 42,460 |
| 1969 | 3.7 | 42,545 |
| 1970 | 3.7 | 42,558 |
| 1971 | 3.8 | 42,502 |
| 1972 | 3.8 | 42,718 |
| 1973 | 3.8 | 42,748 |
| 1974 | 3.8 | 42,801 |
| 1975 | 3.8 | 42,858 |
| 1976 | 3.9 | 42,580 |
| 1977 | 3.9 | 41,927 |
| 1978 | 3.9 | 42,681 |
| 1979 | 3.9 | 42,894 |
| 1980 | 3.9 | 41,051 |
| 1981 | 3.9 | 42,226 |
| 1982 | 3.9 | 42,424 |
| 1983 | 3.9 | 43,023 |
| 1984 | 3.9 | 43,305 |
| 1985 | 3.9 | 43,589 |
| 1986 | 3.9 | 43,844 |
| 1987 | 3.9 | 44,318 |
| 1988 | 3.9 | 44,629 |
| 1989 | 3.9 | 44,849 |
| 1990 | 3.9 | 45,074 |
| 1991 | 3.9 | 45,279 |
| 1992 | 3.9 | 45,467 |
| 1993 | 3.9 | 45,508 |
| 1994 | 3.9 | 45,583 |
| 1995 | 3.9 | 45,744 |
| 1996 | 3.9 | 46,037 |
| 1997 | 4.0 | 46,064 |
| 1998 | 3.9 | 46,084 |
| 1999 | 3.9 | 46,317 |
| 2000 | 4.0 | 46,427 |
| 2001 | 4.0 | 46,472 |
| 2002 | 4.0 | 46,483 |
| 2003 | 4.0 | 46,508 |
| 2004 | 4.0 | 46,572 |
| 2005 | 4.0 | 46,608 |
| 2006 | 4.0 | 46,630 |
| 2007 | 4.0 | 46,672 |
| 2008 | 4.1 | 46,751 |
| 2009 | 4.1 | 46,720 |
| 2010 | 4.1 | 46,900 |
| 2011 | 4.1 | 46,960 |
| 2012 | 4.1 | 47,432 |
| 2013 | 4.1 | 47,574 |
| 2014 | 4.2 | 47,662 |
| 2015 | 4.2 | 48,053 |
| 2016 | 4.1 | 48,191 |
| 2017 | 4.2 | 48,254 |
| 2018 | 4.2 | 48,440 |
| 2019 | 4.2 | 48,482 |
| 2020 | 4.2 | 48,472 |
| 2021 | 4.2 | 48,519 |
| 2022 | 4.2 | 48,605 |
| 2023 | 4.2 | 48,415 |
| 2024 | 4.2 | 48,830 |
Highway Functional Classification
FHWA provides guidance to States for the classification of their roads, which categorizes roads according to their purposes: local, collector, and arterial. The classifications are defined on a continuum of access and mobility. A roadway that connects homes, businesses, and other destinations provides access. A roadway that leads to interruption-free driving provides mobility. Local roads provide high access to homes, businesses, and other community functions with lower mobility. Arterial roads, which include interstates, provide safe, reliable, and efficient travel between towns and cities with high mobility but lower access. Collector roads channel traffic from local roads to arterials and vice-versa. As such, they tend to balance access and mobility. Local roads, with 2.9 million miles, account for the largest share of public roads at 69 percent. Collectors account for 20 percent, and arterials are 11 percent.
Hierarchy of Our Road System by Miles, 2024
| Roadway Classification | Miles | Percent of Miles |
|---|---|---|
| Arterials | 472,082 | 11% |
| Collectors | 822,038 | 20% |
| Local Roads | 2,914,334 | 69% |
Highway Systems
The National Highway System (NHS) comprises 221,568 miles of U.S. public roads. These roads are important to the Nation's economy, defense, and mobility. Comprising 5 percent of public road mileage, the NHS includes interstates, other principal arterials, the Strategic Highway Network, other major strategic highway network connectors, and intermodal connectors. (The Strategic Highway Network, or STRAHNET, is a system of public highways that provides access, continuity, and emergency transportation of personnel and equipment for national defense purposes.) While the NHS accounts for 5 percent of public road miles, it carries 55 percent of all travel. Fifty-eight percent of NHS miles are in rural areas, and 42 percent are in urban areas.
Interstate System and Other National Highway System Roads
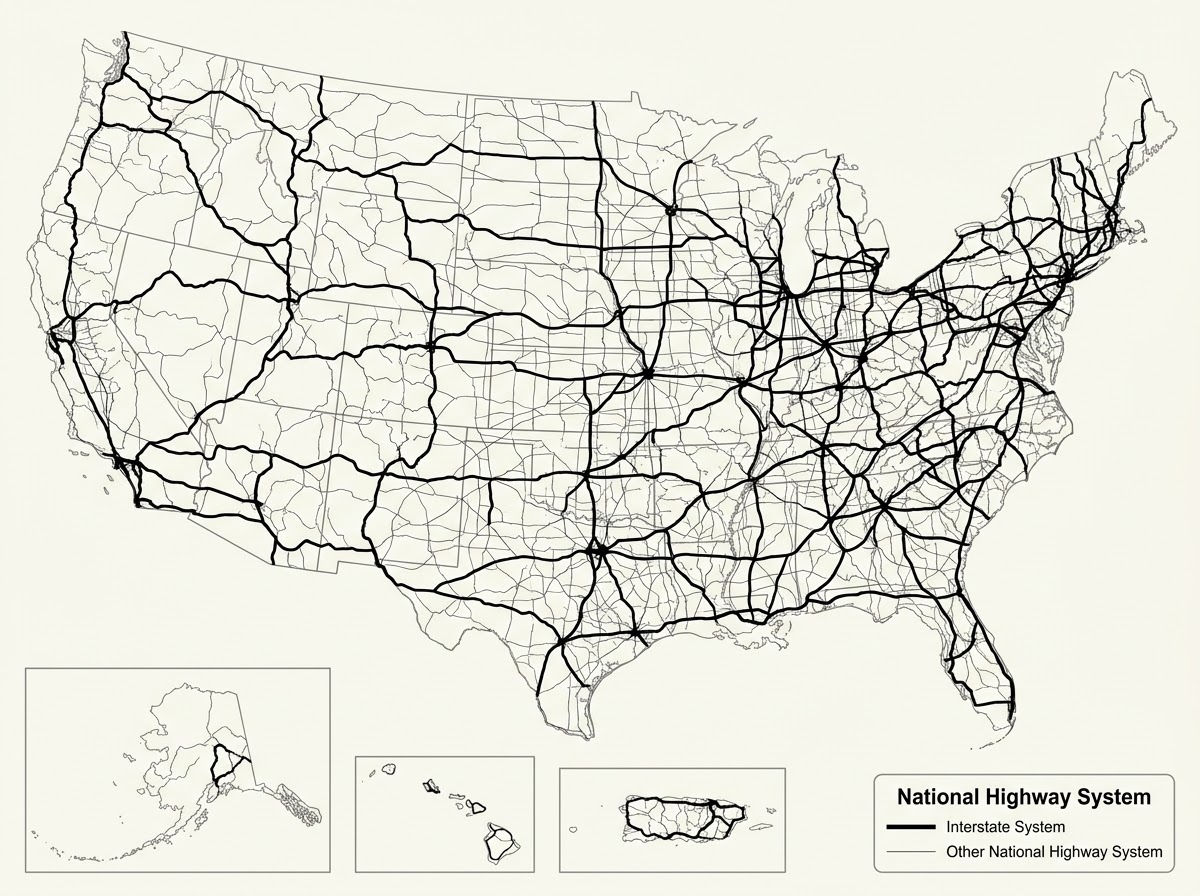
The Interstate System, including Puerto Rico, is 49,116 miles long and comprises 1 percent of all public roads. However, it carries 26 percent of all travel and plays an outsized role in linking our country. All U.S. cities with a population over 1 million are connected by the Interstate System. The Interstate System connects 46 of the 50 State capitals, as well as the Nation's capital. Sixty percent of interstate miles are in rural areas, and 40 percent are in urban areas. As shown in Table 2-1, the Interstate System has experienced steady growth since 1980. However, it has remained around 1 percent of all public roads since its formation in 1956.
Bridges
Bridges are key components of our Nation’s roadway system. Maintaining their integrity is critical for safe and efficient travel. States and Federal agencies conduct periodic inspections of all highway bridges on public roads that are more than 20 feet long. These bridges include those located on interstates, U.S. highways, and State and local roads, as well as publicly accessible bridges on Federal and Tribal lands. These agencies report inspection data to FHWA, which compiles it into the National Bridge Inventory (NBI). In 2024, there were 620,762 bridges on public roads in the 50 States and D.C. This number includes 146,594 bridges on the NHS and 58,504 on interstates.
Number of Bridges by State, 2024
| State | All Bridges | NHS Bridges | Other Bridges |
|---|---|---|---|
| Texas | 56,729 | 18,317 | 38,412 |
| Illinois | 26,928 | 4,829 | 22,099 |
| Ohio | 26,729 | 4,948 | 21,781 |
| California | 25,848 | 10,905 | 14,943 |
| Kansas | 24,894 | 2,866 | 22,028 |
| Missouri | 24,618 | 3,663 | 20,955 |
| Iowa | 23,719 | 2,657 | 21,062 |
| Pennsylvania | 23,299 | 5,868 | 17,431 |
| Oklahoma | 22,917 | 3,138 | 19,779 |
| Tennessee | 20,379 | 4,374 | 16,005 |
| Indiana | 19,495 | 3,091 | 16,404 |
| North Carolina | 19,210 | 3,904 | 15,306 |
| New York | 17,642 | 5,528 | 12,114 |
| Mississippi | 16,739 | 2,806 | 13,933 |
| Alabama | 16,205 | 3,182 | 13,023 |
| Nebraska | 15,398 | 1,521 | 13,877 |
| Georgia | 15,069 | 4,076 | 10,993 |
| Kentucky | 14,548 | 2,120 | 12,428 |
| Wisconsin | 14,446 | 3,604 | 10,842 |
| Virginia | 14,121 | 3,862 | 10,259 |
| Minnesota | 13,532 | 1,736 | 11,796 |
| Florida | 13,036 | 5,837 | 7,199 |
| Arkansas | 12,974 | 2,325 | 10,649 |
| Louisiana | 12,698 | 3,032 | 9,666 |
| Michigan | 11,371 | 2,978 | 8,393 |
| South Carolina | 9,490 | 1,783 | 7,707 |
| Colorado | 8,965 | 2,765 | 6,200 |
| Arizona | 8,573 | 3,282 | 5,291 |
| Washington | 8,474 | 2,612 | 5,862 |
| Oregon | 8,305 | 1,857 | 6,448 |
| West Virginia | 7,348 | 1,306 | 6,042 |
| New Jersey | 6,827 | 3,034 | 3,793 |
| South Dakota | 5,887 | 986 | 4,901 |
| Maryland | 5,484 | 1,899 | 3,585 |
| Massachusetts | 5,296 | 2,306 | 2,990 |
| Montana | 5,224 | 1,356 | 3,868 |
| Idaho | 4,616 | 837 | 3,779 |
| Connecticut | 4,365 | 1,821 | 2,544 |
| North Dakota | 4,255 | 653 | 3,602 |
| New Mexico | 4,035 | 1,616 | 2,419 |
| Wyoming | 3,136 | 1,329 | 1,807 |
| Utah | 3,125 | 1,400 | 1,725 |
| Vermont | 2,862 | 484 | 2,378 |
| New Hampshire | 2,542 | 727 | 1,815 |
| Maine | 2,518 | 530 | 1,988 |
| Nevada | 2,099 | 984 | 1,115 |
| Alaska | 1,685 | 432 | 1,253 |
| Hawaii | 1,195 | 521 | 674 |
| Delaware | 872 | 340 | 532 |
| Rhode Island | 783 | 419 | 364 |
| District of Columbia | 257 | 148 | 109 |
Tunnels
Tunnels are another crucial part of our roadway system. Routine and thorough inspections of our Nation’s tunnels maintain safe operation and prevent failures. FHWA’s National Tunnel Inventory (NTI) contains tunnel data from all public roads, including tribally and federally-owned tunnels. Governments have reported annually to the NTI since 2018. In 2024, there were 566 tunnels on public roads across 43 States and D.C. Seven States reported not having tunnels: Delaware, Maine, Mississippi, New Hampshire, North Dakota, South Carolina, and Vermont.
Number of Tunnels by State, 2024
State |
All Tunnels |
|---|---|
| California | 107 |
| Washington | 62 |
| Massachusetts | 48 |
| Colorado | 43 |
| North Carolina | 29 |
| Pennsylvania | 28 |
| District of Columbia | 17 |
| Virginia | 17 |
| Oregon | 15 |
| Tennessee | 14 |
| Hawaii | 12 |
| Michigan | 11 |
| New York | 11 |
| West Virginia | 11 |
| Idaho | 10 |
| Kentucky | 10 |
| Wyoming | 10 |
| Texas | 8 |
| Utah | 8 |
| Arizona | 7 |
| South Dakota | 7 |
| Indiana | 6 |
| Minnesota | 6 |
| Nevada | 6 |
| Oklahoma | 6 |
| Illinois | 5 |
| Maryland | 5 |
| Montana | 5 |
| New Jersey | 5 |
| Wisconsin | 5 |
| Alabama | 4 |
| Alaska | 4 |
| Florida | 4 |
| Connecticut | 3 |
| Nebraska | 3 |
| New Mexico | 3 |
| Arkansas | 2 |
| Georgia | 2 |
| Louisiana | 2 |
| Iowa | 1 |
| Kansas | 1 |
| Missouri | 1 |
| Ohio | 1 |
| Rhode Island | 1 |
| Delaware | 0 |
| Maine | 0 |
| Mississippi | 0 |
| New Hampshire | 0 |
| North Dakota | 0 |
| South Carolina | 0 |
| Vermont | 0 |
Toll Facilities
Toll facilities are roads, bridges, and tunnels that require drivers to pay a fee for usage. Governments typically collect tolls from these facilities to repay the money borrowed for facility construction and for ongoing operations and maintenance. Toll mileage in 2023 included 6,289 miles of toll roads and 337 miles of toll bridges and tunnels. This mileage compares to 5,434 miles of toll roads and 312 miles of toll bridges and tunnels in 2013. Although most interstates do not require tolls, in 2023 the Interstate System included 3,725 miles of toll roads and 131 miles of toll bridges and tunnels.
Toll Facility Mileage by Year, 2013-2023
| Year | Interstate (miles) | Not Interstate (miles) |
|---|---|---|
| 2013 | 3,413 | 2,333 |
| 2015 | 3,419 | 2,463 |
| 2017 | 3,496 | 2,504 |
| 2020 | 3,715 | 2,643 |
| 2023 | 3,855 | 2,770 |