U.S. Department of Transportation
Federal Highway Administration
1200 New Jersey Avenue, SE
Washington, DC 20590
202-366-4000
Federal Highway Administration Research and Technology
Coordinating, Developing, and Delivering Highway Transportation Innovations
|
LTBP NEWS This newsletter is an archived publication and may contain dated technical, contact, and link information. |
|
| Publication Number: FHWA-HRT-14-019 Date: Volume 3, December 2013 |
Publication Number: FHWA-HRT-14-019 Date: Volume 3, December 2013 |
The Arlington Memorial Bridge (also known as Memorial Bridge), shown in figure 1, was built in 1932 and spans the Potomac River. It connects Washington, DC, at the Lincoln Memorial and Virginia at Arlington National Cemetery.

Figure 1. Photo. Arlington Memorial Bridge, northeastern view from Mount Vernon Trail.
The bridge is 2,138 ft (651.7 m) long and consists of 9 arches. There are 4 concrete masonry arches that are 166 to 180 ft (50.6 to 54.9 m) long on each side of the bridge, connected in the middle by a double-leaf, 184-ft (56.1-m) steel bascule span. There are also two smaller concrete girder spans over low-level roadways at each end of the bridge.
The Memorial Bridge is over 80 years old and has never undergone a major rehabilitation. Temporary repairs have kept it operational. However, like many other older highway bridges across the Nation, it needs repairs that will ensure safe and effective service for decades to come.
The Federal Highway Administration (FHWA) provides management and engineering services to the National Park Service (NPS) for the Memorial Bridge. The Eastern Federal Lands Highway Division (EFLHD) requested the FHWA’s Long-Term Bridge Performance (LTBP) Program’s assistance in surveying the bridge deck. The LTBP Program, in cooperation with Rutgers University’s Center for Advanced Infrastructure and Transportation (CAIT), conducted a 3-day assessment (six hours a day, including equipment setup) of the deck in February 2013.
The main objective was to assess the condition of the bridge deck regarding concrete quality (degradation), corrosion, and extent and severity of delamination and overlay debonding.
The 90-ft (27.4-m)-wide bridge deck contains a 15-ft (4.6-m) sidewalk on each side of the bridge roadway. The 6-lane roadway measures 60 ft (18.3 m) in width. The bridge deck consists of reinforced concrete with an asphalt overlay ranging from 2 to 4 inches (50.8 to 101.6 mm).
The condition assessment was achieved through the survey of three of six bridge lanes (two next to the sidewalks and one in an interior lane) using the Robotically Assisted Bridge Deck Assessment Tool (RABITTM) (figure 3) along with three advanced and customized semiautomated nondestructive evaluation (NDE) technologies: ground-penetrating radar (GPR), impact echo (IE), and ultrasonic surface wave (USW) testing.
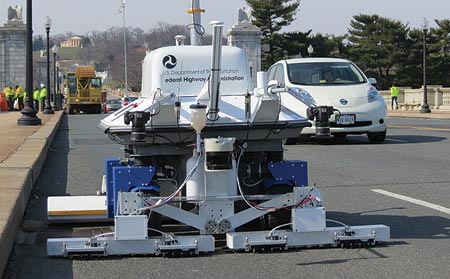
Figure 3. Photo. Arlington Memorial Bridge deck assessment using the RABIT™ bridge deck assessment tool.
The assessment was conducted using the RABITTM bridge deck assessment tool, which incorporates multiple NDE technologies: GPR, IE, USW and electrical resistivity (ER), and digital imaging. ER was not deployed during the surveys because of the presence of the asphalt overlay. The RABITTM bridge deck assessment tool collected data at a rate of about 4,000 square ft (371.6 square m) per hour. This enabled a 6-ft (1.8-m)-wide pass on a single lane, excluding the system preparation, within approximately three hours.
Results of the deck survey using the RABITTM bridge deck assessment tool confirmed initial visual inspection and coring conducted by EFLHD. Hratch Pakhchanian, Branch Leader of the Bridge Branch, was impressed with the speed at which the evaluation was completed and the accuracy and quality of the data provided to assist EFLHD in deciding the ultimate rehabilitation for the Memorial Bridge. He remarked, “With the RABITTM bridge [deck] assessment tool, impact to traffic is significantly reduced and our workers are not exposed to the dangers of working with traffic in adjoining lanes. This was one of the first applications of the RABITTM [bridge deck assessment] tool in addition to LTBP bridges; I see its potential for application on a great number of projects in the future. It provides information on the condition of a concrete bridge deck with greater accuracy in real time and in a consistent manner and allows us to gather it faster, compared to conventional NDE tools, with greater coverage.”
For questions on the Arlington Memorial Bridge rehabilitation project, contact Hratch.pakhchanian@dot.gov. For information on the RABIT™ bridge deck assessment tool, contact Hamid.Ghasemi@dot.gov.
Hamid Ghasemi was selected as the Team Leader of the Infrastructure Management Team in the Office of Infrastructure, Research, and Development at FHWA. Ghasemi previously served as the LTBP Program manager. In that role, he developed a framework for both short- and long-term program goals, directed the program through its pilot phase, and led research in advancing the state of the practice on the use of automated NDE technologies for condition assessment of highway bridges.
Ghasemi recognizes the importance of LTBP in developing the database decision-support tools to manage the Nation’s bridges more effectively. He also has an intimate understanding of the challenges the bridge community faces and the degree of cooperation it will take to overcome these daunting challenges.
Ghasemi joined FHWA in 1992 as a research structural engineer after earning a doctorate degree in structural engineering at the University of Kentucky. He has worked on the seismic isolation of highway bridges and was the driving force behind the testing of 11 seismic isolation devices. Ghasemi wrote 12 of the seismic isolation project’s 14 reports, all of which are used internationally. He represented FHWA on the AASHTO Subcommittee on Bridges and Structures’ Technical Committee T-3 for Seismic Design, and assisted in the development of the new AASHTO Guide Specifications for Seismic Isolation Design—3rd Edition.

Figure 2. Photo. Dr. Hamid Ghasemi.
The American Society of Civil Engineers announced that the RABIT™ bridge deck assessment tool was selected for the 2014 Charles Pankow Award for Innovation.
Established in honor of Charles J. Pankow (1924–2004), the award celebrates collaboration in innovative design, materials, or construction-related research and development transferred into practice in a sustainable manner. Entries must be market ready and/or commercially viable. Studies of advancements in the design and construction industry have demonstrated that collaborative efforts among academia, industry, and government are often essential to the implementation of research. Entries therefore must demonstrate that collaboration was involved during any part of the cycle from development to application.
The RABIT™ bridge deck assessment tool was developed through a partnership between the U.S. Department of Transportation FHWA’s Turner-Fairbank Highway Research Center (TFHRC) and the CAIT at Rutgers. The RABIT™ bridge deck assessment tool is a product of FHWA’s LTBP Program.
The Charles Pankow Award for Innovation will be presented at the 2014 Outstanding Projects and Leaders (OPAL) Gala on March 20, 2014, in Arlington, VA.
For additional information about the RABIT™ bridge deck assessment tool, contact Hamid Ghasemi at Hamid.Ghasemi@dot.gov.

Figure 4. Photo. The 2014 Charles Pankow Award for Innovation.
In March and April 2013, LTBP Program researchers collected data on the program’s first two cluster (group of similar bridge types) bridges, marking the start of the program’s long-term data collection phase. Located in New Jersey and Virginia, each bridge is a part of the Mid-Atlantic steel multigirder bridges with a cast-in-place (CIP) untreated deck cluster.
The first clusters are focused on a better understanding of the performance of concrete decks. Therefore the data collection process largely targeted deck elements. Data collection followed the LTBP protocols for detailed visual inspection and NDE to ensure data consistency. The detailed visual inspection utilized a tablet personal computer and inspection software to record defects to deck and superstructure elements. The NDE top-of-deck survey comprised a suite of complementary tools, including GPR, IE, half-cell, ER, and USW. NDE data was collected using traditional tools and by using the LTBP Program’s innovative RABIT™ bridge deck assessment tool for automated data collection.
The RABIT™ bridge inspection tool combines GPR, IE, ER, and USW tools and high-resolution imaging for mapping cracks onto a single, automated platform.
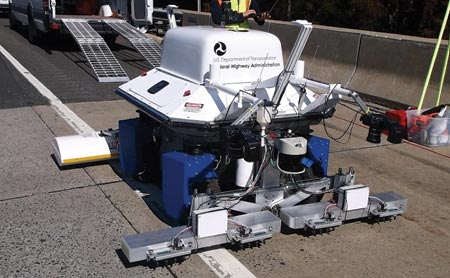
Figure 5. Photo. LTBP, RABIT™ bridge inspection tool, at the NJ Rt. 55 over Porchtown Road steel multigirder cluster bridge.
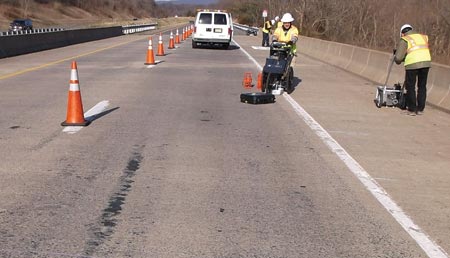
Figure 6. Photo. NDE survey on Virginia steel multigirder cluster bridge, Rt. 7 over South Fork of the Catoctin Creek.
Together, visual inspection and NDE data create a comprehensive snapshot of the current health of each bridge that will serve as a baseline for future testing throughout the long-term data collection phase.
LTBP researchers began the long-term data collection phase of the program in April 2013 and will continue testing 24 bridges over the next 9 months in the Mid-Atlantic region. In addition to the steel multigirder cluster, LTBP researchers also began assessing the condition of prestressed concrete multigirder bridges with CIP untreated decks during the summer of 2013.
Long-term monitoring of bridge conditions requires sampling and evaluation procedures that leave the structure intact and its condition unchanged after the testing. The tests must provide repeatable and consistent values from location to location and structure to structure. There are many different NDE technologies in use today for assessing the condition of in-service concrete. The LTBP Program currently uses several advanced technologies for condition assessment of in-service, CIP concrete bridge decks. This and future issues of the LTBP News will highlight the use of different NDE technologies for evaluation of concrete bridge decks. This article focuses on the use of the IE method.
IE is a stress wave propagation NDE method, which practitioners typically use to assess voids or cracks in concrete structures. In concept, a small impact device strikes the concrete surface, which induces a stress wave that travels through the concrete. Surface vibrations from the reflection are measured using frequency spectrum to provide information about the physical properties of the concrete.
Its simplest application, assessing a concrete slab, is shown in figure 7. The induced stress wave, caused by a hammer striking the slab, propagates through the slab and reflects off the opposite surface, causing measurable vibrations at the originating surface. These vibrations are measured over an extremely short time, and the resulting time history is converted to a frequency spectrum to identify the most dominant vibration frequency at the sampling location. The frequency of the vibration of the induced stress wave is proportional to the velocity of the stress wave and the thickness of the material (in this case, slab thickness). It is a relatively simple matter to determine the stress wave velocity using a known slab thickness and the measured dominant vibration frequency. Once the wave velocity is known, one can use IE to evaluate other locations within a concrete element. Four individual cases are shown in figure 1 through figure 4.
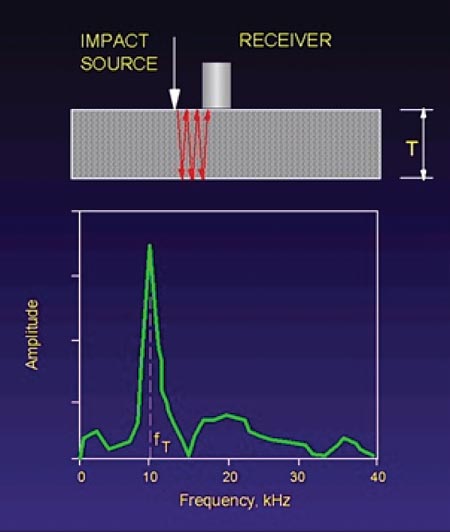
Figure 7. Photo. Case 1: Sound concrete.
There is no damage or internal voids, and the stress wave reverberates between the top and bottom surface of the slab.
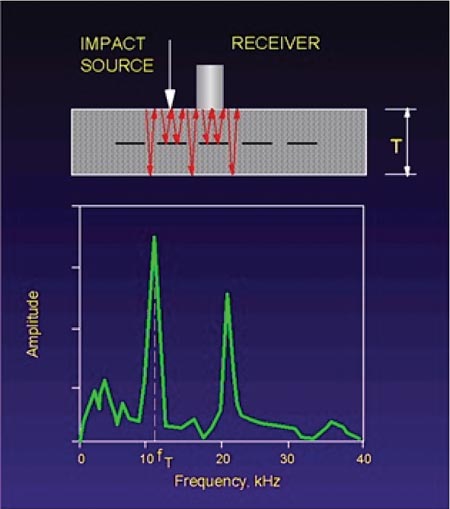
Figure 8. Photo. Case 2: Inception of delamination.
As a delamination begins to form under the concrete surface, perhaps as a result of reinforcement corrosion, a horizontal crack is initiated. The IE method can identify such an anomaly. The schematic of the reverberating stress wave indicates that some of the wave reverberates between the top and bottom of the slab, and some of the wave reverberates between the top of the slab and the crack. When evaluating the resulting vibrations in the frequency spectrum, it is evident there are now two distinct frequencies identified: one corresponding to the thickness of the slab, and one corresponding to the depth of the crack. However, the most dominant frequency is still associated with slab thickness.
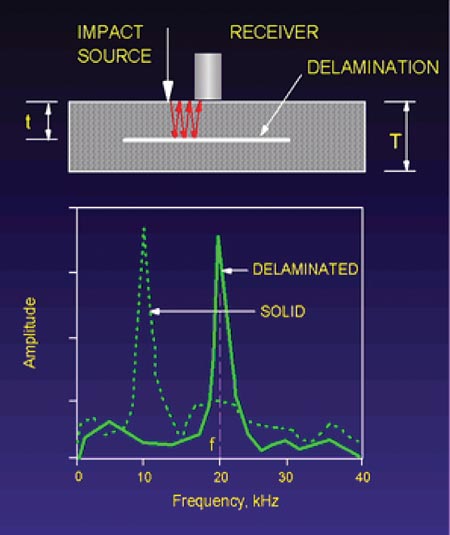
Figure 9. Photo. Case 3: Delamination continues to deteriorate.
As delamination progresses, more of the stress wave reflects off the crack formed at the level of the delamination, and less of the stress wave passes through the delamination. Conventional hammer sounding might be able to identify the delamination at this stage of deterioration. The most dominant (highest peak) frequency corresponds to the depth of the delamination. In addition, as the delamination progresses, other lower frequency peaks are also measured and become more dominant over time until the final stage (case 4).
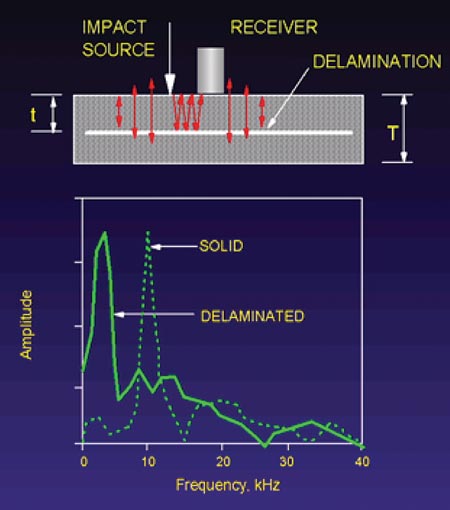
Figure 10. Photo. Case 4: Spalling of delamination.
The delamination has progressed so far that it can be detected audibly using conventional means, such as hammer sounding or chain dragging, and is on the verge of spalling. Typical IE measurements at this end stage of deterioration are dominated by a very different vibration response. The vibration in this case is similar to a flexing beam rather than the vibration of a solid. Measuring very low frequency response is indicative of a shallow delamination where the material is vibrating similarly to a very thin flat plate.
The IE method has proven to be a useful and accurate tool for assessing the condition of concrete in bridge decks for the LTBP Program. For more information on the use of IE by the LTBP Program, contact Robert Zobel at 202-493-3024 or by email at robert.zobel@dot.gov.
Seeks Additional Participation
The Nation’s highway network is experiencing increases in vehicular loads. As fuel prices and the pressure to move the Nation’s goods to market increase, motor carriers are searching for ways to maximize efficiency. Many State highway agencies report significant increases in the number of requests for load permits from carriers to carry overweight loads. At the same time, the bridge infrastructure continues to age and deteriorate, and there is growing pressure to manage limited financial resources as efficiently as possible to preserve the existing infrastructure. Figure 11 shows an example of a double tractor trailer on a bridge.
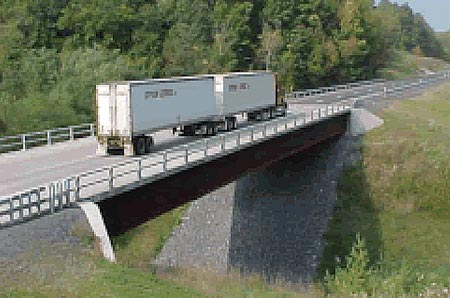
Source: Bala Sivakumar, HNTB Corporation.
Figure 11. Photo. A double tractor trailer on a bridge.
In the first edition of the Load and Resistance Factor (LRFD) Bridge Design, published in 1994, the American Association of State Highway and Transportation Officials (AASHTO) proposed specifications for a heavier load model to use when designing bridge components. These specifications were fully adopted in 2007. The vast majority of the Nation’s 600,000 highway bridges were designed using a load model with lower heavy vehicle traffic volumes and lighter loads than bridges experience today. Some State agencies have even reduced the weight limits on certain bridges for safety and to prevent further deterioration (figure 12).
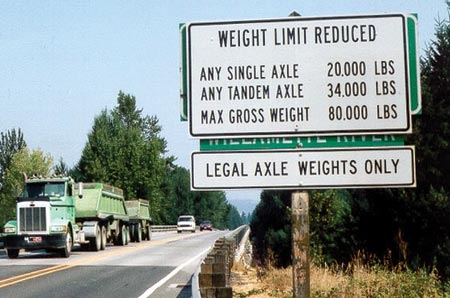
Source: Bala Sivakumar, HNTB Corporation.
Figure 12. Photo. State agencies reduce weight limits on certain bridges for safety and to prevent further deterioration.
Bridge owners have anecdotal evidence that certain bridge components such as decks, joints, and bearings deteriorate more rapidly in highway corridors carrying heavier loads, but they have little data. Additionally, there are no quantitative approaches that allow bridge owners to establish best practices to manage and operate existing bridges experiencing heavier loading. There is no method for differentiating between bridge component deterioration due to loading and other causes, such as environmental conditions, material properties, and maintenance practices.
FHWA is soliciting interest from States to join a pooled fund research study to examine the effects of loading conditions on bridge component deterioration. The study is part of the Transportation Pooled Fund Program, under solicitation number 1331, “The Effect of Truck Size, Weight, and Volume on Bridge Safety and Durability.” Additional information is available on the website: http://www.pooledfund.org/Details/Solicitation/1331. The goal of the study is to provide quantifiable data for making bridge management decisions about bridges experiencing heavier loads. The study will enable bridge owners to understand the effects of loading and better manage their bridge network.
The States of Minnesota, Georgia, Iowa, North Carolina, and Wisconsin have committed a total of $875,000 to support this research. With the FHWA’s commitment of $810,000, there is sufficient funding to initiate the pooled fund study. The solicitation will remain open to garner additional support from partners interested in participating in this unique and important research.
For more information about this study, contact Tom Saad, Structural Design Engineer, FHWA Resource Center, 708-283-3521, Thomas.Saad@dot.gov.