Appendix F. Analytical and Field Investigations
OUTLINE OF RESEARCH AREAS
Development of recommended design approaches for mitigation measures has focused on the following:
- Addition of linear and nonlinear dampers.
- Response a taut cable with an attached linear damper.
- Response of a taut cable with an attached linear damper with a friction threshold.
- Response of a taut cable with an attached nonlinear damper (exponent other than one as in the case of a linear damper).
- Crosstying of stay cables.
- Response assessment of crosstied stays with rigid and spring connectors.
- Dampers in combination with crossties.
- Field assessment of damper and crosstie performance, focusing on the systems installed on the Fred Hartman Bridge.
- Performance of linear dampers.
- Performance of crossties.
- Detailed study of damper performance.
Addition of Linear and Nonlinear Dampers
Stay cables have very low levels of inherent mechanical damping, rendering them susceptible to multiple types of excitation.(30) To suppress the problematic vibrations, dampers are often attached to the stays near the anchorages. Although the mechanisms that induce the observed vibrations are still not fully understood, the effectiveness of attached dampers has been demonstrated. The potential for widespread application of dampers for cable vibration suppression necessitates a thorough understanding of the resulting dynamic system.
Response of a Taut Cable with an Attached Linear Damper
Background
Carne and Kovacs were among the first to investigate the vibrations of a taut cable with an attached damper, both focusing on determination of first-mode damping ratios for damper locations near the end of the cable.(31,32) Carne developed an approximate analytical solution, obtaining a transcendental equation for the complex eigenvalues and an accurate approximation for the first-mode damping ratio as a function of the damper coefficient and location, while Kovacs developed approximations for the maximum attainable damping ratio (in agreement with Carne) and the corresponding optimal damper coefficient (about 60 percent in excess of Carne’s accurate result). Subsequent investigators formulated the free-vibration problem using Galerkin’s method, with the sinusoidal mode shapes of an undamped cable as basis functions, and several hundred terms were required for adequate convergence in the solution, creating a computational burden.(33) Several investigators have worked to develop modal damping estimation curves of general applicability, and Pacheco et al. introduced nondimensional parameters to develop a "universal estimation curve" of normalized modal damping ratio versus normalized damper coefficient, which is useful and applicable in many practical design situations.(33,34) To consider the influence of cable sag and inclination on attainable damping ratios, Xu et al. developed an efficient and accurate transfer matrix formulation using complex eigenfunctions.(35) Recently, Krenk developed an exact analytical solution of the free-vibration problem for a taut cable and obtained an asymptotic approximation for the damping ratios in the first few modes for damper locations near the end of the cable.(36) Krenk also developed an efficient iterative method for accurate determination of modal damping ratios outside the range of applicability of the asymptotic approximation.
Previous investigations have focused on vibrations in the first few modes for damper locations near the end of the cable, and while practical constraints usually limit the damper attachment location, it is important to understand both the range of applicability of previous observations and the behavior that may be expected outside of this range. Damper performance in the higher modes is of particular interest, as full-scale measurements indicate that vibrations of moderate amplitude can occur over a wide range of cable modes. The approach here uses an analytical formulation of the free-vibration problem to investigate the dynamics of the cable-damper system in higher modes and without restriction on the damper location. The basic problem formulation in this paper follows quite closely the approach used by Krenk, although it was developed independently as an extension of the transfer matrix technique developed by Sergev and Iwan and Iwan and Jones to calculate the natural frequencies and mode shapes of a taut cable with attached springs and masses.(36,37,38) A similar approach was used by Rayleigh to consider the vibrations of a taut string with an attached mass.(39) Using this formulation, the important role of damper-induced frequency shifts in characterizing the system is observed and emphasized. Consideration of the nature of these frequency shifts affords additional insight into the dynamics of the system, and when the shifts are large, complicated new regimes of behavior are observed.
The influences of sag and bending stiffness are neglected in this section because the linear taut string approximation is considered applicable to many real stay cables, and the simplifications introduced by these approximations allow for a more efficient formulation of the problem and a more detailed investigation of the dynamics of the system. It has been shown that moderate amounts of sag can significantly reduce the first-mode damping ratio, while the damping ratios in the higher modes are virtually unaffected.(33,35) However, using a database of stay cable properties from real bridges, Tabatabai and Mehrabi found that for most stays the influence of sag is insignificant even in the first mode, while the influence of bending stiffness could be significant for many stays, especially for damper locations near the end of the cable.(40) This is investigated more fully in the following section.
Theory
Only the basic aspects of the theory are summarized here. The reader is referred to the full publication by Main and Jones for more details.(41)
In designing a damper for cable vibration suppression, it is necessary to determine the levels of supplemental damping provided in the first several modes of vibration for different values of the damper coefficient and different damper locations. Due in part to the multiple excitation mechanisms causing stay cable oscillation, it is also important to consider the damping performance in higher modes. In the case of taut cable with a linear viscous damper (figure 104), the supplemental damping ratios can be determined from a complex eigenvalue analysis of the damped cable in free vibration.
Figure 104. Chart. Taut cable with a linear damper.
The solution of the governing partial differential equation over the two cable segments on each side of the damper using separation of variables leads to the following expressions (equations 41 and 42) for the cable displacement:
| where: |
| τ | = a nondimensional time τ=ωo1t |
| ωo1 | = the undamped fundamental natural frequency of the cableωo1= (π/L) √T/ m , and |
| λ | = the nondimensional eigenvalue, which is complex in general, and for small damping is "mostly" imaginary. |
Equilibrium of forces at the damper location can be written as equation 43:
Substituting the solution from equations 41 and 42 into the equilibrium equation 43 leads to the following transcendental equation (equation 44) for the nondimensional eigenvalue λ:
Equation 22 can be solved numerically for the complex eigenvalues to obtain the modal damping ratios in as many modes as desired to an arbitrary degree of accuracy. The damping ratio in the ith mode can be readily obtained from equation 45:
| where: |
| σi | = Re(λi ) and |
| φi | = Im(λi ) |
Note that φi is the nondimensional frequency of damped oscillation in mode i. Previous numerical investigations revealed nondimensional groupings of parameters allowing the results of the eigenvalue analysis to be presented as a very useful "universal estimation curve" of normalized modal damping ratio versus normalized damper coefficient, which is applicable in the first few modes for dampers located near the end of the cable and allows easy determination of optimal design values.(33) Krenk demonstrated that an explicit analytical equation for this universal curve could be obtained from the transcendental eigenvalue equation using asymptotic approximations.(36) The resulting approximate expression is a generalization to higher modes of the approximation previously obtained by Carne for the damping ratio in the fundamental mode.(31)
For damper locations resulting in small frequency shifts (e.g., dampers near the end of the stay), the expression can be written as equation 46:
where κ is a nondimensional parameter grouping defined as shown in equation 47:
Equation 46 gives the damping attainable in a particular mode of vibration i as a function of the damper coefficient c, mass per unit length m, cable length L, and fundamental circular frequency ωo1 as well as normalized damper location l1/L.
Results
In figure 105, the normalized damping ratio ζ/(l1/L) has been plotted against the nondimensional damping parameter, κ, for the first five modes for a damper location of l1/L = 0.02, and it is evident that the five curves collapse very nearly onto a single curve in good agreement with the approximation of equation 46. It is important to note that because the mode number is incorporated in the nondimensional damping parameter κ, the optimal damping ratio can be achieved in only one mode of vibration in the case of a linear damper. This is a potential limitation because it is currently unclear how to specify, a priori, the mode in which optimal performance should be achieved for effective suppression of stay cable vibration, and designing a damper for optimal performance in a particular mode may potentially leave the cable susceptible to vibrations in other modes.
Figure 105. Graph. Normalized damping ratio versus normalized damper coefficient.
Summary
Free vibrations of a taut cable with an attached linear viscous damper were investigated in detail. An analytical formulation of the complex eigenvalue problem was used to derive an equation for the eigenvalues that is independent of the damper coefficient. This "phase equation" reveals the attainable modal damping ratios ζi and corresponding oscillation frequencies for a given damper location l1/L, affording an improved understanding of the solution characteristics and revealing the important role of damper-induced frequency shifts in characterizing the response of the system.
When the damper-induced frequency shifts are small, an asymptotic approximate solution has been developed, relating the damping ratio ζi in each mode to the nondimensional damper coefficient, κ.
When the damper is far from the end of the stay, different regimes of behavior can be observed, potentially significantly altering the performance of the damper. For such situations, refer to Main and Jones.(41)
Response of a Taut Cable with an Attached Linear Damper with a Friction Threshold
This section presents an analytical investigation of the influence of a friction threshold on damper performance for stay cable vibration suppression. An asymptotic solution for the modal damping ratios is presented for a taut cable with a linear viscous damper, based on previous investigations, and an "equivalent viscous damper" formulation is used to extend these results to a viscous damper with a friction threshold. The relevant nondimensional parameter groupings are identified: a viscous damper parameter κ and a friction parameter µ. The approximate solution is appropriate only for relatively small values of the friction parameter µ, for which the assumption of nearly sinusoidal motion is valid. It is observed that the influence of friction is to reduce the optimal value of the viscous damper parameter κ, and for sufficiently large values of µ, to reduce the attainable damping ratios as well.
Ongoing measurements of damper forces, both in the field and in the laboratory, seem to indicate that the dampers possess a friction threshold that is quite large relative to the force levels engaged by wind-induced oscillations of the stays. When the forces in a damper are below this friction threshold, the damper simply locks the cable at the attachment point, shifting the oscillation frequencies without providing any supplemental damping.
Motivated by the potentially large magnitude of the damper friction threshold and the apparent significance of its effect in the measured data, this section presents an analytical investigation of the influence of a friction threshold on damper performance. Carne and Kovacs et al. previously developed approximate solutions for the damping ratios in the case of a purely frictional damper using equivalent viscous solutions, and a similar approach is taken here.(31,42) Asymptotic approximate solutions for the damping ratios in the case of a taut cable with a linear viscous damper are summarized from the results of investigations reported above. An equivalent viscous damping formulation is then developed to extend the results for a linear viscous damper to a viscous damper with a friction threshold. The relevant nondimensional parameter groupings are identified, and the solution characteristics are explored.
Problem Formulation
The problem under consideration is the vibration of a taut cable with an attached viscous damper having a friction threshold, depicted in figure 106. The nonlinear force-velocity relationship for the damper with a friction threshold is modeled by the following equation:
where v is the velocity of the cable at the damper attachment point. The resulting force-velocity curve is depicted in figure 107.
Figure 106. Chart. Cable with attached friction/viscous damper.
Figure 107. Chart. Force-velocity curve for friction/viscous damper.
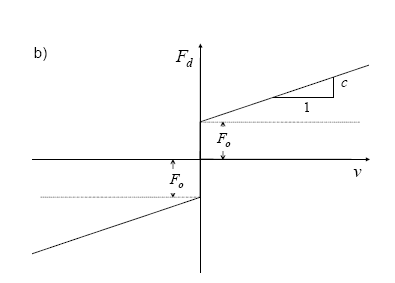 In the case of a purely viscous damper (Fo = 0), an exact solution to the free-vibration problem has been obtained which yields a transcendental equation for the complex eigenvalues and an explicit asymptotic solution for the modal damping ratios in the first few modes for damper locations near the end of the cable (l1 << l2).(36,41) This solution has also been extended to develop an approximate solution for the effective damping ratios for a nonlinear power law damper.(43) The asymptotic solution for the linear viscous damper is extended here to the friction/viscous damper by computing an equivalent viscous damper coefficient, ceq, using an equivalent energy dissipation criterion. This equivalent viscous solution is less appropriate when the forces in the damper are below the friction threshold for a significant portion of the oscillation cycle; in such cases, the damper is locked for much of the cycle so that the motion at the damper is far from sinusoidal, and the spatial form of the solution also differs significantly from the solution for the linear viscous damper. Further work is necessary to better model this frictional "sticking" to develop more accurate solutions in cases for which this effect is significant.
Asymptotic Solution for Taut Cable with Linear Viscous Damper
In the case of a taut cable with a linear viscous damper, when the damper-induced frequency shifts are small, as is the case for vibrations in the first few modes when l1<<l2, an asymptotic approximation can be obtained relating the damping ratio in the ith mode to the "clamping ratio," a normalized measure of the damper-induced frequency shift in that mode (equation 49):(41)
The "clamping ratio" Θci is defined as shown in equation 50:
where φi is the nondimensional frequency of oscillation in the ith mode (the dimensional frequency is given by ωo1φi , where ωo1 is the undamped fundamental frequency of the cable: ωo1 = (π/ L) √T /m ). The term Δφi = i(l1/l2), in the denominator of equation 50, is the difference between the "clamped" frequency φci = i(L/l2), associated with a rigid damper(c → ∞), and the undamped frequency φoi = i, associated with c → 0. Consequently, Θci → 0 as c → 0, and Θci → 1 as c → ∞. Equation 49 is independent of the mode number, indicating a maximum damping ratio of ζi = (1/2)(l1/L) in each mode, corresponding to an optimal clamping ratio of Θci = 1/2. Physically, this means that the optimal damping performance in a given mode is achieved when the damper has shifted the frequency of oscillation in that mode to a value halfway between the undamped frequency and the clamped frequency. Equation 49 also indicates that the damping ratio in a given mode approaches zero as the clamping ratio approaches unity and the damper effectively locks the cable at the damper location.
Figure 108 shows a plot of equation 49 along with curves corresponding to the exact solution in each of the first five modes for a damper location of l1/L = 0.02, and for this damper location the exact solutions agree quite well with the approximation of equation 49. An additional asymptotic approximation can be obtained relating the clamping ratio to the viscous damper coefficient(equation 51):
where κ is a normalized viscous damper coefficient previously defined in equation 47 as:
Figure 109 shows a plot of equation 51 along with curves corresponding to the exact solution in each of the first five modes for a damper location of l1/L = 0.02, and for this damper location the exact solutions agree quite well with the approximation of equation 51. An asymptotic approximation can also be obtained relating the amplitude at the damper attachment point γ to the peak modal amplitude A:
Figure 108. Graph. Normalized damping ratio versus clamping ratio.
Figure 109. Graph. Normalized viscous damper coefficient versus clamping ratio.
Equations 49, 50, and 51 will prove useful in extending the solution for a taut cable with a viscous damper to develop an approximate solution for the friction/viscous damper.
Equivalent Viscous Damper Formulation
At a given amplitude and frequency of oscillation, a nonlinear damper can be approximated by an equivalent linear viscous damper which dissipates the same amount of energy in one cycle of oscillation. If the cable can be assumed to be oscillating nearly sinusoidally at a frequency ω with an amplitude γ at the damper attachment point, the velocity of the cable at the damper attachment point can be expressed as shown in equation 53:
The work done by the damper in one cycle of oscillation can then be expressed as shown in equation 54:
Substituting Fd =ceq ·v into equation 54, substituting equation 53 for v, and performing the integration yields the following expression (equation 55) for the work done by the equivalent viscous damper in one cycle of oscillation:
The value of the equivalent viscous damper coefficient ceq for a nonlinear damper can then be obtained by equating the work done by the nonlinear damper in one cycle of oscillation to the expression in equation 55 and solving for ceq, which yields equation 56:
where ΔWd , computed from equation 54, is the work done by the nonlinear damper in one cycle of oscillation at a given amplitude and frequency. Substituting the force-velocity relation for the friction/viscous damper in equation 48 and the velocity in equation 53 into equation 54 yields the following expression (equation 57) for the work done in one cycle for the friction/viscous damper:
Substituting this value into equation 56 yields the following expression (equation 58) for the equivalent linear damper coefficient:
When the damper-induced frequency shifts are small, the frequency of oscillation in a given mode i is close to the undamped frequency: ω iωo1= i(π/L)√T/m. Substituting this approximation into equation 58 along with the previously developed approximation for the amplitude at the damper (equation 53) and normalizing by √T/m yields the following nondimensional expression (equation 59) for the equivalent viscous damper coefficient: iωo1= i(π/L)√T/m. Substituting this approximation into equation 58 along with the previously developed approximation for the amplitude at the damper (equation 53) and normalizing by √T/m yields the following nondimensional expression (equation 59) for the equivalent viscous damper coefficient:
The asymptotic relation between the damper coefficient and the clamping ratio for a linear damper (equation 51) can be generalized to a nonlinear damper by substituting ceq for c in the definition of κ in equation 47 to yield equation 60:
Substituting the expression for the equivalent damper coefficient (equation 59) into equation 60 then yields, after some simplification, the following relation between the clamping ratio Θci and two nondimensional parameters, shown in equation 61:
where µ is a nondimensional friction parameter shown in equation 62:
and κ is the normalized viscous damping parameter as defined previously in equation 47.
Solution Characteristics
For a given value of the clamping ratio Θci, equation 61 indicates a linear relationship between µ and κ. Figure 110 shows a plot of µ versus κ for several different values of Θci.
Figure 110. Graph. Relationship between nondimensional parameters µ and κ with different values of the clamping ratio Θci for a friction/viscous damper.
When Θci = 1 , corresponding to the "clamped" limit in which the cable is completely restrained at the damper location, equation 42 reduces to:
When µ ≥ µc, corresponding to a relatively large friction force and/or small amplitude, the damper is completely locked and provides no energy dissipation. The condition at which the damper is completely locked by friction can also be computed directly by considering equilibrium of forces at the damper location, and this approach gives a value of µc = π, which differs significantly from the value obtained in equation 63 from the equivalent viscous damper formulation. This discrepancy arises because, as discussed previously, when the damper approaches the limit of being completely locked by friction, the damper is "stuck" for a significant portion of the oscillation cycle, causing the motion at the damper to be far from sinusoidal, and the equivalent viscous damper approximation developed here is inappropriate. Consequently, the solution developed here should only be considered accurate for relatively small values of the friction
parameter µ, corresponding to low values of the friction threshold or large amplitudes. Preliminary efforts to model the frictional "sticking" indicate that the equivalent viscous solution gives fairly accurate results for µ < 0.5, while the discrepancies can be significant for larger values of µ.
When Θci = 0.5 , corresponding to optimal damping, equation 61 reduces to equation 64:
 | (64) |
Equation 64 is the equation of the line in figure 110 labeled Θci = 0.5, and it specifies the combinations of µ and κ for which optimal damping is obtained. Equation 49 can be used in conjunction with equation 61 to generate curves of normalized modal damping ratio versus κ for different values of µ, as depicted in figure 111.
Figure 111. Graphic. Normalized damping ratio versus κ with varying µ.
The curve labeled µ = 0 corresponds to the asymptotic solution for the linear viscous damper, for which the optimal value κopt = 1/π2  0.101 can be obtained from equation 64 by setting µ = 0. The effect of increasing friction is to shift the optimal portion of the curve to the left. When µ exceeds a critical value, optimal damping can no longer be achieved. This critical value can be obtained from 64 by setting ? = 0, and is given by µ =π2√2/8 0.101 can be obtained from equation 64 by setting µ = 0. The effect of increasing friction is to shift the optimal portion of the curve to the left. When µ exceeds a critical value, optimal damping can no longer be achieved. This critical value can be obtained from 64 by setting ? = 0, and is given by µ =π2√2/8  1.75. 1.75.
Summary
An asymptotic solution for the damping ratios in the case of a taut cable with a linear viscous damper was extended to the nonlinear case of a viscous damper with a friction threshold using an "equivalent viscous damper" formulation. Relevant nondimensional parameter groupings were identified, and the solution characteristics were explored. It is observed that this formulation does a poor job of estimating the amplitude at which the damper is completely locked because of friction, and the results of this analysis should only be considered accurate for relatively small values of the friction parameter µ, for which the assumption of nearly sinusoidal oscillation is appropriate. The observed effect of the friction threshold is to reduce the optimal value of the viscous damping parameter κ and ultimately to reduce the attainable damping ratios from the values for a purely viscous damper.
Response of a Taut Cable with an Attached Nonlinear Damper (Exponent other than 1)
Recent investigations indicated that a nonlinear damper may potentially overcome the limitation in performance of a linear damper whereby optimal damping performance can only be achieved in one mode of vibration. Kovacs et al. recently reported on the implementation of a friction damper on the Sunningesund Bridge.(42) The exact formulation of the free-vibration problem for a taut cable with a linear damper can be extended to develop an approximate analytical solution for the amplitude-dependent effective damping ratios in the case of a nonlinear damper, for which the damper provides a dissipative force proportional to the cable velocity at the damper attachment point raised to an arbitrary positive exponent, β. The formulation is extended by assuming a single-mode response, assuming the solution has the same form as in the linear case(equations 65 and 66), and minimizing the error in the equilibrium equation over a half-cycle of oscillation. Asymptotic approximations then yield the following
expressions:
where:
where Aτ is approximately the peak modal amplitude of oscillation, is the clamping ratio(equation 50 f(β) and g(β) are given by equations 67 and 68:
The new definition of the nondimensional damping parameter, κ, in equation 67 reduces to equation 47 in the case of a linear damper (β = 1). Equation 47 can then be written, eliminating the clamping ratio, to obtain an implicit asymptotic approximate expression relating the normalized damping ratio to the nondimensional damping parameter κ, which may be regarded as a generalization of the universal estimation curve of Pacheco et al. to the case of a nonlinear damper.(33) The shape of the curve is slightly different for each value of damping exponent, β, but for a given damping exponent the curve is nearly invariant with damper location and mode number over the same range of parameters as the universal estimation curve for the linear case. Figure 112 shows a plot of normalized damping ratio versus κ in the first five modes for a square-root damper.
Figure 112. Graph. Normalized damping ratio versus normalized damper coefficient (β = 0.5).
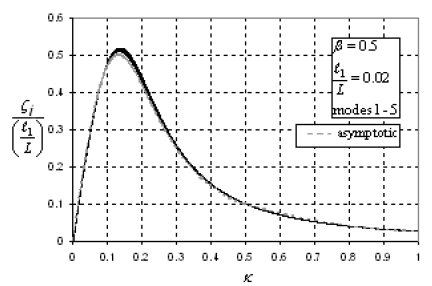 Because the nondimensional damping parameter κ depends on both the amplitude and mode number of oscillation, the optimal damping performance will be achieved, in general, at different amplitudes of vibration in each mode. An "optimal" value for the damper coefficient can be determined by specifying a design amplitude of oscillation in a given mode at which the optimal performance is desired. This amplitude at which the maximum effective damping ratio is to be achieved will be denoted Aopt, and the corresponding mode number will be denoted iopt. The notion of specifying a design-level oscillation amplitude is familiar to designers, as even in the case of a linear damper an amplitude of oscillation must be specified to determine the stroke and energy dissipation requirements for a linear damper. The value of the damper coefficient necessary to achieve the specified performance is then given by equation 69:
With the damper coefficient designed according to equation 69, the following asymptotic expression (equation 70) can be obtained relating the amplitude and mode number of oscillation to the clamping ratio:
Equation 70 may then be used to characterize the amplitude-dependence and mode-dependence of damper performance. In the case of a linear damper (β = 1), the amplitude-dependence in equation 70 vanishes, as expected, and the normalized damping ratio can be plotted directly against the mode number ratio i/iopt, as shown in figure 113. Interestingly, in the case of a squareroot damper (β = 1/2), the mode dependence in equation 70 disappears, and the damping performance depends only on the amplitude of vibration. Figure 114 shows the effective damping ratio plotted against amplitude ratio, Aτ/Aopt, for the square-root damper. Because this curve is independent of mode number, in designing a square-root damper it is sufficient to specify only the amplitude, Aopt, and the optimal damping performance is achieved at the same amplitude in each mode. This special mode independence of the square root damper
suggests that it may offer some advantages over a linear damper. When β = 0 (a friction damper), the amplitude and the mode number in equation 70 are raised to the same power, and the effective damping ratio is a function of the product (Aτi). Consequently, the optimal amplitude is inversely proportional to the mode number, and the optimal performance is achieved at lower amplitudes in higher modes. In designing a friction damper, it is sufficient to specify the value of the product, (Aτi)|opt, at which optimal damping performance is desired, rather than specifying Aopt and iopt independently. Figure 115 shows the effective damping ratio versus (Aτi)/(Aτi)|opt for the friction damper. It is evident that there is a critical amplitude for the friction damper, below which no energy is dissipated by the damper. Comparing figures 114and 115, the performance of the square-root damper can be argued to be more "robust" with amplitude than that of the friction damper because the damping performance degrades more quickly away from the optimal amplitude in the case of the friction damper.
Figure 113. Graph. Normalized damping ratio versus mode ratio (β = 1).
Figure 114. Graph. Normalized damping ratio versus amplitude ratio (β = 0.5).
Figure 115. Graph. Normalized damping ratio versus mode-amplitude ratio (β = 0).
Summary
The dynamic behavior of a taut cable with a passive, nonlinear, power law damper attached at an intermediate point was investigated. The exact formulation of the complex eigenvalue problem for a taut cable with a linear damper was extended to develop a single-mode approximation for the amplitude-dependent effective damping ratios for the power law damper by minimizing the mean square of the error in the force equilibrium equation at the damper over one half-cycle of oscillation. This formulation yielded the same "phase equation" that held in the case of a linear damper, giving the range of attainable damping ratios and corresponding oscillation frequencies in every mode. An asymptotic approximate solution revealed a nondimensional grouping of parameters that was used to extend the universal estimation curve for the linear damper to the case of a nonlinear damper. The shape of the resulting curve was slightly different for each value of damping exponent, β, but for a given damping exponent the curve was nearly invariant with damper location and mode number over the same range of parameters as the universal estimation curve for the linear case. The dependence of nonlinear damper performance on the amplitude and mode number of oscillation was investigated, and it was observed that a nonlinear damper could potentially allow optimal damping performance to be achieved over a wider range of modes than in the linear case. In the special case of β = 0.5 (a square-root damper), it was observed that the damping performance is independent of mode number, so that the optimal damping ratio can be achieved in each mode at the same amplitude of oscillation. These features suggest that nonlinear dampers may offer some advantages over linear dampers for cable vibration suppression, while retaining the advantages of economy and reliability offered by a passive mitigation strategy.
CROSSTYING OF STAY CABLES
One of the methods that is sometimes adopted to counteract the undesired oscillations is to increase the in-plane stiffness of stays by connecting them together by means of a set of transverse cables, defined as crossties (or "aiguilles"). According to Gimsing, these cables are also used to reduce the cable sag variations among the stays of different length, ensuring a more uniform axial stiffness on the consecutive stays.(44) From the dynamic perspective, the properties of the single cable, considered as a separate element, are modified by the presence of the lateral constraints that influence its oscillation characteristics. Similarly, a connection of simple suspended elements is transformed into a more complex cable network; a closed-form solution to the dynamic problem is more elusive.
The literature contains examples of performance improvement for a vibrating cable; for example, the widely studied case of adding a transverse damper. However, it is evident that detailed studies of crossties and interconnected cable systems are not well reported and most of the recommendations that are currently followed seem to be linked to practice or previous experience. A fundamental study to support these problems seemed therefore necessary. It is worth mentioning that a cable network can be a very complex system and finite element analysis has been preferred in the past. An example was given by Ehsan and Scanlan, who used component-mode synthesis and finite element approaches for the solution of a three-dimensional cable problem.(45) Reviews of cable vibration that address the most commonly used techniques for reducing motion amplitudes also identified this problem as one that still needs to be investigated.(46)
Experience gained in the field of transverse restrainers was analyzed by Virlogeux, who pointed out recent failures or unexpected behavior of the crossties (Pont de Normandie, Foro Bridge in Denmark).(47) He addressed the issues of transverse cable stiffness, tension and internal damping. He also suggested that simplified approaches (equivalent static analyses) can be sometimes efficient in terms of design recommendations.
Yamaguchi and Nagahawatta and Yamaguchi and Jayawardena analyzed the problem through a set of experiments conducted on a model of two interconnected cables, and a subsequent finite element simulation of the configuration.(25,48) An energy approach for the determination of the damping contribution linked to the complex network was used. Among their comments it is interesting to emphasize that the contribution to damping due to crossties can be negative or positive, depending on the chosen system and cable characteristics, and that not only the overall stiffer configuration must be considered but also the possibility of exploiting the energy dissipation potential of the restrainers.
Several examples of vibration analysis of cable nets were found in the literature, even though most of them are related to high-tension systems, in which the excitation force is mainly orthogonal to the net configuration (i.e., membrane behavior—for example, Zingoni).(49) In most cases a finite element analysis was performed. An interesting approach for the out-of-plane vibration analysis of a nonlinear cable system was applied by Mesarovic and Gasparini to the study of a complex truss.(50)
The novel contribution here is the development of an analytical method and efficient numerical procedure that models the behavior of a set of interconnected cables. Observations of the behavior of these crosstied systems were investigated through the detailed study of specific examples. This approach offers a number of advantages over the finite element method and provides a tool that is useful in the design and optimization of such systems for practical application.
Response Assessment of Crosstied Stays with Rigid and Spring Connectors
Basic Theory
The initial problem formulation is depicted in figure 116. The example shows a simplified network, defined by a set of two taut cables, connected by means of a vertical rigid rod (to be relaxed later). The generic jth cable is divided into m segments, each of which is labeled as p (the generic element is denoted by j,p). The jth cable is restrained at both ends; it is characterized by a length Lj (with L1 > L2 in this case), tension Hj, and mass per unit length µj. The horizontal offset between the two cables has been denoted by l1 and the position of the vertical connection, with respect to the right-hand side of cable 2 has been assumed equal to l2 (segment 2,1). The quantity l* = l1 + l2 represents the same dimension in the coordinate system of the upper cable. The xjp along axis coordinate of the pth segment of the jth cable has been taken in accordance with figure 116. Vertical displacements are considered positive downwards. The position of the vertical connector relative to the cable is general, and the only additional physical constraints are expressed by L2 ≤ L1;l2 ≤ L2 ; l1 + L2 ≤ L1
Figure 116. Chart. General problem formulation.
The free-vibration problem for this case is concerned with the solution of a system of four partial differential equations, corresponding to the four cable branches yjp(xjp,t), with j = 1,2 and p = 1,2, where t denotes the time variable (equation 71):
where j = 1...n number of cables and p = 1...m number of segments, for each cable. This system requires eight boundary, compatibility and equilibrium conditions, which can be expressed in terms of: (a) displacements at cable ends; (b) displacement continuity at point P1 between branches 1,1 and 1,2, and at P2 for segments 2,1 and 2,2; (c) equality of displacement at each time instant at P1 and P2 between the two cables; and (d) force equilibrium at the vertical rod. These can be written as equations 72, 73, 74, and 75:
A purely oscillatory motion of each cable element can be developed using the classical solution in which time-dependent and spatial-coordinate effects can be separated as yjp(xjp,t) = Yjp(xjp)eiωt, where ω is the natural circular frequency of vibration of the coupled network (unknown). Equation 71 can be therefore reduced to a system of ordinary equations, as shown in equation 76:
From equation 76 and the conditions in equation 72, the solution can be proposed of the form shown in equations 77 and 78:
In equations 77 and 78, the upper cable is considered as reference element; α represents the reduced frequency of the system, and f is a parameter that takes into account geometrical and stiffness differences of cable 2 with respect to 1, defined as scaled frequency ratio. From equation 76, such quantities can be redefined according to equation 79:
In these equations, ω01 and ω02 are the fundamental circular frequencies of the unconnected cables. Equations 77 and 78 generally satisfy the requirements of the system given by equation 76. The unknown parameters Ajp, representing the four modal amplitudes of each pth segment, must be solved from the four boundary conditions (equations 73 through 75). In this way, the solution to the free-oscillation problem and the determination of the natural frequencies in terms of α can be transformed into a system of four algebraic equations, linked to equations 73 through 75 in a matrix form, as shown in equations 80 through 82:
where all quantities have been reduced into the following dimensionless parameters:h = H1/H2; ξ1=l*/L1;ξ2 = l1/L1;Δξ = l2/L1 = (ξ1 - ξ2). The infinite set of nontrivial solutions (A ≠ 0 ) to the homogeneous system (6a) can be identified through the condition det[S] = 0. This condition is given by the roots of the following polynomial p(α) (equation 83):
Equation 83 represents the frequency equation that relates the general solution to a specific value of the system reduced frequency α, for which the modal amplitudes of the rth segment can be obtained through the linearly independent equations 80, 81, and 82. The roots of equation 83 cannot be found analytically in closed form for the general case, since little further simplification is possible; a numerical technique can be adopted in this general case.
Generalization
The above approach can be generalized to a system of multiple cables and crossties. Readers are referred to the complete paper for details of this development, which will not be repeated here for brevity. This more general approach of necessity must be implemented and solved numerically.
Results
The free-vibration analysis method presented above was applied to the study of a cable network that was modeled after the Fred Hartman Bridge, a twin-deck, cable-stayed bridge over the Houston Ship Channel, with a central span of 380 m (1,246 ft) and side spans of 147 m (482 ft). The deck is composed of precast concrete slabs on steel girders with four lanes of traffic, carried by a total of 192 cables in four inclined planes, connected at 15-m (49-ft) intervals.M
The investigated system corresponds to the south-tower central-span portion, a set of 12 stays with a three-dimensional arrangement (figure 117); the geometric and structural characteristics are summarized in table 15. Stay 24S is assumed as reference element; all other stay quantities are normalized with respect to this element.
Figure 117. Chart. General problem formulation (original configuration).
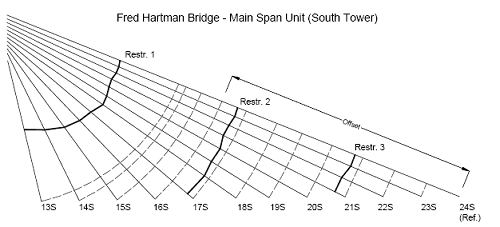
Table 15. Geometrical and structural characteristics of the Fred Hartman system.
| Stay | mass (lb/ft.) | mass (kg/m) | T(kips) | T(N) | L(m) | Lred (-) | ω (rad/s) | freq (l/s) | f (-) | v (-) |
|---|
| 13S |
21.84 | 32.50 | 371 | 1.65E+06 | 59.523 | 0.3009 | 11.895 | 1.893 | 0.3258 | 0.3947 |
| 14S |
32.21 | 47.93 | 359 | 1.60E+06 | 67.345 | 0.3404 | 8.516 | 1.355 | 0.4551 | 0.4715 |
| 15S |
32.21 | 47.93 | 427 | 1.90E+06 | 76.549 | 0.3869 | 8.171 | 1.300 | 0.4744 | 0.5142 |
| 16S |
32.21 | 47.93 | 485 | 2.16E+06 | 87.333 | 0.4414 | 7.633 | 1.215 | 0.5078 | 0.5481 |
| 17S |
35.53 | 52.87 | 538 | 2.39E+06 | 99.377 | 0.5023 | 6.727 | 1.071 | 0.5762 | 0.6062 |
| 18S |
35.53 | 52.87 | 614 | 2.73E+06 | 112.280 | 0.5675 | 6.360 | 1.012 | 0.6094 | 0.6476 |
| 19S |
43.81 | 65.20 | 720 | 3.20E+06 | 125.779 | 0.6357 | 5.537 | 0.881 | 0.7000 | 0.7788 |
| 20S |
47.12 | 70.12 | 753 | 3.35E+06 | 139.701 | 0.7061 | 4.916 | 0.782 | 0.7885 | 0.8260 |
| 21S |
47.12 | 70.12 | 861 | 3.83E+06 | 154.076 | 0.7788 | 4.766 | 0.759 | 0.8132 | 0.8832 |
| 22S |
47.12 | 70.12 | 797 | 3.55E+06 | 168.403 | 0.8512 | 4.195 | 0.668 | 0.9238 | 0.8497 |
| 23S |
51.09 | 76.03 | 963 | 4.29E+06 | 183.056 | 0.9252 | 4.074 | 0.648 | 0.9513 | 0.9726 |
| 24S |
51.09 | 76.03 | 1018 | 4.53E+06 | 197.847 | 1.0000 | 3.876 | 0.617 | 1.0000 | 1.0000 |
The transverse connectors, an "eight-loop" steel wire rope system, are located in accordance with the existing system (figure 117). The characteristics of these elements are provided in table 15. The three-dimensional cable network was reduced to an equivalent two-dimensional problem. As a result of this transformation to equivalent 2D problem, the overall pattern of the model is slightly irregular since the lengths of each cable segment were selected at symmetric locations with respect to each stay but not to the global network.
The definitions of the modal frequencies and mode shapes of the network (free-vibration analysis) were performed through the study of the roots of the determinant of the system matrix as a function of the reduced frequency of the structure α, det[S(α)] and d/dα{det[ S(α)]}; in this case f01 = 0.617 Hz.
A careful study of the solution patterns showed two categories of roots. The first are associated with global modes, in which the whole set of cables is involved in the oscillation and with a substantial increment in the generalized mass of the mode with respect to the individual cable modes. The second category is one of localized modes, in which the response of network is not global but the maximum amplitudes are located in the intermediate segments of specific cables only. Moreover, the overall characteristics of these modal forms (both symmetric or antisymmetric) can be different from the solution for individual cables and influenced by the presence and the location of the transverse connectors. The solutions are antisymmetric or pseudosymmetric. The wavelength of these modes is essentially governed by the distance between two consecutive connectors (being almost coincident with the nodes of the modal shape). The high density of solutions is related to the fact that these modes are the components of high-order modes of the individual cables with different magnitude, for which the location of the connector on each cable represents a node of the individual mode shape.
Figure 118 depicts the eigenfunctions of the fundamental modes of the two-dimensional model corresponding to the Hartman Bridge, normalized so that the resulting modal mass of the network is unitary. In this way the presence of a localized mode is emphasized (modes 4 through 8) by solutions for three comparative cases (NET_3C, original configuration; NET_3RC perfectly rigid transverse links; NET_3CG modified non-rigid configuration with ground restrainers) is presented in figure 119, in which the natural frequencies (Hz) are plotted as a function of the mode number and compared to the individual cable behavior. A similar representation was introduced by Abdel-Ghaffar and Khalifa for the numerical study of vibration problems of cable-stayed bridges, in which global (deck, towers) and local modes were identified.(51) From this figure, the structural behavior can be efficiently and graphically characterized: the sequence of fundamental global modes is followed by a high-density solution pattern, corresponding to the localized modes that can be related to the symmetric components of the individual cable segments.
A typical plateau can be identified for all the sets; the upper and lower frequency limits, as indicated in figure 119, are influenced by those frequencies of the individual cable solutions, the modal shape of which is characterized by wavelength close to the distance between restrainers. The modes included in this region are defined as local, governed by the geometry of internal elements of the system, the distance between consecutive nodes of the grid ( Pj,p ) but largely uninfluenced by the structural properties of the connectors. An upper and lower limit frequency can be detected, in this case 1.9 and 2.7 Hz, respectively.
Both limits are connected by the frequency of antisymmetric second modes in the individual stays; the upper α is directly related to the frequency of shorter cables, while the lower value is influenced by a combination of the stays in the central part of the structure (presence of pseudosymmetric components). The high density of frequencies, reflected in the behavior of the determinant, det[S(α)] , suggests a potential sensitivity to forced oscillations, exciting the network within this range of α, in which the dynamics can be influenced by a combination of these modal forms. Beyond this upper limit the situation reverts to a set of higher network modes and thereafter, a second plateau appears in the frequency range coincident with high-order antisymmetric individual segment modes; this pattern of consecutive "steps" defines a typical pattern for the behavior.
Figure 118. Graph. Eigenfunctions of the network equivalent to Fred Hartman Bridge (1st–8th modes).
Figure 119. Graph. Comparative analysis of network vibration characteristics and individual cable behavior (Fred Hartman Bridge; NET_3C, original configuration; NET_3RC, infinitely rigid restrainers; NET_3CG, spring connectors extended to ground (restrainers 2,3)).
For practical purposes, the connectors in the original configuration can be considered as effectively rigid, since the two graphics (NET_3C, NET_3RC) essentially overlap (the increase in the frequency of the fundamental frequency is only about 3 percent).
The action of progressively increasing the stiffness of the restrainers produces modifications and increments in the frequency of the first global modes (and, to a lesser extent, of the higher global solutions). The presence of the ground connectors (restrainers 2,3) is able to modify only global modes (1–3, beyond 27), influencing the response at low frequencies (first modes) and, subsequently, only for much higher solutions, in a frequency range of lower importance for design purposes. Modal amplitudes are clearly reduced in the portion of the stays connected to the deck for purely symmetric modes almost becoming zero. The same behavior is also recorded for antisymmetric global modes in which the oscillations are mostly confined to a restricted region of the network (two or three columns of elements on the left side).
No variations for the intermediate modes (local modes) on the plateau can be seen; solutions are localized and internal portions of the cables or components of higher modes of the individual cables are involved. Frequencies in this range are also strongly influenced by a diminution of the modal mass, associated with a reduction in the size of the contributing components.
Figure 119 also suggests a methodology for evaluating or comparing the efficiency of a system. The rate of change of this function might represent a measure of the system behavior for the first and nonlocalized modes, higher values of the slope being related to a significant increment in the associated frequency. Alternatively, the extension of the plateau on the mode number axis can be seen as an equivalent way of identification; broad almost-horizontal regions should be avoided since they correspond to a large number of local modes, which may be difficult to control (for example, through dampers). The height of the plateau with respect to the frequency axis can also be considered as a means of assessing the performance of the system, this being a metric of the separation between the fundamental modes and the local ones.
Summary
Limited study of in-plane vibrations of complex cable networks has usually been performed by means of finite element methods because of the number of cable elements that are involved and the variability of the global characteristics of the system, also connected to local variations in the crosstied configuration. An alternative methodology for the analytical derivation of the equation of motion (free-vibration problem) of a network, based on the taut-cable theory, has been extended and applied to the study of a real case. The central- and side-span configurations of the Fred Hartman Bridge were considered; a sensitivity analysis of the modal characteristics and frequencies, based on a set of modifications to the original design, contributed to the formulation of some preliminary general criteria to be considered for the optimization of this type of systems. Advantages and limitations with respect to finite element simulations are evident.
This approach showed some clear advantages with respect to the finite element simulations not only because a direct link with the mechanics of the phenomenon can be always referred to the characteristics of the basic solutions, but also because the behavior of a very complex system can be represented through a simple but efficient characterization, something very useful in design or subsequent mitigation analyses. The identification of global and local network modes was also possible, suggesting that the control of this category of structures can become very challenging at higher frequencies because of the nature of the modes that are involved. The general frequency increment in the fundamental modes that is usually attained by the introduction of transverse connectors must be balanced with the potential undesirable behavior of the local modes. This aspect might potentially reduce the overall benefit of enhancing the performance of individual stay behavior by a network.
Design Considerations
From the analysis of the previous cases a set of considerations for the improvement of the response of a cable network can be proposed.
The sequence of global modes and intermediate localized modes is responsible for typical behavior with consecutive steps or plateau. A first suggestion is to keep the location of the first plateau as high as possible, distant from the fundamental modes, so that the antisymmetric individual cable modes (2nd mode) that mostly contribute to the network modal shape are those of the shorter cables. Symmetric configurations of the restrainers with respect to intermediatelength cables is preferred to increase the frequency interval (lower limit in particular) corresponding to local modes since they minimize the longest segment length.
Relative stiffness of the transverse restrainers does not seem to play a significant role in the definition of the modal characteristics; on the contrary, the frequency ratio among different stays fj, related to the reference cable frequency, seems to be responsible for the network mode sequence. A good compromise between small fj (shorter stays) and high values (longer stays) is preferred for the optimization of the system. Unfortunately, this aspect is not connected to the crosstied configuration but to the existing setup of the bridge.
A cable network cannot be designed to withstand all possible excitations; the best thing that can be done is to select some sources of vibrations and "tune" the network not to respond to them since the behavior becomes complex because of the presence of the plateau. Localized modes are practically unmanageable since they mainly concern internal elements of the system, although in these cases the vibration is confined to a selected portion of the structure and the potential implications for long-term structural sensitivity (fatigue damage) are less relevant.
A network combined with additional mechanical dampers connected to the deck at specific locations might be seen as an efficient way of vibration reduction. The presence of pseudosymmetric behavior should be carefully assessed: it generates nondampable modes (half of the structure is at rest). This behavior is enhanced by the presence of ground connectors. It might be possible to use a ground restrainer in the proximity of the shortest cable, close to the tower in combination with dampers on the segments on the right side of the longest cables closest to the deck. In fact, the first pseudosymmetric modes in this model are those related to the unconstrained regions of the network, and the presence of a damper in this position might become efficient. This opportunity must be balanced with the fact that, when the addition of these devices is necessary, the high inclination of the short cables might make them difficult to install.
Finally, the optimal design of a network should be based not only on structural performance considerations but also on cost previsions (installation, maintenance). In this way the preferred solution should be suggested perhaps through a more extended optimization technique.
DAMPERS IN COMBINATION WITH CROSSTIES
The method outlined above can also be extended to a cable network in which the secondary restrainers, originally simulated through linear spring elements, can be combined with discrete dampers placed in the system as an additional measure for the reduction of the oscillations. The procedure is also based on results on the problem of performance improvement for a vibrating cable by adding a transverse damper.(41) The combination of crossties with dampers is not usually considered in the literature and only marginally addressed in the design for this type of structure, even though the opportunity of a larger overall benefit linked to a coupled behavior might be present with few modifications to the undamped configuration.
Problem Formulation
Elements of the more general problem formulation are depicted in figure 120. The example shows a cable network configuration (simulated by a set of parallel cables) interconnected by means of appropriate restrainers, on occasion extended to ground.
Figure 120. Chart. Generalized cable network configuration.
The constitutive law for these connectors can be simulated by linear springs or a viscous damping model. The generic jth cable (j = 1,....,n) is divided into mj segments (with j variable for each cable) due to the presence of the transverse crossties. The jth cable is restrained at both ends. The geometric and physical characteristics of the jth cable are indicated as: length Lj, tension Hj, and mass per unit length µj . The free-vibration problem can be solved through a system of partial differential equations, corresponding to each cable segment, beginning with equation 84:
The xjp along-axis coordinate of the pth segment of the jth cable (with j = 1,....,n; p = 1,....,mj) has been taken in accordance with figure 120; transverse displacements yjp(xjp,t), where t denotes the time variable, are considered positive downwards. The motion of each element can be postulated as yjp(xjp,t) = Re[Yjp(xjp)eiωt], where ω is the complex frequency of vibration of the coupled network to allow for the presence of localized damping in the structure. Equation 84 therefore can be reduced to a system of ordinary differential equations (equation 85):
A solution of the form, as shown in equation 86:
can be proposed, which can be expressed for each segment, in terms of complex trigonometric functions and by selecting a reference cable (upper; j = 1) with natural frequency (real) ω01 = π/L1√H1/µ1 and a normalized complex frequency γ = α + iβ, with i = √-1, such that ω = γω01.
The term fj = ω01ω0j corresponds to the generic jth cable frequency ratio and vj = √(µj/µ1)(Hj/H1) to a mass-tension reduction factor. The length of the pth segment of the jth cable, the limits of which are defined by the nodes Pj;p-1 and Pj;p , is denoted as lj,p; accordingly, a dimensionless length with respect to the total extension of the jth stay can be taken as ξj,p = lj,p/Lj . Equation 86 can be solved in terms of the unknown amplitudes Ajp, Bjp, by means of a set of compatibility, continuity and equilibrium equations that are related to the constitutive law that is assigned to the restrainer (linear spring or viscously damped element), leading to a homogeneous system of 2r = 2 Σmj equations.(52) This set can be rewritten in a more compact matrix form as SΦ = 0 (algebraic system of nonlinear equations), where the vector Φ contains the unknown Ajp, Bjp. The infinite set of nontrivial solutions (Φ ≠ 0), associated with the condition det[S] = 0, can be solved for the normalized frequency γ, as an equivalent eigenvalue/eigenvector problem (in general complex); a numerical technique is required for all but simple systems. Details are omitted for brevity in this study.
Basic Solutions
The investigation of basic solutions that are concerned with a reduced number of cables is very useful in the understanding of the mechanics of the problem. As part of this analysis a collection of relevant examples can be constructed, both to identify the physical behavior and to reveal any interesting characteristics that can be also identified not only in a simple structure but in a more generalized 2r × 2r system. The study of these simple examples therefore represents a useful support to the analysis of multistayed networks.
In this section, this method is applied to the study of a symmetric twin cable arrangement, in which the natural frequencies of the two isolated cables are coincident ( ω01 = ω02 ), and H, L, µ are constant. The additional independent variable is represented by the normalized connector location ξ = 1/L, where 0 ≤ ξ ≤ 1 (figure 121).
In these cases the characteristic polynomial can be analytically derived and, subsequently, the mode. Two examples were analyzed: in the first, the restrainer was simulated by means of a linear spring of stiffness K; in the second, this type of connection was replaced by a dashpot, characterized by a perfectly viscous behavior with damper coefficient c. In both cases the solution can be expressed as a function of the nondimensional location ξ and the physical properties of the transverse element. The solution is associated in both cases with a transcendental equation that needs to be numerically solved.
Figure 121. Chart. Twin cable with variable position connector.
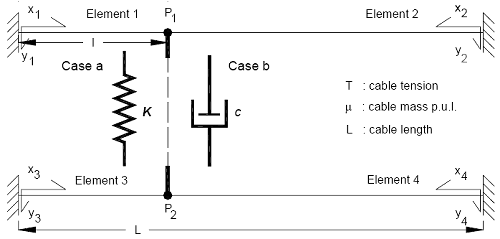 For the linear spring model, the frequency is real (γ = α ) and the modal eigenfunctions turn out to be strictly trigonometric. This quantity can be related to a normalized stiffness parameter, dK = H/(KL). The limit dK → ∞ represents the case in which the stiffness of the connection is zero (i.e., a completely disconnected system), while dK = 0 is related to the case of a perfectly rigid bar. In figure 122, the typical behavior of the real solution for the modal frequency is depicted for the first pseudosymmetric mode, as a function of ξ and dK. The connector is, in fact, responsible for the presence of such modes with localized form, along with the symmetric and antisymmetric solutions of the individual case, in which no frequency variation is recorded (α = 1,2,...N). Similar contour plots can be also generated for the higher modes. Moreover, it can be seen that as dK tends to 0 (approaching the rigid case), the frequency follows a typical hyperbolic law γ ≡α =1/(1 - ξ ) , corresponding to a modal form in which nodes P1, P2, and elements 1,3 (figure 121) are at rest, while segments 2 and 4 are vibrating out of phase with wavelength L – l (figure 124).
For the dashpot model the polynomial, the roots of which are associated with the frequency γ = α + iβ, is complex. The numerical technique develops this polynomial into a system of two equations corresponding to real and imaginary part, which need to simultaneously vanish. This example presents clear similarities with the concepts of single-degree-of-freedom damped oscillator, as equivalently derived by Main and Jones for the single cable with dashpot to ground.(41) The generic γk can be expressed as a combination of an oscillatory decaying solution with frequency ωk = ω0k√(1-ηk2) =|γk|ω01 and damping ratio ηk. A critical value of damping can be defined in terms of the dimensionless damping
parameter ρ = c/√Hµ . In figure 123, the typical solution curves in α, β (or ωk,ηk ) for the analyzed example are depicted: a restricted set of values for the α, β pair can be found, as ρ varies from 0 to infinity, corresponding to the two perfectly oscillatory cases with no damping in the absence of the connector (ρ → 0, γ ≡ α = 1,2, k,..., N ) and the perfectly rigid restrainer of figure 124 ( ρ → ∞ ; diamond symbol in figure 123) with pseudosymmetric modes with γ ≡ α = k/(1-ξ ), k/ξ . The evolution of the solutions between these limits can also be seen for modes 1 to 5.
Differences can be seen (figure 123) between mode 2, which reflects this aspect, and mode 1 as the solution approaches the critical condition of unit damping ratio (η→1). The collection of behavioral observations from these (and other not reported here) simplified examples will be applied and compared in the next section to the study of a real example of cable network.
Figure 122. Graph. Twin cable system, with connector location ξ = 0.35, example of frequency solution for linear spring model.
Figure 123. Graph. Typical solution curves of the complex frequency for the dashpot.
Figure 124. Chart. Intermediate segments of specific cables only.
Cable Network Analysis in the Presence of Discrete Dampers
In this section, a modification to the A-line original system described earlier considers the addition of dampers in specific locations of the structure, as depicted in figures 125 and 126. Dampers D1 and D2, directly connected to the deck, are introduced at the location of restrainers 3 and 2, respectively. The first results of this investigation are presented in figure 127, which shows the behavior of the fundamental global mode (1) in terms of the evolution of ( ωk,ηk ) as a function of the dimensionless damping parameter ρ.
Figure 125. Chart. Fred Hartman Bridge (A-line) 3D network.
Figure 126. Chart. Equivalent model.
In the first example (thin line of figure 127), the influence of only damper D1 was investigated. A behavior very similar to the basic solutions can be observed. The solution emanates from the real frequency coincident with the solution with zero damping, denoted by M1(uu) in the figure, reaches a maximum value of optimal damping (M1(uo)) and then decreases, tending to the purely oscillatory case of a fixed connection to ground (M1(ru)).
In the second case, the addition of damper D2 was considered as a function of a the damping parameter ρD2 ; moreover, it was assumed that D1 was optimally designed for the first mode per the previous example, with ρD1opt = 6.25 corresponding to a damper coefficient cD1 approximately equal to 131 kN-s/m (about 9,000 lbf-s/ft).
The thick line of figure 127 shows the solution evolution for this new configuration. The ω,η pair originates from the point corresponding to the case with only damper D1 active (optimized system M1(uo)—circle symbol), and subsequently increases (as ρD2 progressively grows) towards a new maximum value related to the introduction of this second device. The solution partially deviates from the basic behavior, despite the presence of a similar trend, since it does not converge to a perfectly oscillatory solution as ρD2 →∞ (M1(rr)), because of the presence of D1, although the difference is not evident in the figure. In addition, the location of D2 (midspan) is clearly more efficient, at least for the fundamental network mode; in fact, the recorded peak value of the damping ratio is considerably larger than the previous case, and the device that seems necessary requires a relatively low cD2 (about 172 kN-s/m, or 11,800 lbf-s/ft).
Figure 128 shows, as an example, the complex eigenfunction associated with the first mode of the optimized system M1(uo) ( ρD1opt = 6.25 ); real and imaginary parts are separately plotted to highlight the presence of in-phase and out-of-phase components. It is worth observing that the effective mode shape of the system corresponds to a combination of these two functions.
Figure 127. Graph. Frequency solutions (1st mode) for the damped cable network (A-line).
Figure 128. Graph. Complex modal form (1st mode) for the optimized system M1(uo).
Comments
The introduction of dampers at specific locations of the network was analyzed. Results suggest a potentially wide range of practical applications, related to design and posterection mitigation analyses. In particular, the combined role of dampers and crossties seems promising. Future enhancements will include the study of the role of dampers in cable networks for higher and localized modes and the effect of crosstie mass on the system.
FIELD ASSESSMENT OF DAMPER AND CROSSTIE PERFORMANCE
To suppress problematic vibrations in stay cables, dampers are often attached to stay cables near the anchorages to supplement the low levels of inherent damping. Dampers potentially can be attached unobtrusively near the stay anchorage at the deck or tower, and thus detract minimally from the aesthetics of the structure. While multiple types of excitation are likely to be encountered in the field, and although the mechanisms that induce the observed vibrations are still not fully understood, attached dampers render stay cables less susceptible to many types of excitation by increasing the low levels of inherent mechanical damping. For these reasons, dampers have been used on a relatively widespread basis, and their effectiveness in mitigating stay cable vibrations is now fairly widely accepted. However, criteria for damper design are not well established. Current recommendations for required damping levels to suppress rain/windinduced vibrations were developed using simplified wind tunnel models, and it is not clear whether these guidelines are adequate or appropriate for vibration suppression in the field.(14) In addition, it is important to note that vibrations can occur in more than one mode of the cable, and little has been done to address the question of how much damping should be provided in each mode.
To evaluate damper effectiveness and facilitate the design of even more effective and economical systems, it is important to perform a quantitative assessment of damper performance under various types of excitation. Toward this end, this investigation seeks to evaluate the effectiveness of passive linear dampers installed on two stays on a cable-stayed bridge in the United States by comparing response statistics before and after the damper installation and by investigating in detail the damper performance in a few selected records corresponding to different types of excitation. To provide background for this evaluation, a summary is presented of measured vibration characteristics before the damper installation. Recent developments are discussed in the modeling of a taut cable with attached damper and the determination of modal damping ratios and damping-induced frequency shifts, and some limitations in the performance of linear dampers are discussed. Other types of damping devices, including semiactive dampers and friction dampers, have been previously investigated in attempts to achieve improved damping performance over the linear damper.(42,53)
Performance of Linear Dampers
Viscous dampers have been installed for evaluation on two stays on the Fred Hartman Bridge, and at the time of writing, data have been collected for almost 3 years after the damper installation to evaluate the damper performance. Properties of the two stays on which evaluation dampers have been installed are given in detail in Main and Jones.(54)
The dampers under investigation were designed for optimal performance in the fundamental mode of vibration which, according to the Scruton criterion mentioned above, should provide adequate damping in the first several modes to suppress wind/rain vibration (i.e., approximately more than 0.5 percent). Figure 129 shows the damping ratios for both stays in each of the first 10 modes of vibration, computed from numerical solution of the eigenvalue equation. Curves corresponding to the damping ratios predicted by the asymptotic expression for the universal curve are also plotted with these values. As discussed by Main and Jones, the error in the predictions of the universal curve are most significant near the optimal portion of the curve, and it is evident here that the asymptotic approximate value differs most significantly from the exact value in mode 1, for which the damper is nearly optimal.(41) This error near the optimal portion of the curve becomes more significant in the higher modes, but because the damper is far from optimal in the higher modes in these cases, the universal curve gives quite good predictions of the damping ratios in these modes.
Figure 129. Graphic. Damping versus mode number for Hartman stays A16 and A23.
In the figures included here, wind speed reported is at deck level and is computed according to the following priority scheme. Data from the tower top are given priority because the tower top anemometer is not influenced by interference from the bridge deck. The deck-level anemometers were found to be well correlated with the tower top anemometer except for winds from the west, where interference from the bridge deck reduces the measured velocities at deck level.
Consequently, data from the deck-level anemometers are used only when data from the tower top are unavailable, and then only in the range of wind direction where the correlation with the tower top anemometer is good. In every case, deck-level wind speeds are presented, and in cases where data from the tower top anemometer are used, these values are scaled down to deck level using a scale factor generated from a linear regression analysis of the deck-level and tower-top data (approximately 0.66). Wind direction is measured in degrees clockwise from the bridge axis, with zero degrees corresponding to wind approximately from the north, directly along the bridge axis.
Acceleration data are reported from transducers installed on the stays usually about 6 m (20 ft) vertically above deck level. In some analyses, these data are reported in terms of peak modal amplitude, with adjustment for location included. For the purposes of this investigation and for the data reported here, the accelerations are reported at the transducer location.
Global Damper Performance
The global performance of the dampers installed on stays A16 and A23 is summarized in figures 130 and 131, respectively, which illustrate the following:
- Characterization of oscillations (in-plane) occurring before installation of the damper as a function of wind speed and direction.
- Characterization of oscillations (in-plane) occurring after the installation of the damper as a function of wind speed and direction.
- Measurement of damper force as a function of wind speed and direction.
Before the damper is installed, both stays show similar characteristics, and patterns that are consistent with other field and wind tunnel observations that are described earlier. A high density of points is seen near the abscissa, which generally corresponds to vortex-induced vibration in a variety of modes and low-level buffeting response of the stay to random excitations. Both figures clearly indicate the characteristic signature of wind/rain oscillation as the multiple points over a wide range of wind speeds that are of high amplitude (i.e., root-mean-square (RMS) accelerations greater than 0.5 g). One-minute mean wind speeds at deck level reached 15 m/s (49 ft/s) before the dampers were installed, and almost 18 m/s (59 ft/s) in the period after installation. This latter value corresponds to a 1-minute average wind speed of 27 m/s (60 mi/h) at the top of the tower, recorded during a thunderstorm. The dependence on wind direction is also clear, with A16 showing its peak responses between 90° and 160°, and A23 over a narrower range between 90° and 135°. The primary goal of a mitigation system is to reduce significantly or eliminate these large-amplitude events, while respecting the fact that the stays and bridge form dynamic systems and will always exhibit some level of dynamic response.
The corresponding figures after the installation of the dampers are also presented. These figures suggest the following:
- Amplitudes are significantly reduced across all recorded wind speeds (up to 18 m/s (59 ft/s) at deck level) with maximum RMS acceleration amplitudes of around 0.5 g.
- The dependence on wind direction has been altered significantly, with the previously preferred range now largely unapparent, and the largest of the responses now closer to a 90° angle of incidence. The characteristics of selected records corresponding to these locations will be discussed in more detail later.
- The third pair of figures shows the RMS damper force measured in kilonewtons for the two installed devices as a function again of wind speed and direction. Clearly, the dampers are functioning and providing dissipative force to the stays as intended.
For stay A16, the pattern of forces resembles closely the predamper acceleration figures (both in terms of wind speed and direction), suggesting that the dampers are being engaged by the stays to suppress proclivity towards wind/rain vibration. Indeed, relatively high magnitude forces are seen in the complementary range of 225° to 270°, which represents wind directions also corresponding to the declining direction of the stay (but now from the southwest rather than southeast).
For stay A23, the behavior is similar, though perhaps not as clear as in the previous case. Much of the high force data for this stay is now clustered around and incident angle of 90°, although some up to 110° are evident. An interesting and unusual cluster of points labeled as record C is discussed by Main and Jones.(54) In all the records, the highest amplitude RMS force recorded is approximately 5.6 kN (1,125 lb), a relatively modest level of load.
More detailed comparisons and discussion can be found in chapter 2 and in work by Main and Jones.(54)
Recent and ongoing analyses suggest the evaluation of the damper performance is indeed more complex than the simple assessment outlined above. The presence of a significant static frictional component in the dampers, coupled with their design for mode 1, results in very stiff systems. While the dampers clearly are still effective, interpretation of why they are effective is more complicated than originally thought.
Figure 130. Graph. Stay vibration and damper force characteristics; stay A16.
Figure 131. Graph. Stay vibration and damper force characteristics; stay A23.
Performance of Crossties
The validation of the analysis approach for crosstied systems was performed by the comparison of a specific study example with a set of experimental data. A long-term ambient vibration survey is currently in progress on the Harman Bridge to monitor stay cable vibration and to better understand the overall performance of the structure and its modal characteristics. More than 10,000 trigger files have been recorded during a period of 3 years.
The methodology was applied to the study of the side-span unit of the south tower of the bridge. The cable network is configured by means of three transverse restrainers, similar to those presented earlier. The data set was extracted from the records of four in-plane and out-of-plane accelerometers, placed along stays AS1, AS3, AS5, and AS9 at a height of approximately 7 m (23 ft) from the deck level. The correspondence between the predicted modal characteristics and the real behavior was carried out by simultaneous spectral analysis of the in-plane acceleration record database of the four locations. The analysis was founded on the simultaneous identification of the same dominant in-plane frequency on all the four investigated cables. More than 2,000 trigger files from the years 2000 and 2001 have been considered (after the installation of the restrainers). An algorithm was designed for the automatic processing of the records.
The investigation considered the presence of cable network behavior along with individual cable and, eventually, global (deck) structure modes. The fundamental frequencies of each stay were identified in a previous experimental campaign and were adopted as input data in the numerical procedure to allow for a consistent comparison of the results with the real situation.
The numerical analysis was performed by using as reference the measured frequency values of table 16, after comparison with the current data set available on the four stays, such as the acceleration time histories associated with the out-of-plane unrestrained vibration of the cables. Other physical characteristics that are required by the procedure were indirectly deduced. The results of the simulation are summarized in table 17, in which the modal frequencies of the modes between 0 and 4 Hz are indicated. In addition, the subdivision into global and local network modes is indicated along with information about the general characteristics of the modal shape.
The fundamental frequency (NM1) is 0.93 Hz, slightly lower than that deduced for the central span arrangement; a different network configuration of the cables and connectors in the latter case is probably the cause of these differences. An interesting observation is that the computed frequency of NM1 is close to the 10th bending mode of the bridge (0.924 Hz), which suggests, in theory, a potential susceptibility to interaction of the deck-stay system in this range. Low-density values of frequency can be seen up to 2.4 Hz (NM5) and beyond 3 Hz (NM30). The plateau behavior was detected between 2.4 and 3.0 Hz, associated the local behavior and a high density of solutions (NM5–NM29).
Table 16. Individual cable frequencies (0–4 Hz) of the A-line side-span stays of the Fred Hartman Bridge (direct measurement).
| Stay | Mode n. |
|---|
| 1 (*) | 2 | 3 | 4 | 5 | 6 |
|---|
| AS1 | 0.646 | 1.2920 | 1.9380 | 2.5840 | 3.2300 | 3.876 |
| AS2 | 0.687 | 1.374 | 2.061 | 2.748 | 3.435 | 4.122 |
| AS3 | 0.655 | 1.310 | 1.965 | 2.620 | 3.275 | 3.930 |
| AS4 | 0.720 | 1.440 | 2.160 | 2.880 | 3.600 | 4.320 |
| AS5 | 0.810 | 1.620 | 2.430 | 3.240 | 4.050 | 4.860 |
| AS6 | 0.864 | 1.728 | 2.592 | 3.456 | 4.320 | 5.184 |
| AS7 | 1.032 | 2.064 | 3.096 | 4.128 | 5.160 | 6.192 |
| AS8 | 1.104 | 2.208 | 3.312 | 4.416 | 5.520 | 6.624 |
| AS9 | 1.255 | 2.510 | 3.765 | 5.020 | 6.275 | 7.530 |
| AS10 | 1.355 | 2.710 | 4.065 | 5.420 | 6.775 | 8.130 |
| AS11 | 1.794 | 3.588 | 5.382 | 7.176 | 8.970 | 10.764 |
| AS12 | 1.700 | 3.400 | 5.100 | 6.800 | 8.500 | 10.200 |
| (*) | Derived from previous direct measurment |
| | = Monitored stays in this study |
Table 17. Cable network modes (0–4 Hz) predicted by the model (A-line system).
| Mode N. | NM1 | NM2 | NM3 | NM4 | NM5 | NM6 | NM7 | NM8 | NM9 | NM10 | NM11 | NM12 | NM13 | NM14 | NM15 | NM16 | NM17 | NM18 |
|---|
Frequency
[Hz] | 0.926 | 1.458 | 2.043 | 2.332 | 2.368 | 2.406 | 2.430 | 2.448 | 2.467 | 2.472 | 2.500 | 2.556 | 2.582 | 2.600 | 2.631 | 2.644 | 2.662 | 2.677 |
| Mode type | G-S | G-AS | G-S | L | L | L | L | L | L | L | L | L | L | L | L | L | L | L |
| | | | | | | | | | | | | | | | | | | |
| Mode N. | NM19 | NM20 | NM21 | NM22 | NM23 | NM24 | NM25 | NM26 | NM27 | NM28 | NM29 | NM30 | NM31 | NM32 | NM33 | NM34 | NM35 | NM36 |
Frequency
[Hz] | 2.689 | 2.697 | 2.720 | 2.747 | 2.765 | 2.797 | 2.819 | 2.862 | 2.956 | 2.994 | 3.018 | 3.217 | 3.347 | 3.417 | 3.456 | 3.689 | 3.948 | 4.077 |
| Mode type | L | L | L | L | L | L | L | L | L | L | L | G-S | G-S | G-S | L | G-AS | L | L |
| G = Global Network mode; L = Local Network mode; S = symmetric; AS = antisymmetric |
The experimental identification of network modes of table 17 in the records of AS1, AS3, AS5, and AS9 was restricted to a subset of visible components in accordance with the location of the accelerometers, since predicted local modes that are concentrated in the central and upper portion of the system could not be physically detected. The power spectral densities of the four in-plane accelerations of AS1, AS3, AS5, and AS9 have been compared with the predicted values of the network.
The results of the data analysis showed consistent similarities with the predictions, also indicating the potential presence of some of the new modal forms in frequency ranges in which modal characteristics from other sources (e.g., individual stays, global structure) were often excluded.
NM1, as network mode, was clearly identified in one occasion only for a continuous time interval of about 15 minutes, corresponding to an extremely rare occurrence in terms of ambientinduced vibration. This event was mainly driven by the high-amplitude motion of the deck caused by vortex shedding and related to a strong wind with direction almost perpendicular to the bridge axis.
Simultaneous peak amplitudes in the acceleration spectra from the stays were found in a significant number of realizations that corresponded to the simulated frequencies of the second global antisymmetric mode (NM2, 1.46 Hz) and higher global symmetric modes (NM30–31, 3.2 Hz). Clear indication of the potential development of local network modes rather than individual stay oscillation was also detected in frequency intervals predicted by the model.
More figures and details of the comparison are included in work by Caracoglia and Jones.(55)
Recent investigation of recorded data suggests instances of relative large-amplitude oscillation for the stays when the wind is parallel to the deck. The crossties were ineffective at damping these oscillations, whereas the dampers seemed to be quite successful. It is anticipated that these large amplitude oscillations are caused by a form of wake galloping. The analysis of these records is in progress and will be reported as soon as it is complete. However, the implication of this discovery for crosstie systems is important.
DETAILED STUDY OF DAMPER PERFORMANCE
Despite the demonstrated effectiveness, the design of passive dampers still remains semiempirical. An efficient and reliable way to estimate the inherent damping in the cables is still not available. The traditional logarithmic decrement method has so far been the most widely adopted for this task. But the effectiveness of this method is limited because the highly vibration amplitude-dependent nature and some other existing but not clearly understood nonlinearities of the inherent damping in cables cannot be readily handled by this approach. In addition, vibrations can occur in more than one mode of the cables, and understanding of modal inherent damping is essential for damper design. But it is difficult to force the cables to vibrate at desired amplitude in the modes with relatively high (e.g., >2 Hz) or low (e.g., <0.5 Hz) frequencies. This fact also limits the number of modes the logarithmic decrement method can handle. Application of other traditional methods such as the half-power bandwidth method and the more recent random decrement method are also likely to have limited success because of their respective limitations.
Analytical work by Yamaguchi and Jayawardena suggested that modal damping ratios in stay cables are proportional to the dynamic strain energy in the cables.(48) A theoretical model based on this relation was also established for model damping estimation, but the validity and robustness of this model still needs further investigation and verification. On the other hand, criteria that address how much supplemental damping is needed to suppress the vibrations or how much damping the dampers can provide are still not well established. Current recommendations for required damping levels were developed using simplified wind tunnel models discussed here, but despite the advances made in this project and elsewhere in recent years, it is not completely clear whether these guidelines are adequate or appropriate for field implementation.(14) In addition, little has been done to address the problem of how much damping is needed in each mode to mitigate the vibration and for which mode the damper should be optimized.
Although substantial progress has been made in assessing the damping in cables of cable-stayed bridges, understanding from the aforementioned efforts have been focused on theoretical formulation or simplified wind tunnel tests and are yet to be subjected to evaluation. Additional insights from actual cable vibrations in the field are still needed. The primary objective of this subeffort has been to extract damping information for stay cables, both with and without dampers, using the measured vibration data. Damping ratios identified are analyzed together with the characteristics of cable vibration to evaluate the dependence of inherent damping upon the vibration amplitudes. Results for the cables before and after damper installation have been compared to assess the performance of the dampers under various conditions. Particular attention also must be paid to the important role of rain on the damping of stay cables to provide insight into the problem of negative damping.
Additional Characteristics of Vibration
Discussions earlier have been focused on vibrations in the in-plane direction of the cables. But as noted, highly two-dimensional vibrations have actually been frequently observed. In some cases, vibrations in the lateral direction have been the more dominant. This fact is evident in figure 132, which plots the 1-minute RMS displacement amplitude in the in-plane direction against that in the lateral direction for stays AS16 and AS23. The records represented were chosen from those collected before the dampers were installed, with RMS displacement amplitude of the in-plane vibration or the lateral vibration greater than 0.5 cm (0.2 inch). Points in figure 132 for cable AS16 formed three distinct clusters, as illustrated, around three lines. Analysis of the modal RMS displacements of the records show that points in cluster A represent in-plane vibrations strongly dominated by the first mode, points in cluster B represent in-plane vibrations strongly dominated by the second mode, and points in cluster C represent in-plane vibrations dominated by more than one single mode. No clear clustering of points has been observed for stay AS23 in figure 132, although the vibrations still appear to be highly two-dimensional.
Figure 132. Chart. In-plane versus lateral RMS displacement for (A) AS16 and (B) AS23.
Figure 133 shows sample Lissajous plots (in-plane displacement against lateral displacement) for two different records (1 and 2) from stay AS16. Record 1 is chosen from cluster A in figure 132 and record 2 is from cluster C. Although the in-plane displacement amplitudes for both records are comparable, the lateral displacement amplitude for record 2 is significantly larger than record 1. Power spectral densities of these two records (figure 134) show that both in-plane and lateral vibrations of record 1 are dominated by the first mode, but vibrations of record 2 in both directions have significant contribution from all the first three modes. Records in cluster B are found to have similar dimensional and modal contributory properties as records in cluster A.
Figure 133. Chart. Sample Lissajous plots of displacement for two records from AS16.
Figure 134. Chart. Power spectral density of displacement of two records from AS16.
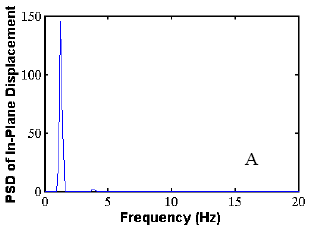 | 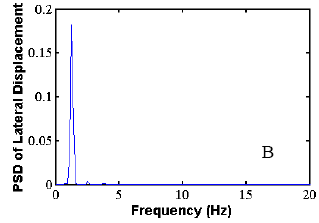 |
| Record 1 from AS16 |
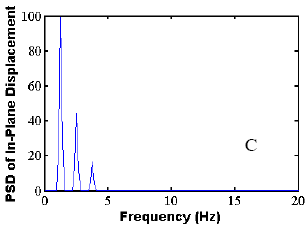 | 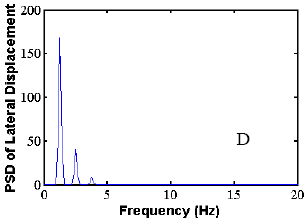 |
| Record 2 from AS16 |
Similar Lissajous (figure 135) and power spectral density (figure 136) plots have been made for two records (1 and 2) from stay AS23. Record 1 has vibration primarily in the in-plane direction, while vibration of record 2 is rather two-dimensional. Figure 136 shows that, unlike in the case of record 2 for AS16, even though the vibration of record 2 for stay AS23 is highly twodimensional, vibrations in both directions are still both dominated by a single mode (mode 3). While most highly two-dimensional vibrations for stay AS16 have been found to be dominated by a single mode, most highly two-dimensional vibrations for stay AS23, however, are dominated by multiple modes. This difference in both dimensionality and modal participation of vibrations for the two cables suggests strong dependence of cable vibration on its physical characteristics.
In future analysis, more attention will be directed to detailed investigation of dimensionality, as well as its dependence on modal participation, of stay cable vibrations, in conjunction with collected wind and rain data. This may give further insight into the mechanism of stay cable vibrations and help identify different categories of vibration.
Figure 135. Graph. Sample Lissajous plots of displacement for two records from AS23.
Figure 136. Graph. Power spectral density of displacement of two records from AS23.
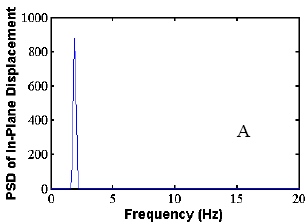 | 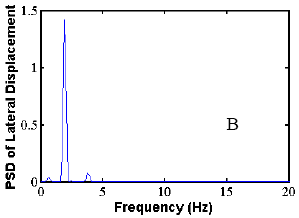 |
| Record 1 from AS23 |
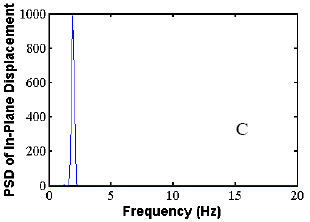 | 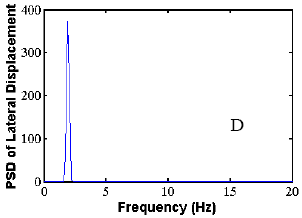 |
| Record 2 from AS23 |
Damper Effects on Vibration
Discussion so far has been focused on vibrations of the two cables before dampers were installed. Collected records demonstrate that, except in a very few cases, the dampers on both cables have been effective in mitigating excessive vibrations, despite the difference in the properties and vibration characteristics of the two cables and the fact that the dampers were designed semi-empirically. Figure 137 shows again the 1-minute RMS displacement in the inplane direction against that in the lateral direction for stays AS16 and AS23 collected after the dampers were installed. All records also have RMS displacement amplitude greater than 0.5 cm (0.2 inch) in either the in-plane direction or the lateral direction. By comparing figure 137 and figure 132, it is evident that very few records with RMS displacement amplitude greater than 0.5 cm (0.2 inch) have been recorded after damper installation and that the amplitude has been mostly kept below 2 cm (0.8 inch), except in very rare individual cases. This confirms that the damper has been generally effective in suppressing large-amplitude vibrations.
Figure 137. Graph. In-plane versus lateral RMS displacement for (A) AS16 and (B) AS23 after damper installation.
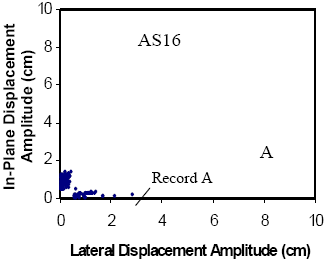 | 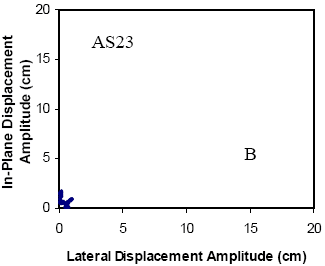 |
Special attention has been focused on record A and adjacent ones in figure 137 because, for these records, the RMS displacement amplitude in the lateral direction is quite large, but the RMS displacement amplitude in the in-plane direction is rather small. This may indicate that the damper on stay AS16, which is oriented in the in-plane direction, has not been able to suppress vibration in the lateral direction in these special cases. Figure 138 shows the Lissajous and power spectral density plots for record A. It is evident in the figures that, even though the vibration is basically one-dimensional, unlike in the case when the vibration is primarily in the in-plane direction, the lateral displacement of record A has significant contribution from all the first three modes, rather than being dominated by a single mode. This fact suggests that when large vibration is primarily in the lateral direction, its cause and mechanism may be different from the case when the cable vibrates primarily in the in-plane direction. Collected wind data revealed that when vibration in record A occurred, the wind speed is about 12 m/s (39 ft/s), which is in the range of wind speed for large-amplitude vibration for stay AS16, but the wind direction is around 350°, which is too far away from either 120° or 260° as shown in figure 135 (for record 2) to be the preferred wind direction for large-amplitude in-plane vibration. In fact, the wind direction in this case is almost parallel to both the bridge axis and the axis of the stay cables. Further analysis revealed that the cables adjacent to AS16 also had the same pattern of vibration, except stay AS24, which is the first cable to meet the wind, and had large-amplitude vibration in both directions. Another observation was that the cables on the south side of the same tower, which have opposite inclination direction to AS16, did not have the same pattern of large-amplitude vibration as AS16. Heavy rainfall has been found to accompany the cable vibration. Whether the rainfall triggered the vibration of stay AS24, which consequently caused the lateral vibrations on the other cables, must still be determined. The vibration occurred on stay AS16 still cannot be concluded positively to be wake galloping. What can be stated here is that this type of vibration may reach quite large amplitude, and dampers may not be effective in suppressing it. The same type of vibration also has been found on cables on the south side of the same tower when wind is coming from about 180°, which is also parallel to the bridge axis and in the inclination direction of these cables. The important observation is that the crossties installed on these cables were also ineffective in mitigating this type of vibration.
Figure 138. Graph. Lissajous and power spectral density plots of displacement for record A.
Frequency Estimation
The modal frequencies of a cable are decided by its length, mass, stiffness, and damping ratio in each mode. Among these properties, the stiffness and the damping ratio may be dependent on the vibration amplitude, and thus renders the frequencies variable as well. Figure 139 shows the averages of estimated modal frequencies for the first several modes of stay AS16 and AS23. In these figures, frequencies of the cables with and without damper attached are presented separately to show the effects of the dampers. The estimated natural frequencies are found to be in very good agreement with the values obtained by searching for the peaks of power spectral densities of the response. Frequency shifts introduced by addition of dampers, which were suggested by Main and Jones analytical work, are also evident in the figures.(56)
Figure 139. Graph. Modal frequencies of stays (A) AS16 and (B) AS23.
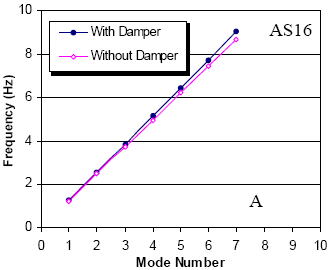 | 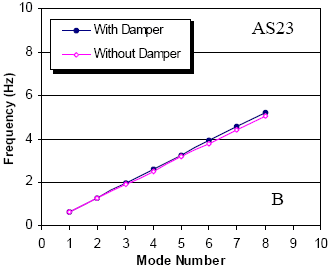 |
In figure 140, the estimated second-mode frequency of stay AS16 without damper attached is plotted against the RMS displacement at the accelerometer location. Very small variance is found in the estimates from record to record, but a trend is evident that the modal frequency increases with displacement when the RMS displacement is greater than about 2 cm (0.8 inch). Similar trends have been observed for the other modes, but will not be presented here. At this point, it is suggested that this trend is caused by the change of the effective support condition of the cable with vibration amplitude. On the Fred Hartman Bridge, stay AS16 goes through a guide pipe before it reaches the anchorage and there is a neoprene ring between the cable and the pipe. When the amplitude of the vibration is large enough, the gap between the cable and the pipe will be gradually closed, which results (realistically) in a shorter cable with higher modal frequencies. Figure 140 shows the same relation for stay AS16 after the damper was installed. The variance of the estimates is again very small, but no increase of the frequency with displacement amplitude is evident. This may partly be due to the fact that, with the presence of the damper, the vibration did not reach sufficient amplitude as to close the gap between the cable and the pipe. It may also be partly due to the fact that the damper itself may have been acting as a “pseudoanchorage” of the cable when vibration amplitude is low.
Figure 140. Graph. Second-mode frequency versus RMS displacement for stay AS16.
Damping Estimation
Compared with frequency, damping is a much more complicated property, and its source and mechanism are still not well understood. In the case of wind or rain/wind-induced stay cable vibration, the problem is further complicated by the introduction of the so-called negative damping, which, unlike conventional damping, adds energy into the system instead of dissipating it. Preliminary estimation results have been analyzed with some attention directing to details in a case-by-case manner. Special attention has been paid to the effects of damper on the effective damping of the cable vibration system. The effect of rainfall has also been preliminarily analyzed because it has been proved to be an important contributory factor to stay cable vibration.
Figure 141 shows the effect of the attached damper on the damping ratios of stay AS16. Averages of estimated modal damping ratios are used in the figures and will continue to be used in the subsequent figures for discussion of damping estimation. As shown, the inherent damping (cable damping without contribution from rainfall and damper) in each mode of the cable, according to the estimation, is very low and decays very rapidly in the first several modes. It is unexpected, however, that the addition of the damper to the system did not appear to result in significant increase of the modal damping ratios. The largest increase by about 0.15 percent of critical damping comes in the first mode of vibration when the cable vibrates without rainfall. With rainfall, the largest increase comes in the second mode, which is frequently the most dominant mode for rain/wind-induced vibration. But this increase is very small as well, by just 0.06 percent of critical damping. This estimation result is not only against intuition that external dampers will bring large supplemental damping into the system, but also against the observed fact that the damper on stay AS16 has been successful in suppressing excessive vibrations. These observations are still under detailed investigation, along with analysis and comparison of records with and without rainfall. Similar patterns have been observed in the damping estimation results for stay AS23.
Figure 141. Graph. Estimated modal damping of stay AS16 showing effect of damper.
Figure 142 shows the histograms of the damping estimation results for mode two of stay AS16 and mode three of stay AS23 from records without rainfall, before dampers were installed. It is evident in these two figures that the distributions of these results are rather broad. A similar pattern of distribution has been found for estimation results for the other modes of the cables. This means that the average values used above for discussion may not be very appropriate for comparison purposes. Better categorization and interpretation of the estimation results is thus desired and will be a major focus of future research. Additional analysis investigating dependence of damping on wind speed and vibration amplitude have been conducted. Because results as of the time of this report are not fully conclusive, they are not reported here.
Figure 142. Graphic. Histogram of estimated damping for (A) mode 2 of AS16 and (B) mode 3 of AS23.
Figure 143 shows the relation between the estimated damping in the second mode of stay AS16 with a corresponding 5-minute RMS damper force. The points are scattered, but a noticeable though not clear trend is present that the modal damping ratio decreases when the damper is more engaged. More investigation into this trend is needed but, if it is true, it potentially suggests that, in some cases, although supplemental damping is supplied by the damper, the effective damping level in the system may still remain low.
Figure 143. Graphic. Dependence of modal damping on damper force.
It must be emphasized that the observations above were made through preliminary analysis of a limited number of records. Much more work still remains to be done before general conclusions can be reached. Nonetheless, at least one controversial problem is apparent in the current findings: according to the estimation results, the addition of dampers to the two cables did not result in a large enough increase of damping into the systems, especially with the occurrence of rain, while also according to the measurements, excessive rain/wind-induced vibrations have been effectively suppressed by the dampers. According to Irwin, rain/wind-induced vibration could be avoided if the Scruton number is greater than 10.(14) The Scruton number is defined as:
| where: |
| m | = cable mass per length, |
| ζn | = the modal damping ratio, |
| ρ | = the air density, and |
| D | = the cable diameter. |
Analysis of the modal damping ratio needed according to the Scruton number criterion to suppress rain/wind-induced vibration, together with the averages of estimated modal damping in stays AS16 and AS23 with damper attached, suggest that if the estimation and the Scruton number criterion were both valid, the damper could not have suppressed the rain/wind-induced vibration in the second mode of stay AS16 and the third mode of stay AS23. This is obviously contradictory to the observations from measurement. In addition, the estimated damping results are also inconsistent with the results from damping prediction methods.
These inconsistencies in damping estimation are important. Detailed investigation of these discrepancies is needed and will be a focus of future research. A tentative explanation is proposed in the following section.
Possible Explanation for Discrepancies in Damping Estimation
It has been revealed that the dampers on stay AS16 and AS23 frequently may not have been engaged effectively; instead, they may have been working more like a supporting point for the cables when the vibration amplitude was low. Figure 144 shows the 1-minute RMS damper force against the 1-minute RMS in-plane displacement at the accelerometer location and the 1-minute RMS in-plane displacement at the damper-cable connection point, respectively, for stay AS16. All the records shown in the figures were chosen to have a 1-minute RMS damper force greater than 0.5 kN (112.5 lbf). Figure 144 for AS16 reveals a very clear relationship between the RMS damper force and the RMS displacement at the accelerometer location. The four clusters (A, B, C, and D) of points in the figure are found to represent in-plane vibrations in the second, fourth, fifth, and seventh modes of the cable, respectively. However, for cable AS23, no similar relationship is evident between the RMS damper force and the RMS displacement at the dampercable connection. These and other observations suggest that the damper may have been frequently locked up and produced no or little energy dissipation to the system, which may partially explain why the average supplemental damping estimated was very low.
Figure 144. Graph. RMS damper force versus RMS displacements for (A) AS16 and (B) AS23.
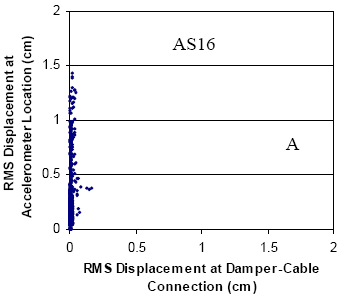 | 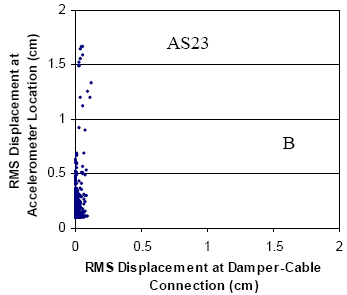 |
Figure 145 plots the measured damper force against the displacements and velocities at two locations of stay AS16 for a segment of a sample record. The integrated displacement and integrated velocity in the figure were integrated from the acceleration time history measured by the accelerometer, but were scaled down by a constant factor to have approximately the same amplitudes as those of the displacement and velocity at the damper-cable connection. The phase difference between these two locations has also been approximately corrected using the method proposed by Krenk and Main and Jones.(36,56) The differentiated velocity was directly differentiated from the displacement measured at the damper-cable connection. The abrupt changes of the curvatures in the force-displacement plots and the slopes of the lines in the forcevelocity plots suggest that the damper did not behave viscously, as it was assumed to be. Instead, it had been effectively locked up until the damper force passed a certain level. This record is not a special case. In fact, this pattern of damper behavior has been found to be very common in records in which the dampers are believed to be suppressing excessive cable vibration. It was later confirmed by the manufacture of the dampers that this force is the residual static friction in the dampers. Because of the friction, the dampers would remain locked up and act as new supporting points for the cables until the vibration amplitude becomes large enough and the friction threshold is overcome. It has also been noticed (but not presented in detail at this time) that the friction threshold for each damper varies from record to record in a certain range, according to characteristics in mode participation and dimensionality of the vibration. It is hypothesized here that the existence of the friction threshold reduces the supplemental damping the dampers can effectively add to the system, which partly explains the estimation result that the amount of damping added by the dampers is very small. The validity of this hypothesis is to be subjected to future research and the approach to verify it will be proposed in the next section. It has to be noted, however, that even when the dampers were locked up, they would still introduce frequency shifts into the cable systems because the cables in this case just vibrates in a shorter length. This is similar to but not the same as the case Main and Jones discovered that, if the damper is designed to be too stiff, it essentially results in the length of the cable being effectively shorter.(56)
Figure 145. Chart. Damper force versus displacement and velocity for a segment of a sample record.
Although the discussion so far tentatively explains why the supplemental damping provided by the dampers appears low, it did not explain why the dampers have been successfully suppressing excessive vibrations. Figure 146 shows the time histories of displacement and damper force for a sample 5-minute record for stay AS16. It is clear in the figure how the vibration of the cable built up at the beginning and was subsequently suppressed by the damper. But the means by which the damper suppressed the vibration is of interest. The correlated periodic increasing and decreasing of amplitudes in both time histories suggests that the damper might not have been engaged all through the record. Rather, it appears that the damper had been working periodically, only when the displacement amplitude was large enough. It can also be noticed in the time histories that the amplitudes of the peaks are almost at the same level, suggesting that the damper seemed to be keeping the vibration below a certain level. This pattern of damper performance, again, is not just a special case. It has been observed often in the records when the damper is believed to be suppressing excessive cable vibration.
Figure 146. Chart. Displacement and damper force time histories of a sample record.
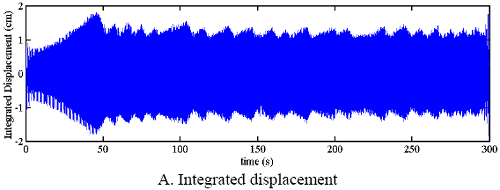 |
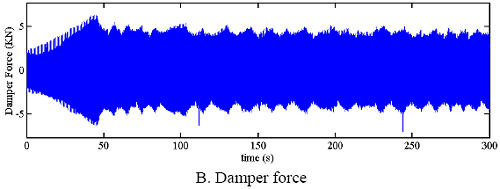 |
Why the damper behaves this way must be investigated in association with the unique nature of wind- or wind/rain-induced stay cable vibration. Unlike other forced vibration of other structures, wind- and rain/wind-induced cable vibration is self-excited, which means that the wind, or the combination of wind and rain, and the vibration itself both have to meet a certain criterion for the vibration amplitude to increase. The role of the damper in the stay cable vibration system, then, is to bring the vibration from unstable back to stable by dissipating energy. But it is hypothesized here that the amount of the energy the damper has to dissipate does not necessarily have to be large. If this amount of energy is indeed small, it will be another reason why the estimated amount of damping the dampers added to the cable vibration system is small. To verify this hypothesis, at least two questions must be answered: how does the vibration build up, and how much energy is actually dissipated by the damper.
Previous | Table of Contents | Next
|
