U.S. Department of Transportation
Federal Highway Administration
1200 New Jersey Avenue, SE
Washington, DC 20590
202-366-4000
Federal Highway Administration Research and Technology
Coordinating, Developing, and Delivering Highway Transportation Innovations
 |
| This report is an archived publication and may contain dated technical, contact, and link information |
|
Publication Number: FHWA-RD-03-048 |
Previous | Table of Contents | Next
This chapter compares FLAC predictions with calculations done in accordance with AASHTO, Section 5.8, 1998 (AASHTO 1998). The details of AASHTO design are given in "Demonstration Project No. 82: Mechanically Stabilized Earth Walls and Reinforced Soil Slopes, Design and Construction Guidelines," (FHWA, 1997).
First, the program MSEW 1.1 (ADAMA Engineering 1998) was used to analyze four baseline cases that represent all four failure mechanisms identified by FLAC. Second, the slopes' slip planes of all cases at the critical and failure states were measured from FLAC plots, and are presented together with the values resulting from the Rankine's and Coulomb's earth pressure theories. Third, stress distributions from FLAC analysis were compared with the AASHTO values.
Four model walls at the critical state were analyzed according to AASHTO design method using the program MSEW 1.1 (ADAMA Engineering 1998). The purpose was to compare FLAC predictions with an existing design method. The following four cases were selected to represent different failure modes identified with FLAC:
The input data used in the AASHTO 98 analysis with the MSEW 1.1 program are given in table 5.1. The analysis mode of the program was used for simple wall geometry, modular block facing, and geotextile reinforcement. No water table, surcharge loads, or seismicity were introduced in the analysis. The wall geometry and reinforcement layout were the same as those used in the FLAC models (figure 3.1). The ultimate strength of reinforcement was specified to correspond to the maximum axial force in reinforcement calculated by FLAC. Since up to five different reinforcement types can be specified in MSEW 1.1, only the maximum axial forces of the bottom five layers were used. All reduction and correction factors in the MSEW 1.1 analysis were specified to be equal to 1.0. Major results from the MSEW 1.1 analysis are given in table 5.2. The factors of safety for sliding and overturning are calculated for the wall-foundation interface and represent their minimum values. The excessive factors of safety against bearing capacity for cases 1, 2, and 8–1 were a result of the artificially high cohesion used in FLAC models to represent very stiff foundation soil.
The results for case 1 show that, according to analysis, the wall was at the verge of failure due to toppling (Fs=1.09). The factors of safety against sliding and bearing capacity showed that the wall was stable with respect to direct sliding (Fs=2.914) and bearing capacity failure (Fs=86.4). The ultimate strength of geotextile exceeded the maximum reinforcement force from internal stability analysis (Tmax), except for the fifth layer, which indicated that, internally, the wall was stable. AASHTO results for case 1 (s=0.4 m) confirmed that at height h=6.0 m, the wall was at the verge of failure, which coincided with the definition of a critical state in FLAC analysis. The predicted FLAC external mode of failure comprised the overturning mode of failure identified by MSEW 1.1 calculations. The maximum forces in reinforcements provided by FLAC and MSEW 1.1 calculations are given in figure 5.1.
The results for case 2 implied that according to AASHTO the wall was stable externally and unstable internally. All external stability factors of safety were greater than one and exceed the values used in design. The wall was stable with respect to direct sliding (Fs=2.981), overturning (Fs=3.68), and bearing capacity failure (Fs=594.9). However, the maximum reinforcement force from internal stability analysis (Tmax) significantly exceeded the ultimate strength of geotextile, which indicated that the wall was internally unstable. AASHTO results for case 2 (s=0.6 m) confirmed that at height h=2.6 m, the wall was internally unstable. The connection mode of failure predicted by FLAC matched the internal instability identified by MSEW 1.1 calculations. The maximum forces in reinforcements provided by FLAC and MSEW 1.1 calculations are given in figure 5.1.
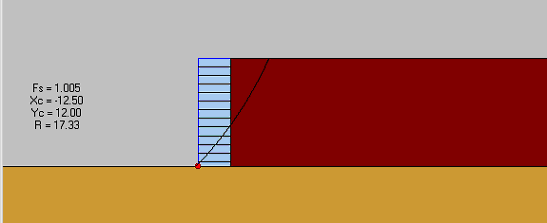
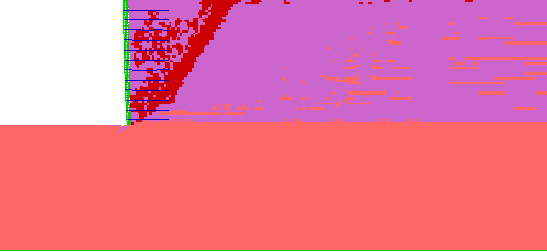
The results for case 8–1 implied that, according to AASHTO, the wall was stable externally and unstable internally. All external stability factors of safety were greater than one and exceeded the values used in design. The wall was stable with respect to direct sliding (Fs=3.497), overturning (Fs=1.57), and bearing capacity failure (Fs=449.1). However, the maximum reinforcement force from internal stability analysis (Tmax) significantly exceeded the ultimate strength of geotextile in the reinforcement layers at the bottom of the wall. The MSEW 1.1 results for case 8–1 (s=0.4 m) indicated that at height h=5.0 m, the bottom part of the wall was internally unstable. A compound stability analysis using the L–method (a modification of Demo 82 approach proposed by Leshchinsky (ADAMA Engineering 1998, Leshchinsky 1999) was conducted for further investigation. The compound mode of failure predicted by FLAC was identified by the MSEW 1.1 calculations using the L– method. The calculated factor of safety was 1.005, which confirmed that the wall was at the verge of failure with respect to compound failure. The other two methods implemented in MSEW 1.1 gave conservative results: the factor of safety calculated by using the Demo 82 method was 0.76, and the factor of safety calculated by using the comprehensive Bishop's method was 0.63. The maximum forces in reinforcements given by FLAC and MSEW 1.1 calculations are given in figure 5.2. The critical slip surface from the compound stability analysis and the failure zones distribution given by FLAC are shown in figure 5.3.
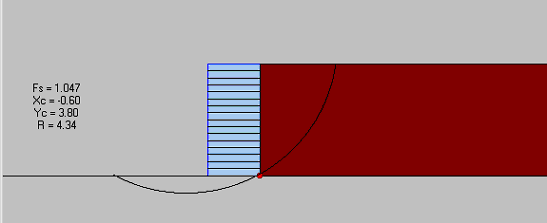
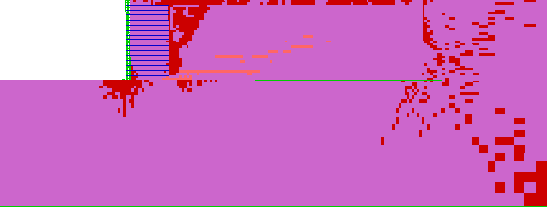
The results for case 10 showed that, according to AASHTO, the wall failed because of bearing capacity failure (Fs=0.38). The factors of safety against direct sliding (Fs=1.08), overturning (Fs=1.62), and eccentricity (e=0.46 m) also indicated instability. The ultimate strength of geotextile exceeded the maximum reinforcement force from internal stability analysis (Tmax), which indicated that the wall was internally stable. The MSEW 1.1 results for case 10 (s=0.4 m) indicated that at height h=3.2 m (which corresponded to the critical state predicted by FLAC) the wall had failed earlier as a result of bearing capacity failure. Further deep-seated stability analysis indicated that, for the critical state predicted by FLAC, the wall was at the verge of deep-seated failure (Fs=1.047). The deep-seated mode of failure predicted by FLAC was also identified by MSEW 1.1 calculations. The maximum forces in reinforcement calculated by FLAC and MSEW 1.1 are given in figure 5.2. The critical slip surface corresponding to deep-seated stability analysis and the failure zones distribution given by FLAC are shown in figure 5.4.
The comparison between the MSEW 1.1 calculations and FLAC predictions for the specified cases showed good agreement between the results. The existing design method was able to distinguish the modes of failure identified by FLAC analysis, especially those due to external instability.
1 In the L–method, the factor of safety is directly related to the reinforcement strength, based on the premise that the soil shear strength is mobilized fully, and stability is entirely dependent on reinforcement strength (Leshchinsky 1999). The peak shear strength of soil is reduced, accounting for possible large deformations and progressive failure. For further details, see the help menu of program MSEW 1.1.
The slope of slip surfaces that developed at the critical and failure states of all models were measured from FLAC plots of failure zones distributions (see the schematic in figure 4.44–b). The slip surfaces were approximated as planes starting from the top of the backfill. The planar approximation was accurate for models that experienced external or connection modes of failure. The slip surfaces of models that experienced compound or deep-seated modes of failure were nonplanar, and can better be approximated more accurately by circular arcs, as done in the slope stability analysis. In most cases, the slip surfaces became nonplanar in the zone near or within the reinforced soil.
The slip surface slopes measured on FLAC plots were lower than the values given by the Rankine's and Coulomb's earth pressure theories at both critical and failure states (table 5.3). The slopes of surfaces calculated by using Coulomb's equation were closer to FLAC results than to those calculated by using Rankine's equation.
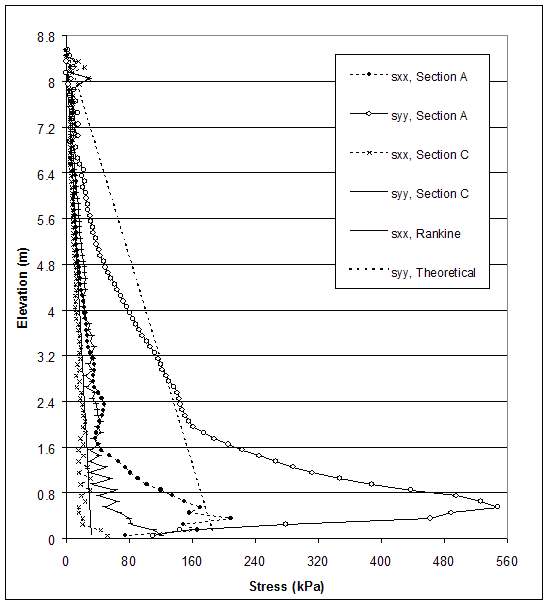
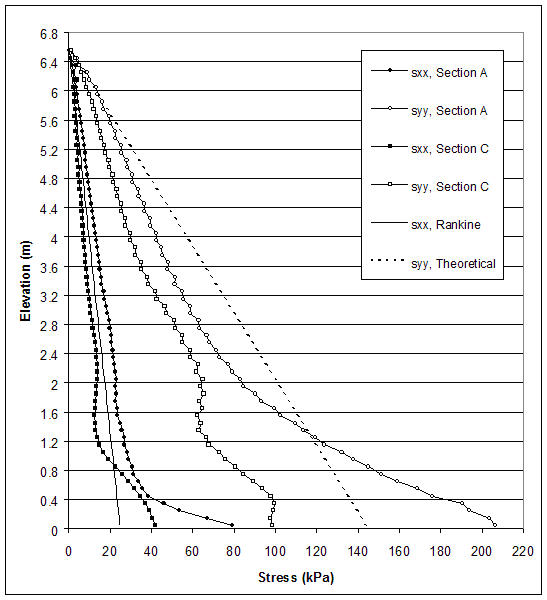
According to AASHTO, the horizontal stresses are calculated using the Rankine's earth pressure coefficient. Therefore, researchers compared Rankine's earth pressure theory and the stresses produced by FLAC along section A (0.15 m behind the facing) and section C (0.15 m behind the end of reinforcement) at the critical and failure states. Horizontal and vertical stresses for case 1 (s=0.2 m, external failure mode), case 2 (s=0.6 m, connection failure mode), case 8–1 (s=0.4 m, compound failure mode) and case 10 (s=0.2 m, deep-seated failure mode) are presented in figures 5.5–5.12.
The model of case 1 (s=0.2 m, high strength soil, very stiff foundation) experienced external mode of failure. Stress distributions at the critical and failure states are shown in figures 5.5 and 5.6. At the failure state, toppling of the wall led to stress concentration at the toe of the wall (section A), while horizontal and vertical stresses along section C were almost the same. At the critical state, the stress concentration at the toe was smaller; however, the stress distributions also indicated the identified mode of failure. The stresses produced by FLAC differed from the stresses used in AASHTO design. The horizontal stresses behind the facing (section A) were larger than those calculated by using AASHTO for both critical and failure states. The horizontal stresses behind the reinforced soil (section C) were smaller than those calculated by using AASHTO for both critical and failure states, except the stresses at the bottom of the wall.
The model of case 2 (s=0.6 m, medium strength soil, very stiff foundation) experienced connection mode of failure. Stress distributions at the critical and failure states are shown in figures 5.7 and 5.8. Deformations of the reinforced soil and at the facing led to uneven distribution of stresses. At the critical state, the stress distribution indicated internal instability at the upper part of the wall's facing. Horizontal stresses produced by FLAC oscillated around the stresses used in AASHTO design in the upper part of the wall. The horizontal stresses were larger than those calculated by AASHTO at the bottom of the wall.
The model of case 8–1 (s=0.4 m, high strength soil, very stiff foundation, DR) experienced compound mode of failure. Stress distributions at the critical and failure states are shown in figures 5.9 and 5.10. The horizontal stresses produced by FLAC oscillated around the stresses used in AASHTO design, except at the bottom of the wall.
The model of case 10 (s=0.2 m, high strength reinforced soil, low strength foundation and backfill soil) experienced deep-seated mode of failure. Stress distributions at the critical and failure states are shown in figures 5.11 and 5.12. The stresses produced by FLAC differed from the stresses used in AASHTO design. The FLAC horizontal stresses along sections A and C were closer to the AASHTO horizontal stresses corresponding to section A (high strength soil). The horizontal stresses behind the reinforced soil (section C) were smaller than AASHTO horizontal stresses corresponding to section C (low strength soil).
The horizontal stresses calculated by FLAC differed from the horizontal stresses used in AASHTO design. At the critical states, FLAC stresses behind the facing were approximately 25 percent larger than AASHTO stresses. This difference was much larger at the bottom part of all models in which stress concentration was observed, and for the case that experienced connection mode of failure.
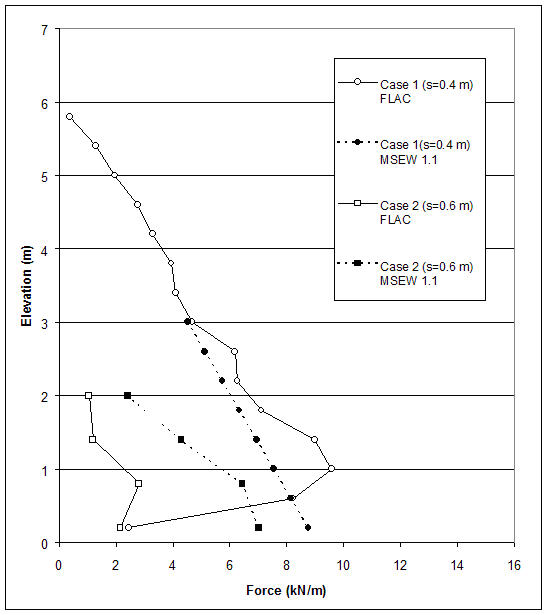
Figure 5.1 Maximum Force in Reinforcement: Comparison of FLAC and AASHTO Results for Case 1 (s=0.4 m) and Case 2 (s=0.6 m).
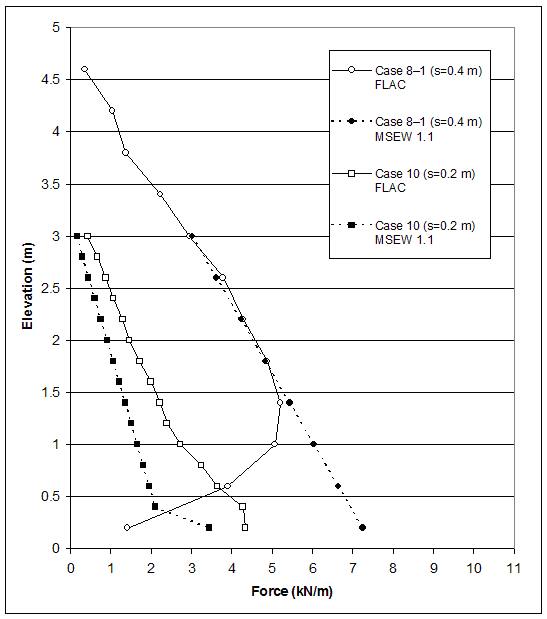
Figure 5.2 Maximum Force in Reinforcement: Comparison of FLAC and AASHTO Results for Case 8–1 (s=0.4 m) and Case 10 (s=0.2 m).
| Elastic |
At Yield in Shear or Volume |
Elastic, Yield in Past |
Figure 5.3 Comparison of FLAC and AASHTO Results for Case 8–1 (s=0.4 m, h=5.0 m, l=1.5 m): (a) MSEW 1.1 Analysis: Critical Slip Surface from Compound Stability Analysis; (b) FLAC Analysis: Failure Zones Distribution at the Critical State.
| Elastic |
At Yield in Shear or Volume |
Elastic, Yield in Past |
Figure 5.4 Comparison of FLAC and AASHTO Results for Case 10 (s=0.2 m, h=3.2 m, l=1.5 m): (a) MSEW 1.1 Analysis: Critical Slip Surface from Deep-Seated Stability Analysis; (b) FLAC Analysis: Failure Zones Distribution at the Critical State.
NOTE: Line A is located 0.15 m behind the facing. Section C is located 0.15 m behind the end of reinforcement.
Figure 5.5 Stress Distributions along Sections A and C for Failure State of Case 1 (s=0.2 m, h=8.6 m, l/h=0.17).
NOTE: Line A is located 0.15 m behind the facing. Section C is located 0.15 m behind the end of reinforcement.
Figure 5.6 Stress Distributions along Sections A and C for Critical State of Case 1 (s=0.2 m, h=8.6 m, l/h=0.17).
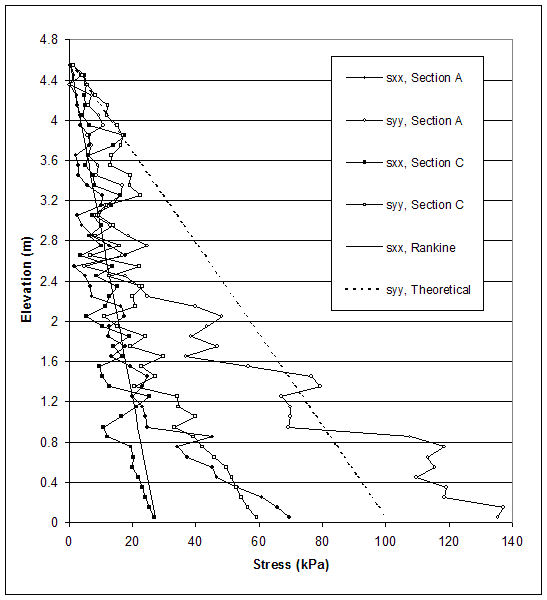
NOTE: Line A is located 0.15 m behind the facing. Section C is located 0.15 m behind the end of reinforcement.
Figure 5.7 Stress Distributions along Sections A and C for Failure State of Case 2 (s=0.6 m, h=4.6 m, l/h=0.33).
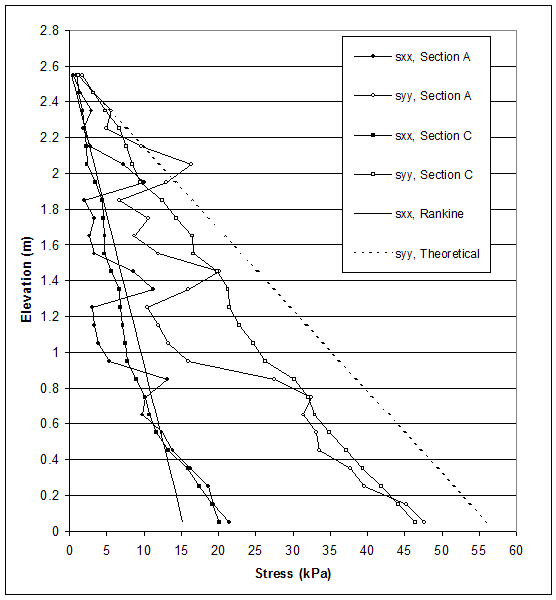
NOTE: Line A is located 0.15 m behind the facing. Section C is located 0.15 m behind the end of reinforcement.
Figure 5.8 Stress Distributions along Sections A and C for Critical State of Case 2 (s=0.6 m, h=4.6 m, l/h=0.33).
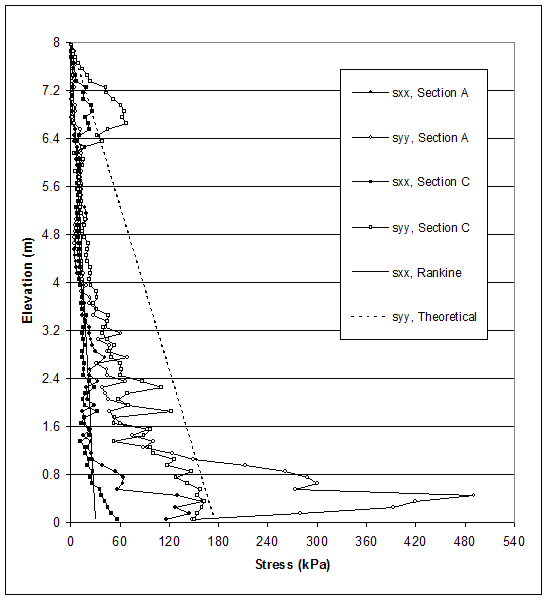
NOTE: Line A is located 0.15 m behind the facing. Section C is located 0.15 m behind the end of reinforcement.
Figure 5.9 Stress Distributions along Sections A and C for Failure State of Case 8–1 (s=0.4 m, h=8.0 m, l/h=0.19).
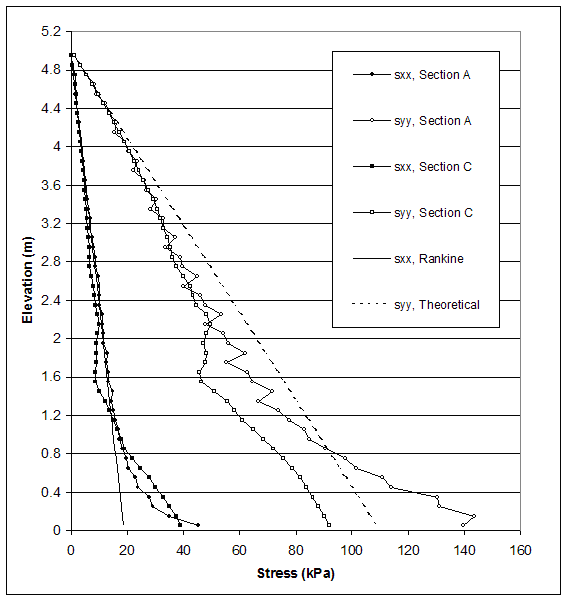
NOTE: Line A is located 0.15 m behind the facing. Section C is located 0.15 m behind the end of reinforcement.
Figure 5.10 Stress Distributions along Sections A and C for Critical State of Case 8–1 (s=0.4 m, h=8.0 m, l/h=0.19).
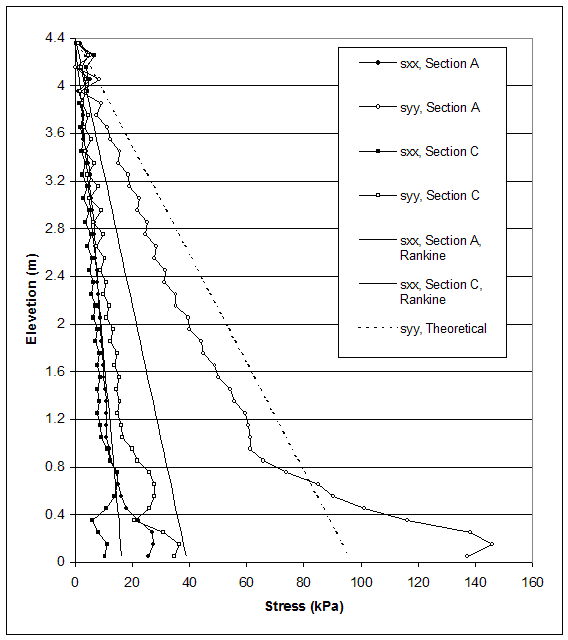
NOTE: Line A is located 0.15 m behind the facing. Section C is located 0.15 m behind the end of reinforcement.
Figure 5.11 Stress Distributions along Sections A and C for Failure State of Case 10 (s=0.2 m, h=4.4 m, l/h=0.34).
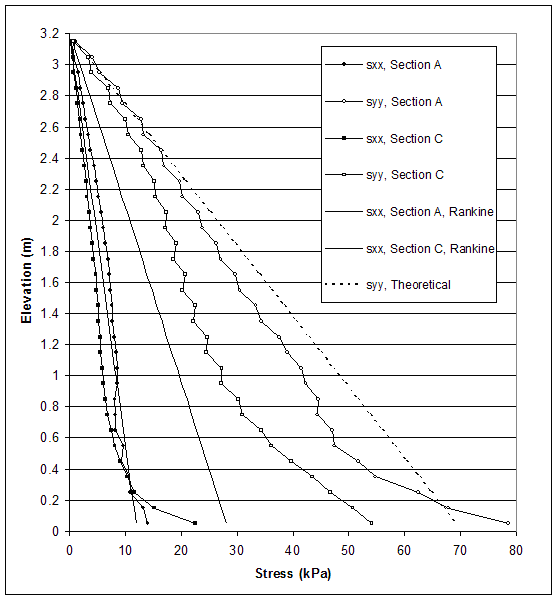
NOTE: Line A is located 0.15 m behind the facing. Section C is located 0.15 m behind the end of reinforcement.
Figure 5.12 Stress Distributions along Sections A and C for Critical State of Case 10 (s=0.2 m, h=4.4 m, l/h=0.34).
| Input Data | Case 1 (s=0.4 m) |
Case 2 (s=0.6 m) |
Case 8–1 (s=0.4 m) |
Case 10 (s=0.2 m) |
|
|---|---|---|---|---|---|
| Wall height (m) | 6.0 | 2.6 | 5 | 3.2 | |
| Reinforcement spacing (m) | 0.4 | 0.6 | 0.4 | 0.2 | |
| Reinforcement length (m) | 1.5 | 1.5 | 1.5 | 1.5 | |
| Embedded depth (m) | 0 | 0 | 0 | 0 | |
| Reinforced soil | Unit weight (kN/m3) | 22 | 22 | 22 | 22 |
| Angle of friction (deg) | 45 | 35 | 45 | 45 | |
| Retained soil | Unit weight (kN/m3) | 22 | 22 | 22 | 22 |
| Angle of friction (deg) | 45 | 35 | 45 | 25 | |
| Foundation soil | Unit weight (kN/m3) | 22 | 22 | 22 | 22 |
| Angle of friction (deg) | 45 | 35 | 45 | 25 | |
| Cohesion (kPa) | 1000 | 1000 | 1000 | 0 | |
| Ultimate strength of geotextile reinforcement kN/m) in layer | 1 | 2.4 | 2.2 | 1.4 | 4.3 |
| 2 | 8.2 | 2.8 | 3.9 | 4.3 | |
| 3 | 9.6 | 1.2 | 5.1 | 3.6 | |
| 4 | 9 | 1 | 5.2 | 3.2 | |
| 5 | 7.1 | – | 4.9 | 2.7 | |
| Soil-geotextile angle of friction (deg) | 35 | 35 | 35 | 35 | |
NOTE: The following cases were selected to represent different failure modes identified with FLAC:
| Output Data | Case 1 (s=0.4 m) |
Case 2 (s=0.6 m) |
Case 8–1 (s=0.4 m) |
Case 10 (s=0.2 m) |
|
|---|---|---|---|---|---|
| Factor of safety against direct sliding | 2.914 | 2.981 | 3.497 | 1.08 | |
| Factor of safety against overturning | 1.09 (1.0) | 3.68 | 1.57 | 1.62 | |
| Factor of safety against compound failure | – | – | 1.005 (1.0) | – | |
| Factor of safety against deep-seated failure | – | – | – | 1.047 (1.0) | |
| Eccentricity (m) | 0.69 | 0.2 | 0.48 | 0.46 | |
| Factor of safety against bearing capacity | 86.4 | 594.9 | 449.1 | 0.38 | |
| Meyerhof stress (kPa) | 1553.95 | 78.51 | 301.8 | 183.2 | |
| Ultimate bearing capacity (kPa) | 134254.9 | 46701 | 135508.6 | 69 | |
| Number of layers taken into account in internal stability analysis |
9 | 4 | 9 | 15 | |
| Tmax reinforcement force from internal stability analysis (kN/m) in layer |
1 | 8.8 (2.4) | 7.0 (2.2) | 7.2 (1.4) | 3.5 (4.3) |
| 2 | 8.2 (8.2) | 6.4 (2.8) | 6.6 (3.9) | 2.1 (4.3) | |
| 3 | 7.5 (9.6) | 4.3 (1.2) | 6.0 (5.1) | 2.0 (3.6) | |
| 4 | 6.9 (9.0) | 2.4 (1.0) | 5.4 (5.2) | 1.8 (3.2) | |
| 5 | 6.3 (7.1) | – | 4.8 (4.9) | 1.7 (2.7) | |
NOTE: Values in brackets correspond to FLAC calculations.
| Case | Spacings(m) | Slip Surface Slope (deg) | |||||
|---|---|---|---|---|---|---|---|
| Theoretical Value | Failure State | Critical State | |||||
| Rankine | Coulomb | FLAC Value |
Slip Surface Type |
FLAC Value |
Slip Surface Type |
||
| 1 | 0.2 | 67.5 | 63.4 | 50 | External | 54 | External |
| 0.4 | 67.5 | 63.4 | 48 | External | 58 | External | |
| 0.6 | 67.5 | 63.4 | 50 | Compound | 65 | Compound | |
| 0.8 | 67.5 | 64.8 | 43 | Internal | 62 | Internal | |
| 1.0 | 67.5 | 64.8 | 62 | Internal | 62 | Internal | |
| 2 | 0.2 | 62.5 | 57.4 | 43 | External | 45 | External |
| 0.4 | 62.5 | 57.4 | 42 | External | 50 | External | |
| 0.6 | 62.5 | 58.1 (57.4) | 42 | External | 65 | Internal | |
| 0.8 | 62.5 | 58.1 | 51 | Internal | 63 | Internal | |
| 3 | 0.2 | 57.7 | 57.3 | 43 | Compound | 45 | Compound |
| 0.4 | 57.7 | 51.3 | 45 | Compound | 34 | Compound | |
| 0.6 | 57.7 | 51.3 (50.3) | 43 | Compound | Not Clear | Internal | |
| 0.8 | 57.7 | 50.3 | 39 | Internal | Not Clear | Internal | |
| 4 | 0.2 | 67.5 | 63.4 | 58 | External | 60 | External |
| 0.4 | 67.5 | 63.4 | 53 | External | 59 | External | |
| 0.6 | 67.5 | 64.8 | 60 | External | 60 | External | |
| 0.8 | 67.5 | 64.8 | 59 | Internal | 58 | Internal | |
| 5 | 0.2 | 62.5 | 57.4 | 46 | External | 47 | External |
| 0.4 | 62.5 | 57.4 | 48 | External | 57 | External | |
| 0.6 | 62.5 | 57.4 (58.1) | 52 | External | Not Clear | Internal | |
| 0.8 | 62.5 | 58.1 | 68 | Internal | 49 | Internal | |
| 6 | 0.2 | 57.5 | 51.3 | 36 | External | 44 | External |
| 0.4 | 57.5 | 50.3 | 37 | External | Not Clear | Not Clear | |
| 7 | 0.6/0.2 | 62.5 | 58.1 | 48 | External | 46 | External |
| 8–1 | 0.4 | 67.5 | 51.3 (64.8) | 46 | Compound | 53 | Compound |
| 8–2 | 0.4 | 62.5 | 57.4 | 45 | Compound | 45 | Compound |
| 8–3 | 0.2 | 57.2 | 51.3 | 42 | Compound | 41 | Compound |
| 9 | 0.2 | 67.5 | 63.4 | 51 | External | 52 | External |
| 10 | 0.2 | 57.2 | 51.3 | 51 | External | 62 | External |
| 0.4 | 57.2 | 51.3 | 48 | External | 54 | External | |
| 0.6 | 57.2/67.5 | 64.8 | 51 | External | 57 | Internal | |
| 0.8 | 67.5 | 64.8 | 44 | Internal | 63 | Internal | |
| 11 | 0.2 | 67.5 | 63.4 | 53 | External | 57 | External |
| 12 | 0.2 | 67.5 | 63.4 | 51 | External | 56 | External |
| 0.6 | 62.5 | 57.4 | 49 | Compound | 50 | Compound | |