Field Observations and Evaluations of Streambed Scour At Bridges
CHAPTER 5: LOCAL SCOUR AT PIERS
GENERAL
Laboratory research has dominated the field of local scour at bridge piers. Such research is limited by the range of hydraulic conditions typically tested and is conducted primarily under steady-flow conditions with uniform bed material. Relations and predictive equations developed from laboratory research have not been adequately verified by use of field data. This report compares the results of predictive equations to field measurements of local pier scour. Relations developed in the laboratory are evaluated for application to conditions typical of natural streams. The effects of nonuniform bed material and other explanatory variables on field measurements of scour are investigated by use of a partial residual analysis.
A complete evaluation of all equations for the prediction of local scour around bridge piers is beyond the scope of this investigation; however, 26 commonly cited equations are compared with field measurements of scour to evaluate their potential for use as design equations. A design equation should accurately predict scour; however, predicting sediment transport and scour accurately is very difficult. If a design equation predicts too little scour, the bridge could be under-designed and the traveling public put at risk. A good design equation should be as accurate as possible, but when in error the equation should overpredict scour to ensure that the design is always safe.
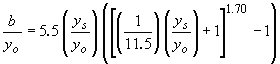
Results from laboratory investigations of the effects of velocity, approach flow depth, pier width, and bed material properties on the depth of local pier scour are compared with similar plots of field data. Laboratory research has shown a relation between relative depth of scour (ys/b) and flow intensity (Vo/Vc) for ripple- and nonripple-forming sediments and for uniform and nonuniform sediments. (See references 29, 43, 44, and 45.) Melville and Sutherland investigated the effect of relative flow depth (yo/b) on relative depth of scour (ys/b).(2) The effect of relative sediment size (b/D50) on relative scour depth for relative sediment sizes ranging from 2 to 1,000 has also been studied in the laboratory.(43,46,47) Nonuniform sediments consistently have resulted in less relative scour than similar uniform sediments used in laboratory investigations. (See references 45, 46, 47, and 48.) The applicability of these relations and the range of the laboratory data are evaluated by plotting field data with the same combination of variables as the laboratory data.
Analysis of bridge scour field data is more complicated than analysis of laboratory data because in the field all explanatory variables have the potential to vary at the same time. In the laboratory, all explanatory variables can be held constant and a specific variable systematically changed to study its effect. These controlled laboratory investigations, however, may not adequately describe the variability and interaction of variables present in natural conditions. In the field, all variables can change and interact; the effect of individual variables cannot be easily isolated. Although variables and dimensionless parameters from field data can be compared with laboratory data, the effect of all variables is present in the field data. For example, in a comparison of the effects of velocity, the field data will also include the effects of flow depth, bed material properties, pier shape, and pier size. Most of the laboratory relations account for pier size by plotting normalized scour depth (ys/b); however, if the pier size does not affect scour linearly, then the relation has been distorted by the selection of the parameters.
Bed material size may affect local scour through its effect on bed forms and on the energy required to transport grains from the scour hole. Initially, the energy available to erode bed material is higher at the pier than in the approach section. As erosion occurs at the pier, the scour hole forms and deepens. The energy available to transport sediment decreases as the scour hole deepens until equilibrium with upstream transport is achieved. Insufficient energy to transport a larger particle should be achieved at a shallower depth of scour than the depth needed for a smaller particle; thus, sediment size affects the depth of scour. Laboratory research is typically conducted at a constant Vo/Vc ratio: as the bed material size increases, so does the approach velocity. These laboratory conditions are not representative of most field conditions. The effect of bed material properties on the depth of scour is evaluated by comparing subsets of the field data that represent conditions similar to those modeled in the laboratory with the results of laboratory investigations. In addition, an analysis of the residuals generated by comparing the computed scour from the HEC-18 equation with field data is used to evaluate the importance and relation of bed material properties on the maximum depth of scour. Furthermore, because laboratory research has shown a significant effect of bed forms on the depth of scour in ripple-forming sediments, the difference in the depth of scour in ripple- and nonripple-forming sediments is evaluated using field data.
The depth of scour in nonuniform sediments is often less than the depth of scour in uniform sediments. In uniform sediments, the energy is sufficient to transport the material (live bed) or it is insufficient to transport the material (clear water). In nonuniform sediments, the energy of the flow may only be sufficient to transport some material, allowing the coarser material to armor the bed. Armoring can occur in both the approach section (reducing the sediment transport to the scour hole) and in the scour hole (limiting the depth of the hole). The combination of armoring that occurs depends on the energy available for transport in the approach, the energy available for transport at the pier, and the gradation of the bed material. If the armoring occurs in the approach and no armoring occurs in the scour hole, the scour can be deeper than for identical conditions in uniform sediments because the armoring of the approach has reduced the sediment supply to the scour hole. If armoring of the scour hole occurs, the depth of scour is likely to be less than that for uniform sediments regardless of the transport condition at the approach (live bed or clear water). The traditional classification of live bed and clear water conditions is insufficient to describe the conditions that may occur in nonuniform bed material.
SUMMARY OF FIELD DATA
The 493 local pier scour measurements currently available in the BSDMS were filtered to ensure that the data used for this report met basic criteria necessary to complete the objectives of this analysis (for a complete listing of the data, see appendix A). The data collection techniques typically limited the data to cross sections along the upstream and downstream edges of the bridge. For a pier aligned with the flow, maximum scour typically occurs at the nose of the pier; therefore, the data collection method previously described measures maximum scour.
Laboratory research indicates that for a pier skewed to the flow, maximum scour can occur along the sides of the pier rather than at the nose.(8) Because data were seldom collected along the sides of the piers, all measurements where the flow was not aligned with the pier were removed from the data set. Where there are measurements along the upstream and downstream edges of the bridge, only the maximum depth of scour is used. Debris accumulations on the piers have an unknown effect on local scour and often make measurement of maximum scour impossible. The effect of debris on the depth of scour (unknown, insignificant, moderate, substantial) was noted for each measurement. All measurements where the effect of debris on the depth of scour was rated "substantial" were removed from the data set. The time required for scour to reach its maximum depth in cohesive material is considerably longer than in noncohesive material.(6) Therefore, observations with scour in cohesive material also were removed from this analysis.
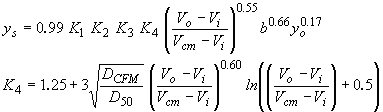
 (2) (2)
where
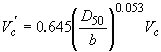
V'c is the approach velocity corresponding to critical velocity and incipient scour in the accelerated flow region at the pier;
D50 is the mean grain size of the bed material;
b is the pier width; and
Vc is the critical (incipient-transport) velocity for the D50-size particle.
Equation 2 was used with Neill's formulation of the critical velocity equation: (23)
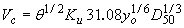 (3) (3)
where is the Shield's parameter; is the Shield's parameter;
Ku is 1.0 for SI units and 1.81 for customary English units;
yo is the depth of flow; and
D50 is the median grain size.
to compute the critical approach velocity (V'c) for transport of the D50 grain size at the pier. All measurements having an approach velocity (Vo) less than the critical approach velocity for transport at the pier (V'c) were removed from the data set.
The appropriate value for the Shield's parameter, , has been a topic of considerable research and discussion, with no conclusive answer. Miller et al.(49) and Buffington and Montgomery(50) compiled and analyzed all available data on incipient sediment transport. Both investigations found scatter in the data caused by inconsistencies in the definition of incipient motion, the experimental method utilized, the experimental facility used, and the type of bed material used. According to these studies, the Shield's parameter may vary from 0.02 to 0.086 with a common average value for gravel of about 0.046.(50) Miller et al.(49) presented a method based on Inman(51) that relates grain size to shear velocity; this method is only valid for water at a temperature of 20 °C and for bed material with a specific gravity of 2.65. The method was presented graphically, but has been reduced to equations for the Shield's parameter by Mueller.(5)
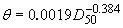 (4) (4)
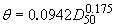 (5) (5)
 (6) (6)
The method is easily applied, provides for variation in the Shield's parameter for smaller grain sizes, and is within the range of variation defined by previous research; therefore, this method was used to evaluate the Shield's parameter needed to estimate the critical velocity for incipient sediment transport.
Of the 493 pier scour measurements in the BSDMS, 266 were selected for this analysis. The criterion that flow be aligned with the pier was satisfied by 322 measurements; 476 measurements satisfied the criterion that debris not be a substantial effect; 488 measurements were in noncohesive material; and 437 measurements satisfied the criterion that the velocity at the pier has to be competent to erode the median particle size of the bed material. Where there were measurements both at the upstream and downstream edges of the bridge, only a single measurement representing the maximum depth of scour was included; thus, 41 measurements were excluded. All criteria were satisfied by 266 measurements, which represent 106 different piers at 53 bridges located in 15 States.
A summary of the selected data and commonly used dimensionless variables is provided in table 2. The maximum and minimum values of the data and of the dimensionless variables represent a range equal to or greater than most laboratory investigations. Unlike laboratory investigations, the distribution of the data cannot be precisely controlled in the field, and the data tend to be grouped near the low end of most of the primary variables.
Table 2. Summary statistics for selected pier scour measurements.
| Variable |
Units |
Number of Points |
Minimum |
25th Quartile |
Median |
75th Quartile |
Maximum |
Mean |
Standard Deviation |
Coefficient of Variation |
Skewness |
| Depth of scour (ys) |
m |
266 |
0.00 |
0.43 |
0.61 |
1.19 |
7.65 |
1.06 |
1.19 |
1.13 |
2.68 |
| Pier width (b) |
m |
266 |
0.38 |
0.88 |
1.13 |
1.52 |
5.52 |
1.53 |
1.11 |
0.73 |
1.88 |
| Approach velocity (Vo) |
m |
266 |
0.18 |
0.66 |
1.14 |
1.89 |
4.48 |
1.36 |
0.90 |
0.66 |
0.94 |
| Approach depth (yo) |
m |
266 |
0.12 |
2.45 |
4.39 |
6.45 |
20.03 |
4.86 |
3.24 |
0.67 |
1.18 |
| D16 |
mm |
262 |
0.03 |
0.20 |
0.35 |
3.78 |
68.00 |
5.48 |
13.26 |
2.42 |
3.45 |
| D50 |
mm |
266 |
0.15 |
0.48 |
0.74 |
8.00 |
108.00 |
10.61 |
20.74 |
1.95 |
2.75 |
| D84 |
mm |
262 |
0.26 |
1.30 |
2.35 |
29.00 |
233.00 |
22.36 |
39.71 |
1.78 |
2.91 |
| D95 |
mm |
262 |
0.28 |
2.08 |
7.45 |
44.00 |
350.00 |
34.87 |
58.85 |
1.69 |
2.78 |
Gradation coefficient ( g) g) |
- |
262 |
1.20 |
2.03 |
2.30 |
3.65 |
21.80 |
3.21 |
2.27 |
0.71 |
3.17 |
| Drainage area (DA) |
km2 |
192 |
166 |
1197 |
3680 |
9402 |
1805222 |
32706 |
135836 |
4.15 |
11.80 |
| Slope (S) |
m/m |
219 |
0.00010 |
0.00016 |
0.00050 |
0.00105 |
0.00500 |
0.00090 |
0.00103 |
1.14 |
1.96 |
| yo / b |
- |
266 |
0.12 |
1.87 |
3.05 |
5.31 |
13.84 |
3.91 |
2.81 |
0.72 |
1.21 |
| b / D50 |
- |
266 |
8.47 |
129.54 |
1024.54 |
1828.80 |
14224.00 |
2219.03 |
3401.47 |
1.53 |
2.33 |
| ys/ b |
- |
266 |
0.00 |
0.40 |
0.58 |
0.88 |
2.09 |
0.68 |
0.41 |
0.61 |
1.01 |
| Vo / Vc |
- |
266 |
0.43 |
0.75 |
1.14 |
1.53 |
4.92 |
1.32 |
0.84 |
0.64 |
2.15 |
| Vo / (gyo)0.5 |
- |
266 |
0.04 |
0.11 |
0.17 |
0.33 |
0.83 |
0.23 |
0.16 |
0.70 |
1.17 |
EVALUATION OF PUBLISHED EQUATIONS
Discussion of Equations
Local pier scour has been a popular topic of study for many laboratory researchers. A literature review by McIntosh found that more than 35 equations had been proposed for predicting the depth of scour at a bridge pier.(52) Most local scour equations are based on research in laboratory flumes with noncohesive, uniform bed material and limited verification of results with field data.(52) In evaluating and applying scour-prediction equations, it is valuable to know the limitations of the equations, the conditions for which they were developed, how the underlying data were interpreted, and the methods used to develop the equations. Such information about each equation has been previously published in Landers and Mueller,(21) Mueller,(5) and Pritsivelis.(53) The equation, published reference, and the equation name for the 26 equations used in this report are presented in table 3.
The equations presented here were developed to predict the maximum depth of scour; there are three approaches to developing such an equation. The first is to predict the maximum depth of scour that could occur at the bridge pier under any conditions. The second is to predict, as accurately as possible, the maximum depth of scour for a given set of hydraulic and bed material conditions. These equations often are developed by multiple regression analysis and, by definition, underpredict the depth of scour for about one-half of the observations used in the equation development. The third approach is to develop a design equation. A good design equation should accurately predict the depth of scour for a given set of site and flood conditions, but when in error should always err by predicting too much scour.
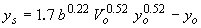
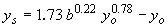
Analysis of how each equation addresses pier width, approach velocity, approach depth, and bed material properties provides an indication of the effect of these variables on the depth of scour. The selected equations are formulated into two patterns. The regime equations are written in the form:
 (7) (7)
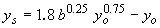
and compute the total depth of flow including local scour. Nonregime equations are written in the form:
 (8) (8)
and compute the depth of local scour only. The pier width is included in more than 75 percent of the equations (table 4). The regime equations have an exponent on pier width between 0.2 and 0.25. The exponent on pier width ranges from 0.6 to 0.75 in more than one-half of the nonregime equations when the pier width could be isolated. The smaller exponents on pier width for the regime equations are justified because pier width should have less effect on the total depth than on the depth of local pier scour. The exponents on approach velocity range from 0.2 to 0.68 and on approach depth from 0.135 to 0.8.This variability indicates that there is a lack of agreement among the equations on the effect of approach depth and velocity on the depth of scour. The median grain size is only included in 11 equations; it can only be isolated in 4 equations, where it has a small negative exponent.
Table 3. Summary of selected local pier scour equations.*
| Name and Reference Number |
Equation |
Equation Number |
| Ahmad(54) |
 |
(9) |
| (55)** |
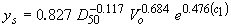 |
(10) |
| Blench-Inglis I(56)** |
 |
(11) |
| Blench-Inglis II(56)*** |
 |
(12) |
| Breusers(57) |
 |
(13) |
| Breusers-Hancu(53) |
 |
(14) |
| Chitale(58) |
 |
(15) |
| Froehlich(13) |
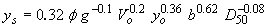 |
(16) |
| Froehlich Design(13) |
 |
(17) |
| HEC-18(59) |
 |
(18) |
| HEC-18-K4(6) |
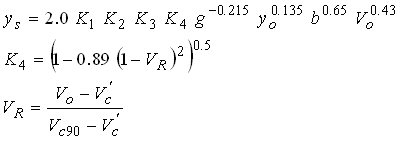 |
(19) |
| HEC-18-K4Mo(1) |
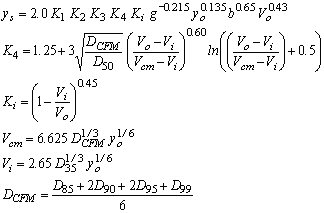 |
(20) |
| HEC-18-K4Mu(5) |
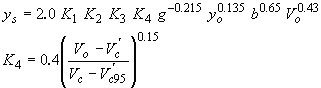 |
(21) |
| Inglis-Poona I(34)** |
 |
(22) |
| Inglis-Poona II(34) |
 |
(23) |
| Larras(4)** |
 |
(24) |
| Laursen I(60) |
 |
(25) |
| Laursen II(61) |
 |
(26) |
| Laursen-Callander(62) |
 |
(27) |
| Melville and Sutherland(2) |
 |
(28) |
| Mississippi(63) |
 |
(29) |
| Molinas(1) |
 |
(30) |
| Shen(9)** |
 |
(31) |
| Shen-Maza(9) |
 |
(32) |
| Sheppard(64) as reported by Alkhalidi(65) |
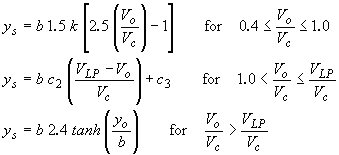 |
(33) |
| c2 |
is a coefficient defined by Sheppard as 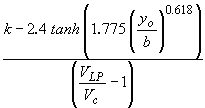
where: tanh is the hyperbolic tangent function |
(34) |
| c3 |
is a coefficient defined by Sheppard as 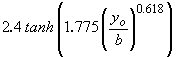 |
(35) |
| k |
is a coefficient defined by Sheppard as 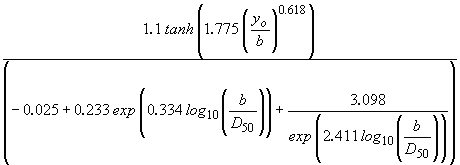 |
(36) |
| Simplified Chinese(3) |
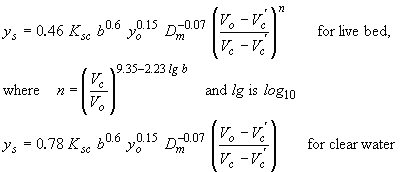 |
(37) |
'*See List of Symbols in the front of the report for definition of symbols not defined in the table.
**Units are English units in feet.
'***Units are English units in feet, except D50, which is in millimeters.
Table 4. Summary of exponents for variables used in selected equations.
| Equation |
Pier Width |
Approach Velocity |
Approach Depth |
D50 |
Other Bed Material |
| Ahmad |
- |
0.667 |
0.667 |
- |
- |
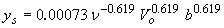
| Arkansas |
- |
0.684 |
- |
-0.117 |
- |
| Blench-Inglis I* |
0.25 |
- |
0.75 |
- |
- |
| Blench-Inglis II* |
0.25 |
0.5 |
0.5 |
-0.125 |
- |
| Breusers |
1.0 |
- |
- |
- |
- |
| Breusers-Hancu |
X |
- |
X |
- |
- |
| Chitale |
- |
X |
X |
- |
- |
| Froehlich |
0.62 |
0.2 |
0.36 |
-0.08 |
- |
| Froehlich Design |
X |
0.2 |
0.36 |
-0.08 |
- |
| HEC-18 |
0.65 |
0.43 |
0.135 |
- |
- |
| HEC-18-K4 |
X |
X |
X |
X |
X |
| HEC-18-K4Mo |
X |
X |
X |
X |
X |
| HEC-18-K4Mu |
X |
X |
X |
X |
X |
| Inglis-Poona I* |
0.22 |
0.52 |
X |
- |
- |
| Inglis-Poona II* |
0.22 |
- |
X |
- |
- |
| Larras |
0.75 |
- |
- |
- |
- |
| Laursen I |
0.7 |
- |
0.3 |
- |
- |
| Laursen II |
X |
- |
X |
- |
- |
| Laursen-Callander |
- |
- |
0.5 |
- |
- |
| Melville and Sutherland |
X |
X |
X |
X |
X |
| Mississippi |
0.6 |
- |
0.4 |
- |
- |
| Molinas |
0.66 |
X |
X |
X |
X |
| Shen |
0.62 |
0.62 |
- |
- |
- |
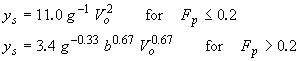
| Shen-Maza Fp<0.2 |
- |
2.0 |
- |
- |
- |
| Shen-Maza Fp>0.2 |
0.67 |
0.67 |
- |
- |
- |
| Sheppard |
X |
X |
X |
X |
- |
| Simplified Chinese |
X |
X |
X |
X |
- |
*Regime equation that in its original form computed total depth including pier scour and approach depth (see equation 7).
X-Equation uses this variable, but the equation is complex, and this variable cannot be algebraically isolated.
Assumptions
Laboratory experiments are designed to isolate specific scour processes; thus, the resulting equations may not account for complex and dynamic field conditions. Some field conditions that effect scour are undefined in the selected equations and assumptions are required to apply the equations. The flow in the field is assumed to be steady state and uniform to allow the application of laboratory-based equations to predict scour at bridges. All equations presented here are used to estimate scour for both live bed and clear water conditions.
Many equations do not include corrections for pier shape, or they include corrections for only a few pier shapes. Pile groups are classified as round-nose or circular piers for equations that do not specify a shape correction for pile groups.(59)However, pile groups are treated as cylinders for the Simplified Chinese equation. Blench-Inglis I and II, Inglis-Poona I and II, Chitale, Ahmad, Shen, Arkansas, Breusers, and Mississippi equations do not include procedures to correct for pier shape, and corrections were not applied in this evaluation. Because the Larras equation specifies only square-nose and circular pier shapes, sharp-nose piers and pile groups are classified as circular piers in this evaluation of the Larras equation.
When it was possible, each equation was used to compute a depth pier scour for each field measurement. Several sites did not have adequate bed material data. The D90 grain size was interpolated from the D84 and D95 grain sizes using log-probability interpolation. The D99 was estimated by extrapolating the D84 and D95 values in log-probability space.If neither D84 nor D95 were reported, equations requiring D90 and D99 were not applied. A water temperature of 20 °C was assumed if no temperature was reported.
Comparison of Predictions with Field Data
This evaluation of the selected equations focuses primarily on the ability of the equations to be used as design equations for different site and flood conditions. The objective is to find an equation that accurately predicts the depth of scour for the specified conditions, but that overestimates the depth of scour when in error. The potential causes for significant inaccuracies or under-predictions are also investigated.
The ability of the equations to accurately predict the depth of scour for the variety of field conditions represented in this data set varies greatly (figure 7). Some equations (Ahmad, Breusers-Hancu, Chitale, Inglis-Poona I, Melville and Sutherland, and Shen-Maza) show trends away from the line of equality, indicating that those equations do not properly represent the processes responsible for local pier scour that occur in the field. Several equations (Arkansas, Blench-Inglis I, Blench-Inglis II, Froehlich, Shen, and Simplified Chinese) underpredict the depth of scour for a significant number of the observations and are not good candidates for design equations. The other equations have some trend along the line of equality with few underpredictions, but they display a broad scatter of data and often do not accurately predict the observed scour.
Back to Top
Previous | Table of Contents | Next
| 

