Field Observations and Evaluations of Streambed Scour At Bridges
ANALYSIS OF REAL-TIME DATA
General
During record flooding in the Minnesota River Basin in April
1997, USGS, in cooperation with FHWA, deployed the USGS bridge scour data
collection team to collect real-time scour (contraction and local) measurements
at contracted bridge openings. An analysis of two sites that were surveyed
during the April 1997 flooding is presented. Both contracted bridges span the
Pomme de Terre River, where an estimated 200-year discharge was measured at the
USGS Appleton gauging station (05294000) located approximately 19 km downstream
of the U.S. Route 12 bridge. The compiled field data (channel and
floodplain bathymetry, water discharge, water-surface elevations, roughness,
and bridge geometry) were used to calibrate a step-backwater model at each
site. The hydraulics and predicted depth of scour based on the calibrated model
were compared with the field measurements.
U.S. Route 12 over the Pomme de Terre River
Site Description
U.S. Route 12 crosses the Pomme de Terre River about 20 km west of Danvers,
MN. The single-span steel-truss structure was constructed in 1933 with
a maximum span length of 26.9 m. The bridge has vertical wall abutments
with wing walls; each abutment and wing wall rests on concrete footings
supported on timber piling. Neither abutment was riprapped, nor were there
any other scour-protection measures. A field investigation conducted in
1995 by a local engineering firm, BRW, Inc., revealed no evidence of significant
scour at the abutment face.(127)
The upstream floodplain consists of a mixture of open
agricultural land with scattered trees and brush, with a park on the upstream
left bank. The area downstream of the bridge is more heavily wooded and is
classified on the USGS topographic map as a wetland area. The streambed
material near the bridge generally consists of fine-grained, organic, silty
sand with some gravel. A sieve analysis of a surficial bed material sample
indicated a median diameter of 0.15 mm. Based on the soil borings and blow
counts documented in the bridge plans, the bed material appears to become
harder and denser as depth increases. Because samples were not collected and
analyzed, it is difficult to ascertain the makeup of the soils at depths below
the surface.
During the April 1997 flood the bridge experienced both contraction and
abutment scour. A large scour hole developed at the right abutment, scouring
below the abutment cutoff wall and resulting in failure of the fill material
behind the abutment. Slumping of the embankment slope and some deformation
of the approach highway were observed. Although scour measurements showed
a scour hole 2 m below the footing of the left abutment, no deformation
was observed near the left abutment. These conditions resulted in closure
of the bridge. Because of the age and scheduled replacement of the bridge,
it was not repaired but was replaced with a new structure after the flood.
Discussion of Field Data
Data were collected during the flood (on April 5 and 9, 1997) at U.S. Route
12 over the Pomme de Terre River. A crewed boat was deployed during the
initial visit on April , 1997. The use of the crewed boat and an ADCP
allowed bathymetry and three-dimensional velocities to be measured at
the bridge and in the approach and exit sections extending about 100 m
upstream and 70 m downstream. Heavy vegetation and submerged obstructions
in the floodplains limited data collection to the main channel. Measurements
on April 9 were limited to data collected from the bridge deck. Channel
bathymetry was measured along the upstream and downstream faces of the
bridge and at selected locations beneath the bridge using an echo sounder
deployed on a knee-board. Velocity magnitudes and water discharge were
measured using a vertical axis current meter. Water-surface elevations
were measured by taping down from the top-of-curb on the bridge both upstream
and downstream, near the left abutment. On April 5, the water-surface
elevation was 310.70 m above National Geodetic Vertical Datum (NGVD) of
1929 at the upstream edge of the bridge, and the total discharge was 141.6
m3/s. By April 9, the water-surface had risen to an elevation
of 311.5 m above NGVD of 1929, and the discharge had increased to 162.8
m3/s.
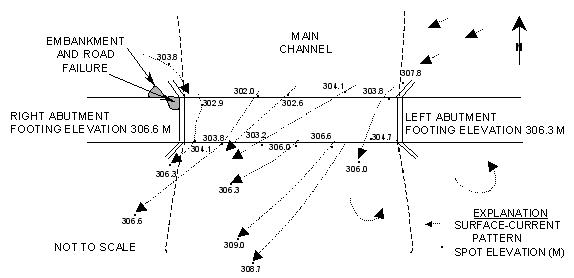
The direction of flow through the bridge was controlled by
the configuration of the upstream floodplains. The channel upstream of the
bridge was straight, but the left floodplain was much wider and carried
considerably more flow than the right floodplain. The flow from the left
floodplain skewed the flow through the bridge opening to about 50° on average.
Figure 33 is a sketch of spot elevations and the flow direction on April
9, which shows the severe skew of the flow to the bridge opening.
The appropriate reference surface was determined from an
analysis of cross sections collected by BRW, Inc., on June 5, 1995 and by the
USGS during the flood on April 5, 1997. On these two dates, cross sections
collected approximately 90 m upstream from the bridge showed only about 0.15 m
difference in the channel-bottom elevation. The flood cross section was the
lower of the two. Downstream from the bridge, the cross section surveyed on
June 5, 1995 (approximately 23 m downstream) had less than 0.3 m in
variation when compared with the cross section surveyed on April 5, 1997
(approximately 61 m downstream), but was 0.5 m higher than the cross section
surveyed on April 5, 1997 (approximately 30 m downstream). It is possible that
the April 5, 1997, cross section could have been affected by the scour at the
bridge section; thus, it was not considered in setting the reference surface.
The WSPRO bridge section surveyed by BRW, Inc., on June 5, 1995, showed from
0.3 to 0.6 m of abutment scour in the cross section; however, the center of the
channel at the bridge appeared to be representative of consistent channel slope
from the upstream section to the downstream section. Because little general
scour was observed at the upstream and downstream sections, the
mean elevation of the unscoured portion of the WSPRO bridge section (elevation
307.9 m) was used as the contraction scour reference surface.
|
Figure 33. Illustration
of U.S. Route 12 over Pomme de Terre River, Minnesota, showing spot
elevations and surface current patterns on April 9, 1997. (Elevations
are in meters referenced to NGVD of 1929.) |
A summary of the contraction scour data is shown in table
16. The contracted section on April 5, 1997, was measured under the bridge from
data collected by an ADCP. The maximum erosion of the streambed was 2.3 m from
the defined reference surface; however, when the entire streambed below the
bridge was averaged the depth of contraction scour was only 0.9 m. The
hydraulic data presented for April 5, 1997, were collected with the ADCP. The
ADCP data had a significant amount of invalid data that were estimated in final
processing. Channel banks were not clearly delineated in the approach section,
creating a degree of uncertainty in the approach discharge. Overall, it is
suspected that the approach discharge is ±20 percent, and the total discharge
is ±10 percent. Measurements made with a sounding weight on April 9, 1997, were
collected during the discharge measurement along the upstream face of the
bridge, and no approach data are available. An echo sounder mounted on a
knee-board was also used to make measurements on April 9, 1997. The board was
floated from upstream to downstream under the bridge; the measurements reflect
the depths at the upstream or downstream face of the bridge.
Table
16. Summary of contraction scour measurements at U.S. Route 12 over the
Pomme de Terre River in Minnesota.
| Measurement
Number |
Date |
Location |
Equipment |
Scour Depth
(m) |
Accuracy
(m) |
|
| 1 |
4/5/97 |
Centerline |
ADCP |
0.9 |
0.6 |
|
| 2 |
4/9/97 |
Upstream |
Sounding weight |
3.2 |
0.6 |
|
| 3 |
4/9/97 |
Upstream |
Echo
sounder |
3.8 |
0.6 |
|
| 4 |
4/9/97 |
Downstream |
Echo
sounder |
1.4 |
0.6 |
|
| |
Contracted Section |
Uncontracted Section |
| |
Width (m) |
Depth (m) |
Discharge (m3/s) |
Average Velocity (m/s) |
Width (m) |
Depth (m) |
Discharge (m3/s) |
Average Velocity (m/s) |
| 1 |
26.8 |
3.7 |
142 |
1.5 |
21.3 |
2.4 |
51.0 |
1.0 |
| 2 |
26.8 |
7.3 |
163 |
0.8 |
- |
- |
- |
- |
| 3 |
26.8 |
7.2 |
163 |
0.9 |
- |
- |
- |
- |
| 4 |
26.8 |
5.3 |
163 |
1.2 |
- |
- |
- |
- |
The reference surface used to determine the depth of abutment scour was the
concurrent ambient bed; therefore, the depth of abutment scour reported
is additional local scour below the depth of contraction scour (table
17). The data collected on April 5, 1997, were collected with an ADCP
using a weighted average of all four beams as the measured depth. Because
a weighted average was used, it is possible that the local abutment scour
was not accurately measured, and no values are reported. The cross sections
measured on April 9, 1997, all showed a similar pattern with abutment
scour holes on each side and a sharp mound in between the scour holes
but skewed toward the left bank (figure 34). It appears that the abutment
scour holes may have overlapped. The highest elevation in the center of
the cross section was subtracted from the reference surface to obtain
the depth of contraction scour. The abutment scour was reported as the
depth below the highest elevation in the center of the cross section.
All velocities presented in table 17 were from the discharge measurement
made along the upstream side of the bridge. Although no abutment scour
was observed on April 5, 1997, the velocities at the abutments were much
higher (left = 1.6 m/s, and right = 1.8 m/s).
Table
17. Summary of abutment scour data for U.S. Route 12 over the Pomme de
Terre River in Minnesota.
| Date |
Abutment |
Location |
Equipment |
Scour Depth (m) |
Accuracy (m) |
Embankment Length
(m) |
Velocity at Abutment
(m/s) |
Depth at Abutment
(m) |
| 4/9/97 |
Right |
Upstream |
Sounding weight |
2.4 |
0.6 |
307 |
1.3 |
9.1 |
| 4/9/97 |
Right |
Upstream |
Echo sounder |
2.1 |
0.6 |
307 |
1.3 |
9.4 |
| 4/9/97 |
Right |
Downstream |
Echo sounder |
3.4 |
0.6 |
307 |
1.3 |
8.2 |
| 4/9/97 |
Left |
Upstream |
Sounding weight |
0.9 |
0.6 |
121 |
1.2 |
7.6 |
| 4/9/97 |
Left |
Upstream |
Echo sounder |
0.5 |
0.6 |
121 |
1.2 |
7.6 |
| 4/9/97 |
Left |
Downstream |
Echo sounder |
1.8 |
0.6 |
121 |
1.2 |
6.7 |
Model Calibration
The HEC-RAS model, a one-dimensional step-backwater model, was calibrated to
represent the field hydraulics as accurately as possible. The bathymetry from
the April, 1997, flood was used to build the calibration models for the two
sets of data (April 5 and 9, 1997). Because bathymetry data on April 9, were
limited to the upstream and downstream edges of the bridge, the cross sections
collected on April 5, were used to build the HEC-RAS model for April 9. The
majority of the floodplain bathymetry utilized in building the models was taken
from a full valley section found in the original bridge plans and adjusted to
be consistent with topographic maps.
The water-surface elevation observed in the field rose 0.76 m between April
5 and 9. The model only showed a 0.3 m change and was unable to reproduce the
observed change without unreasonable changes to the model input. This large
hydraulic variation may be attributed to the U.S. Route 12 bridge reach being
under a backwater condition because of some unidentified downstream condition.
Large ice drifts were observed during both site visits, indicating the potential
for the formation of a debris and (or) ice dam downstream of the data collection
area. Analysis of the Appleton gauging station records was of little assistance
because the gage was washed out on April 6, 1997, by the failure of a small
upstream dam. The water-surface elevation at the upstream side of County Route
22 located about 10 km upstream changed only 0.2 m over the same period; therefore,
the model was considered adjusted despite the apparent discrepancy with the
water-surface elevation observed on April 9.
| 
Figure 34. Measured cross sections
at U.S. Route 12 over the Pomme de Terre River in Minnesota.
|
One of the most important factors in using one-dimensional
models at contracted bridges is the ability for the model to accurately
represent the velocity distribution laterally across the stream and floodplain.
Figures 35 and 36 depict how the velocity distribution varied between the model
and field measurements, using the geometry from April 5 and 9, 1997. The distribution
shown in figure 35 reveals that the flow in the field was indeed skewed
toward the right abutment. HEC-RAS did not duplicate this skewed flow
pattern, but rather computed a relatively uniform flow distribution across
the cross section because the model assigned flow tubes of equal conveyance
through the geometrically uniform bridge section. For the scoured channel
bathymetry, HEC-RAS did a better job of reproducing the observed velocity
distribution (figure 36), although the model does not recognize the
region of reverse flow that occurred adjacent to the left abutment. The
HEC-RAS computed velocities are greater near the deeply scoured region
adjacent to the right abutment because the slope and roughness are constant
across the cross section, so the conveyance becomes dependent upon the
depth of flow.
 Figure 35. Comparison of observed and model velocity distributions
at U.S. Route 12 over the Pomme de Terre River, Minnesota, for April
5, 1997.
Figure 35. Comparison of observed and model velocity distributions
at U.S. Route 12 over the Pomme de Terre River, Minnesota, for April
5, 1997. |
Figure 36. Comparison of observed and model
velocity distributions at U.S. Route 12 over the Pomme de Terre
River, Minnesota, for April 9, 1997.
|
Assessment of Scour Computations
The calibrated model was used to assess how accurately the scour for this
flood could have been predicted. The bathymetry in the calibrated model
was replaced with the original bathymetry extracted from the BRW, Inc.,
WSPRO model, which represented the pre-flood condition. The discharges from
both April 5 and 9, were then run through the HEC-RAS model with the original
bathymetry to determine the hydraulic parameters required to compute scour
at the bridge. The contraction scour was computed in HEC-RAS by allowing
the model to use the default equation (live bed or clear water) depending
upon the hydraulic conditions. Table 18 compares the observed contraction
scour to that computed by the model.
The computed depth of contraction scour was less than the observed value for
all measurements. The contraction scour observed on April 9, 1997, may
not be typical live bed contraction scour because depth of contraction
scour could be affected by overlapping abutment scour holes. The abutment
scour was computed in HEC-RAS by both the Froehlich equation and the Hydraulic
in the River Environment (HIRE) equation, which are the two equations
recommended in HEC-18. The HIRE equation is only applicable (but not required)
if the embankment length-to-flow depth ratio at the abutment is greater
than 25. In this case, the embankment to flow depth (L/a)
ratio is 33. Table 19 compares the observed abutment scour to that computed
by the model.
The data summarized in table 19 show the overprediction of scour that is common
for abutment scour computations. Although the abutment scour equations
overpredicted the local scour and the contraction scour equation underpredicted
the contraction scour (table 18), when added together they predicted the
total scour with reasonable accuracy and actually underpredicted the scour
observed at the upstream edge of the bridge on April 9, 1997. These are
somewhat surprising results that should be viewed with caution because
the skew of the flow through the bridge could not be accounted for in
the one-dimensional model, and the individual components were both in
error. The agreement, therefore, may be somewhat coincidental.
Table
18. Comparison of observed to computed contraction scour at U.S. Route
12 over the Pomme de Terre River in Minnesota.
| Date |
Location
(Edge of Bridge) |
Equation |
Depth
of Scour (m) |
| Computed |
Observed |
| 4/5/97 |
Upstream |
Live bed |
0.4 |
0.9 |
| 4/9/97 |
Upstream |
Live bed |
0.6 |
3.8 |
| 4/9/97 |
Downstream |
Live bed |
0.6 |
1.4 |
Table
19. Comparison of observed to computed abutment and total scour at U.S.
Route 12 over the Pomme de Terre River in Minnesota.
|
|
|
|
Observed |
Based
on Froehlich Equation |
Based on HIRE Equation |
| Date |
Abutment |
Location
(Edge of Bridge) |
Equipment |
Local
Scour Depth (m) |
Total
Scour Depth (m) |
Local
Scour Depth (m) |
Total
Scour Depth (m) |
Local
Scour Depth (m) |
Total
Scour Depth (m) |
| 4/9/97 |
Right |
Upstream |
Sounding weight |
2.4 |
5.6 |
4.6 |
5.2 |
10.8 |
11.4 |
| 4/9/97 |
Right |
Upstream |
Echo sounder |
2.1 |
5.9 |
4.6 |
5.2 |
10.8 |
11.4 |
| 4/9/97 |
Right |
Downstream |
Echo sounder |
3.4 |
4.8 |
4.6 |
5.2 |
10.8 |
11.4 |
| 4/9/97 |
Left |
Upstream |
Sounding weight |
0.9 |
4.1 |
4.0 |
4.6 |
5.2 |
5.8 |
| 4/9/97 |
Left |
Upstream |
Echo sounder |
0.5 |
4.3 |
4.0 |
4.6 |
5.2 |
5.8 |
| 4/9/97 |
Left |
Downstream |
Echo sounder |
1.8 |
3.2 |
4.0 |
4.6 |
5.2 |
5.8 |
Swift County Route 22 over the Pomme de Terre River
Site Description
Swift County Route 22 crosses the Pomme de Terre River near Artichoke Lake,
MN, and is located 10 km upstream from the U.S. Route 12 bridge. This
bridge has two piers in the main channel with the abutments set at the
edge of the main channel. The spill-through slopes at the abutments were
protected by riprap and formed the banks of the main channel. The bridge
is located in a very sinuous reach of the river with two large meanders
immediately upstream and downstream of the bridge (figure 37). The floodplains
are composed of farmland and forest.
During the flooding in April 1997, the USGS visited this site three times.
During all three visits, the floodplain flow was concentrated in the right
floodplain. This concentration of flow in the right floodplain is likely
caused by the channel alignment upstream of the bridge. No defined point
of reattachment along the right embankment was found during the flood.
Flow was toward the main channel along the entire length of the right
embankment. The flow separated from the right embankment, nearly perpendicular
to the main channel flow, and joined the main flow just left of the rightmost
pier (figure 38). During the visit on April 5, the flow from the right
floodplain was so intense that a standing wave formed upstream of the
bridge where the floodplain and main channel flow began mixing. The area
from the rightmost pier to the right abutment was primarily slack and
reverse flow. The depth of flow at the right abutment progressively deepened
from 4.5 m on April 4, to 6 m on April 9. On April 9, a portion of the
right embankment slumped, forcing Swift County officials to temporarily
close the bridge until riprap was placed to protect the bridge.
 Figure 37. Plan view of Swift County Route 22 over the Pomme
de Terre River, Minnesota (no scale).
Figure 37. Plan view of Swift County Route 22 over the Pomme
de Terre River, Minnesota (no scale). |
 Figure 38. Sketch of flow conditions at Swift County Route
22 over the Pomme de Terre River, Minnesota (not to scale).
Figure 38. Sketch of flow conditions at Swift County Route
22 over the Pomme de Terre River, Minnesota (not to scale). |
Discussion of Field Data
Data collection efforts were restricted to data that could
be collected from the bridge deck for all three site visits during the flood
(April 4, 5, and 9, 1997). All bathymetry data were collected by floating an
echo sounder attached to a knee-board across the river; the sounder was
controlled by a hand line from the bridge. The board was allowed to float
downstream; streambed elevations were collected as far as 30 m downstream from
the bridge. Data collected upstream of the bridge were restricted to the
upstream edge of the bridge deck and the area around the upstream end of the
right wing wall. Data could not be collected in the floodplains because of
heavy vegetation. Velocity magnitudes and water discharge were measured during
two of the three site visits using a vertical-axis current meter deployed along
the upstream edge of the bridge. Water-surface elevations were measured at the
upstream edge of the bridge from the top of the bridge deck between the left
most pier and the left abutment. Table 20 summarizes the hydraulic data
collected during the flood. Additional bathymetry data were collected 21 m
upstream from and 30 m downstream from the bridge after the flood during a
low-water site visit on July 15, 1997. Figure 39 shows the elevation and
geometry changes experienced by the streambed at the bridge during the period
of data collection.
The rightmost pier may have had some effect on the depth of scour at the right
abutment, yet it is difficult to determine the pier's effect on the depth
of local abutment scour. Limited measurements upstream of the rightmost
pier showed the scour hole extended beyond the influence of the pier.
The effect of the abutment is believed to be the dominant scouring factor;
therefore, all scour is credited to the abutment with none reported for
the pier. The observed velocity in the area at the right abutment dropped
considerably as the scour-hole depth increased. The velocity at the left
abutment held steady through the data collection period, as did the depth
and shape of the scour hole. All abutment scour measurements were collected
from the upstream edge of the bridge.
Table
20. Summary of hydraulic data collected at Swift County Route 22 over
the Pomme de Terre River in Minnesota.
| Date |
Water-Surface
Elevation (m, NGVD of 1929) |
Discharge
(m3/s) |
Velocity
(m/s) |
| Upstream |
Downstream |
Average |
Maximum |
| 4/4/97 |
317.02 |
316.93 |
- |
- |
- |
| 4/5/97 |
317.15 |
317.06 |
132 |
1.3 |
2.5 |
| 4/9/97 |
317.34 |
- |
146 |
1.2 |
1.8 |
 Figure 39. Cross sections collected along the upstream edge
of Swift County Route 22 over the Pomme de Terre River, Minnesota.
Figure 39. Cross sections collected along the upstream edge
of Swift County Route 22 over the Pomme de Terre River, Minnesota.
|
Contraction scour is typically computed as the difference in
average bed elevation between the uncontracted and contracted sections,
adjusted for bed slope. Because field measurements could not be collected in
the uncontracted section during the flood, a cross section collected in 1991
and included in the bridge plans was used as a reference surface. All
contraction scour measurements were made along the upstream edge of the bridge.
As shown in figure 39, there is less than 0.3 m difference in the bed
elevation near the center of the channel (beyond the limits of the abutment
scour holes) between the 1991 cross section and those collected during and
after the 1997 flood. A value of zero for contraction scour is reported.
The reference surface used to determine the depth of abutment scour was the
concurrent ambient bed; therefore, the depth of abutment scour reported
is additional local scour below the depth of contraction scour, which
for this site was negligible. A reference surface at 313.7 m above NGVD
of 1929 was used to measure local abutment scour. A summary of the abutment
scour data is presented in table 21.
Model Calibration
The data collected on April 5 and 9, 1997, and July 15, 1997 were utilized
to build and calibrate the HEC-RAS model. Because no bathymetry data were collected
during the flood in either the approach or exit sections, low-flow cross sections
measured before and after the flood were used. The bathymetry data collected
on July 15, 1997, along with geometry taken from the bridge plans, were the
basis for the cross sections upstream and downstream of the bridge crossing.
Despite the added hydraulic complexities introduced by the meander of the channel
near the County Route 22 bridge, the HEC-RAS model predicted the water surface
at the bridge within 0.06 m of what was measured in the field on April 5 and
9. When an ineffective flow area representing the recirculation zone between
the right abutment and the rightmost pier was included, the model predicted
the water-surface elevation at the bridge within 0.03 m of what was observed
in the field.
The velocity distributions from the model and the field
compared favorably, although the one-dimensional model could not replicate the
two-dimensional features of the flow field. Figures 40 and 41 show the velocity
distributions for the model, using the geometry from April 5 and 9, and field
measurements collected with a vertical-axis current meter along the upstream
edge of the bridge. The one-dimensional model results did not compare well with
the April 5, 1997, observations (figure 40).
Although the model estimated the peak velocity near the rightmost pier
reasonably well, the model velocities were too high near the right bank and in
the center of the main channel and too low along the left bank. Figure 41 shows
that the model did a better job redistributing the flow after the scour had
fully developed. The errors displayed should be expected when using a
conveyance method to distribute flow that is complex and dominated by two-dimensional
effects of the contraction. Since data were not available for the approach
section, no comparisons could be made upstream from the bridge.
Table
21. Summary of abutment scour field data for Swift County Route 22
over the Pomme de Terre River in Minnesota.
| Date |
Abutment |
Location |
Equipment |
Observed Scour Depth
(m) |
Accuracy (m) |
Embankment Length (m) |
Velocity at Abutment
(m) |
Depth at Abutment (m) |
| 4/4/97 |
Right |
Upstream |
Echo sounder |
1.2 |
0.3 |
157 |
- |
4.2 |
| 4/5/97 |
Right |
Upstream |
Echo sounder |
1.2 |
0.3 |
162 |
2.5 |
4.8 |
| 4/9/97 |
Right |
Upstream |
Echo sounder |
3.0 |
0.5 |
166 |
1.0 |
6.4 |
| 4/4/97 |
Left |
Upstream |
Echo sounder |
0.9 |
0.3 |
44 |
- |
4.0 |
| 4/5/97 |
Left |
Upstream |
Echo sounder |
0.9 |
0.3 |
47 |
1.5 |
4.4 |
| 4/9/97 |
Left |
Upstream |
Echo sounder |
0.6 |
0.3 |
50 |
1.6 |
4.3 |
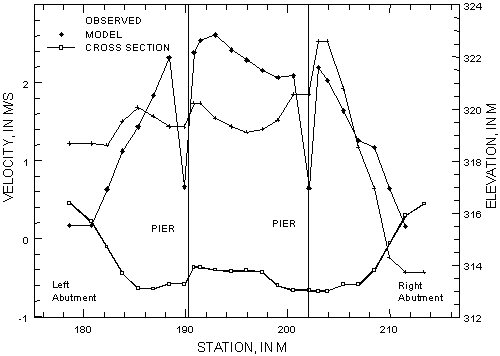
Figure 40. Comparison of observed and model velocity
distributions for April 5, 1997, at Swift County Route 22 over
the Pomme de Terre River, Minnesota.
|
 Figure 41. Comparison of observed and model velocity distributions
for April 9, 1997, at Swift County Route 22 over the Pomme de Terre
River, Minnesota.
Figure 41. Comparison of observed and model velocity distributions
for April 9, 1997, at Swift County Route 22 over the Pomme de Terre
River, Minnesota. |
Assessment of Scour Computations
The calibrated model was used to assess how accurately the scour for this flood
could have been predicted. The original geometry of the bridge section
was taken from the bridge plans and input into the calibrated HEC-RAS
model. The approach-and-exit cross sections were modified to be consistent
with the streambed elevations from the bridge plans. The ineffective flow
area between the rightmost pier and the right abutment was assumed to
be effective since it is unlikely that it would have been assumed ineffective
without field observations. The discharges from both April 5 and 9, 1997,
were then modeled with the original bathymetry to determine the hydraulic
parameters needed for scour computations. The analysis did not include
the data collected on April 4, 1997, because no hydraulic measurements
were made during that site visit.
The contraction scour was computed in HEC-RAS by allowing the model to use
the default equation (live bed or clear water) depending upon the hydraulic
conditions computed by the model. The model correctly predicted little
or no contraction scour for the prescribed discharges.
Abutment scour was computed in HEC-RAS by both the Froehlich and the HIRE equations.
The data contained in table 22 show that the Froehlich equation did a
good job predicting abutment scour, when compared to the fully developed
scour holes on April 9, 1997. Because the equations predict maximum depth
of scour, the Froehlich equation correctly overpredicted the depth of
scour, when compared to the scour holes at the right abutment measured
on April 5, 1997, which had not fully developed. The HIRE equation overpredicted
scour for all situations.
Table
22. Comparison of observed to computed abutment scour at Swift County
Route 22 over the Pomme de Terre River in Minnesota.
| |
|
|
|
Local
Scour Depth |
| Date |
Abutment |
Location |
Equipment |
Observed
(m) |
Froehlich
Equation (m) |
HIRE
Equation (m) |
|
4/5/97 |
Right |
Upstream |
Echo sounder |
1.2 |
2.9 |
3.8 |
|
4/5/97 |
Left |
Upstream |
Echo sounder |
0.8 |
0.7 |
2.8 |
|
4/9/97 |
Right |
Upstream |
Echo sounder |
3.0 |
3.3 |
4.1 |
|
4/9/97 |
Left |
Upstream |
Echo sounder |
0.6 |
0.9 |
3.1 |
Back to Top
Previous | Table
of Contents | Next
|