U.S. Department of Transportation
Federal Highway Administration
1200 New Jersey Avenue, SE
Washington, DC 20590
202-366-4000
Federal Highway Administration Research and Technology
Coordinating, Developing, and Delivering Highway Transportation Innovations
 |
| This report is an archived publication and may contain dated technical, contact, and link information |
|
Publication Number: FHWA-HRT-07-036 Date: March 2007 |
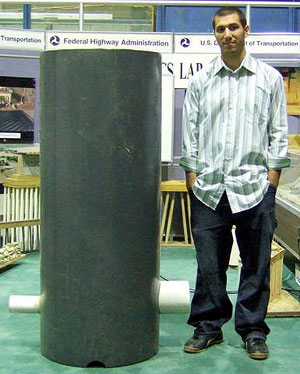
Junction Loss Experiments: Laboratory Report3. EXPERIMENTAL SETUPThe original 1986–1992 FHWA lab study, Chang et al., used a large-scale model of an access hole with a diameter of 0.6 m (2.0 ft), which is almost prototype scale for some applications (see figure 4).(1) The original study included 755 test runs. In the current study, a much smaller scale-a scaling ratio of 1 to 4-makes the experimental setup easier to operate. The new experimental equipment (see figure 5) involves higher precision instrumentation to investigate a wider range of parameters and a particle image velocimetry (PIV) technique to visualize and measure the flow patterns. The smaller scale also reduces the cost associated with the special tracer particles that are used in the PIV technique.
Figure 4. Photo. Access hole prototype in the 1986–1992 study with the lab technician to show relative size.
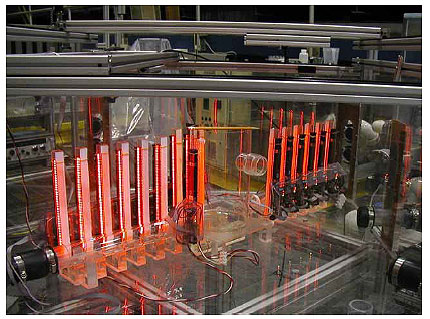
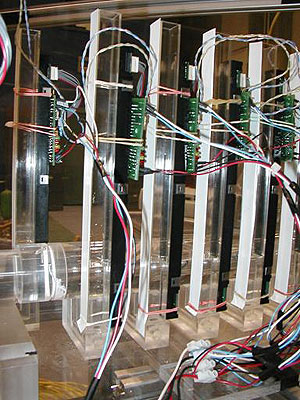
Figure 5. Photo. The scaled model of an access hole equipped with standpipe instruments. The new test apparatus for junction energy loss includes three water tanks: a headbox, a main tank, and a tailbox. The purpose of the headbox tank is to control the pressure head for the experiments and to allow injection of seeding particles for the PIV technique. The junction loss model is mounted inside the main tank, where it is surrounded by still water to minimize distortions for the stereoscopic PIV recordings. The main tank also supports a carriage system for an ultrasonic sensor that measures the flow depth in the access hole junction. This setup is capable of maintaining a constant flow depth in the access hole during the test run, and the water in the standpipes measures the hydraulic grade line (HGL) in the inflow and outflow pipes. The tailbox tank is designed to control the tail water. The measurements of the total loss through the access hole did not require measuring the energy inside the access hole. Two techniques were developed to measure the flow depth. One method used laser sensors to measure the distance down to a floating disk in each standpipe. Another method, recently developed at the FHWA Hydraulics Laboratory, uses contact image sensors (CIS) mounted on the sides of the standpipes to measure the water column in the stand pipes (see figures 5 and 6). The biggest advantage of the CIS system is that it measures the water columns in all of the standpipes simultaneously, which increases the precision of the loss coefficient calculation.
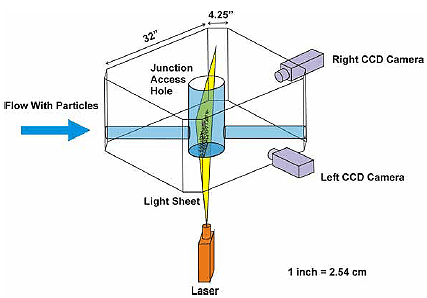
Figure 6. Photo. CIS sensors attached to standpipes. Three flow meters provide discharge readings, which are used to compute velocity head. CIS sensors mounted at four locations in the access hole measure an average water surface elevation. All of the model pipes are fabricated from PlexiglasTM. The access hole is 15 cm (6 inches) in diameter, and the inflow and outflow pipes are 3.8 cm (1.5 inches) in diameter, which yields a relative access hole diameter (i.e., b/Do) equal to 4. The outflow pipe in the miniculvert experiments was 5.1 centimeters (2 inches) in diameter. For reasons discussed in the results section, stereoscopic PIV techniques and 3–D numerical models were used to characterize the velocity profile at different locations (vertical slices) along the outflow pipe from the access hole (see figure 7) and from the miniculvert (see figure 8) setups. The PIV technique is an optical flow diagnostic based on the interaction of light refraction and scattering in non-homogeneous media. The fluid motion is made visible by tracking the locations of small tracer particles between two snapshots in time. The velocity flow field is inferred by plotting the particle displacements versus time. Thus, the PIV technique makes it possible to measure instantaneous velocity flow fields.
Figure 7. Diagram. Stereoscopic PIV arrangement and the access hole setup.
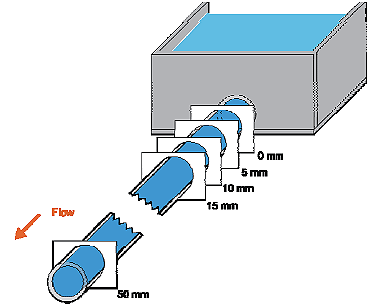
Figure 8. Diagram. Eleven stereoscopic PIV measurements along the miniculvert outflow pipe. The stereoscopic PIV camera system consists of a pair of digital cameras that focus on two different angles of the vertically projected "light sheet" (see figures 9 and 10). The light sheet is generated with a laser fitted with an optical lens that spreads the beam into a plane of light. A special geometry is necessary to reconstruct the 3–D field from the two projected, planar displacement fields. This setup requires precise measurements of the distance between the two camera lenses, and the distances between each camera and the light sheet. The laser system and cameras are mounted on a movable carriage frame that keeps the distance constant between cameras and light sheet. It should also be noted that the CIS measurements and PIV measurements could not be measured at the same time, which resulted in running many of the experiments twice.
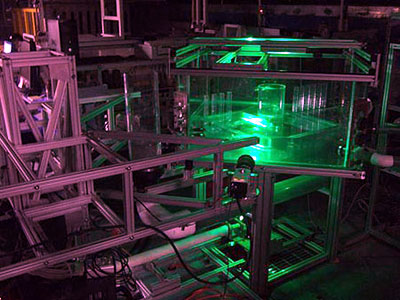
Figure 9. Photo. Access hole setup with PIV light sheet in outflow pipe.
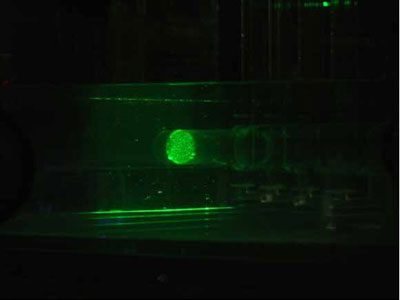
Figure 10. Photo. Closeup of the tracer particles in the outflow pipe from the access hole. |