U.S. Department of Transportation
Federal Highway Administration
1200 New Jersey Avenue, SE
Washington, DC 20590
202-366-4000
Federal Highway Administration Research and Technology
Coordinating, Developing, and Delivering Highway Transportation Innovations
 |
| This report is an archived publication and may contain dated technical, contact, and link information |
|
Publication Number: FHWA-RD-03-093
Date: August 2006 |
|
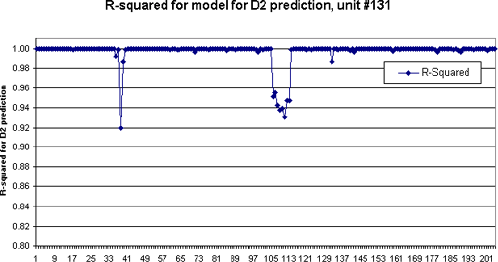
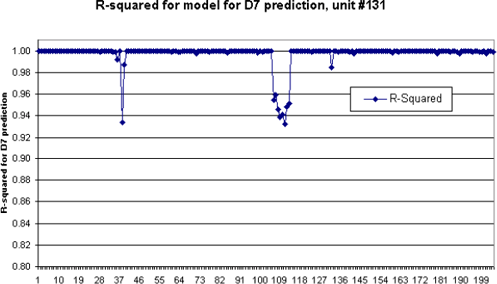
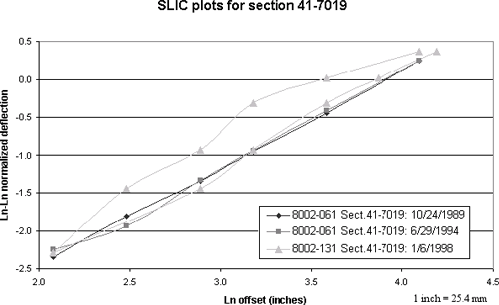
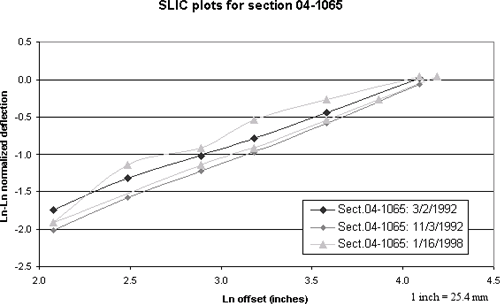
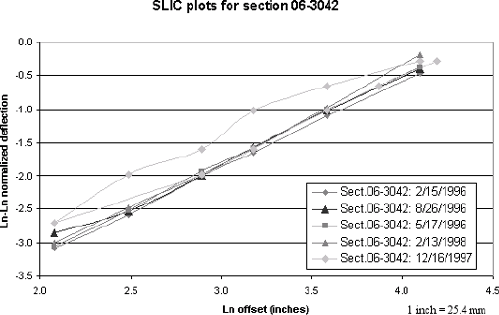
Study of Long-Term Pavement Performance (LTPP): Pavement DeflectionsAppendix L. FWD SN 131, December 16, 1997–January 20, 1998These previously reported sensor position errors were located in the database using an automated screening version of SLIC. The SLIC screening version used was tailored for predicting the position of sensors 2 and 7. Since four or five of the sensors were positioned differently from protocol, the overall SLIC regression fits were used to verify the positioning errors found. The first two graphs shown in this appendix, (figures 52 and 53), are plots of all the SN #131 values of R2 for the d2 and d7 regression fits, from the middle of March 1997 through the beginning of October 1998, for lane 1, drop height 4 FWD tests. In figures 52 and 53, it can be seen that there is a serious anomaly starting around Test Sequence 107, which corresponds to December 16, 1997. The average R2 value during the period of time in question was only 0.945, whereas when the FWD sensors used in the regression are correctly placed, the average values of R2 for the regression is usually 0.998, or better. Clearly the R2 values change dramatically both before and after the period of time in question. Individual plots like those shown in the succeeding three graphs corroborate that the reported (protocol) sensor configuration was incorrect. Based on a detailed analysis of the data, for example as shown in the three succeeding figures, it is clear that the sensor positions used were 0, 8, 18, 24, 36, 48, and 66 (or 60) inches. All three section-specific plots in the last three figures of this appendix (figures 54, 55, and 56) depict these sensor positions, which correspond exactly to the sensor positions used at WesTrack just prior to December 16, 1997, except for d2 and d7. At WesTrack, d2 should have been placed at 30.5 cm (12 inches); however it is clear it remained unmoved at 20.3 cm (8 inches), probably from previous LTPP testing. Also at WesTrack, d7 should have been at 152.4 cm (60 inches); however, from the plots shown it appears to be at approximately 167.6 cm (66 inches). This latter value, however, is uncertain, so it is recommended that the LTPP and WesTrack d7 protocol sensor position of 152.4 cm (60 inches) still be used in the LTPP database. In the three section-specific plots shown in figures 54, 55, and 56, the results shown graphically utilize light gray lines and data points for the erroneous data. The light gray plots show d3–d7 in both their actual and incorrect (protocol) offset positions. The plots that are parallel to the rest of the data are the correct ones, with d3 through d7 set to 18, 24, 36, 48, and 66 inches, respectively. Please note again that it is not absolutely certain that d7 is really at 167.6 cm (66 inches) because the plot with d7 at 152.4 cm (60 inches) would result in almost as good a fit. Because of this information, and the previous information supplied to FHWA, it can be concluded with certainty that d3, d4, d5, and d6 were positioned at 18, 24, 36, and either 60 or 66 inches, respectively, between December 16, 1997, and January 20, 1998. These dates correspond to the dates when lane 1 tests were conducted at drop height 4 with SN #131. This period of time may need to be extended slightly, if other tests were conducted along different lanes or at different drop heights. In any case, FWD tests conducted with SN #131 on or before December 8, 1997, and on or after February 13, 1998, clearly show that normal LTPP protocol sensor positions were used.
Figure 52. Graph. R-squared model for d2 prediction, unit #131, 1997–98.
Figure 53. Graph. R-squared model for d7 prediction, unit #131, 1997–98.
Figure 54. Graph. SLIC plots for section 41–7019 including unit #131, January 1998.
Figure 55. Graph. SLIC plots for section 04–1065 including unit #131, January 1998.
Figure 56. Graph. SLIC plots for section 06–3042 including unit #131, December 1997.
|