U.S. Department of Transportation
Federal Highway Administration
1200 New Jersey Avenue, SE
Washington, DC 20590
202-366-4000


Skip to content
Facebook iconYouTube iconTwitter iconFlickr iconLinkedInInstagram

Federal Highway Administration Research and Technology
Coordinating, Developing, and Delivering Highway Transportation Innovations

Report
This report is an archived publication and may contain dated technical, contact, and link information
breadcrumb
Publication Number: FHWA-HRT-04-079
Date: July 2006

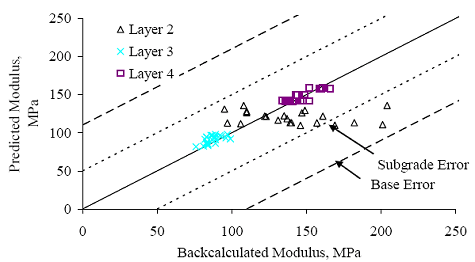
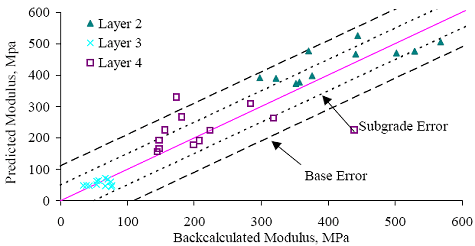
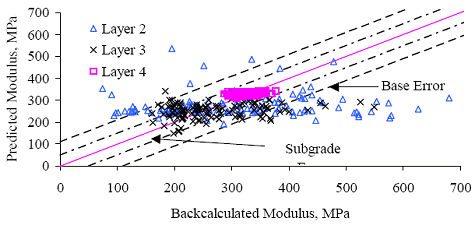
Seasonal Variations in The Moduli of Unbound Pavement Layers

Appendix F: Trial Application Results Based On Section/Layer-Specific Models Derived From All Available Data

Figure 49. Section 040113 (Arizona) E versus E predicted for section-specific models based on data for all available test dates

Figure 49. Graph. Section 040113 (Arizona) E versus E subscript predicted for section-specific models based on data for all available test dates. The graph has the backcalculated modulus graphed on the horizontal axis from 0 to 250 megapascals. The predicted modulus is graphed on the vertical axis from 0 to 250 megapascals. There are three layers compared: layers 2, 3, and 4. There is a subgrade error at the minimum 95 percent confidence and a base error at the 95 percent maximum confidence. Layers 3 and 4 have a strong correlation and remain below the base error. Layer 3 has plots increasing at a 45-degree angle between 60-100 megapascals for both predicted and backcalculated modulus. Layer 4 has plots between 125-170 megapascals. Layer 3 has a weak correlation, which has plots between 110-140 predicted across 90-210 backcalculated.

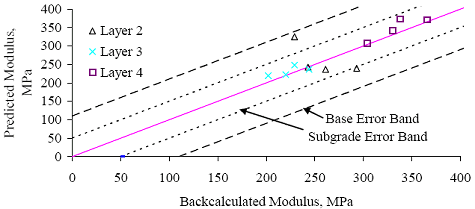
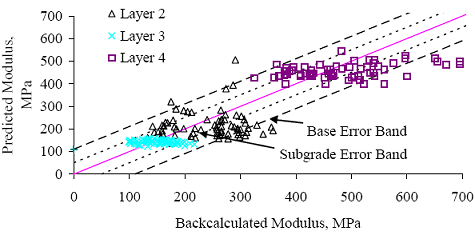
Figure 50. Section 040114 (Arizona) E versus E predicted for section-specific models based on data for all available test dates

Figure 50. Graph. Section 040114 (Arizona) E versus E subscript predicted for section-specific models based on data for all available test dates. The backcalculated modulus is graphed on the horizontal axis from 0 to 400 megapascals. The predicted modulus is graphed on the vertical axis from 0 to 400 megapascals. The subgrade error band is at the minimum confidence of 95 percent. The base error band is at the maximum confidence of 95 percent. Layers 3 and 4 are within the base error band and have a strong correlation between backcalculation and predicted modulus. Layer 2 has a weak correlation, with plots outside of the base error.

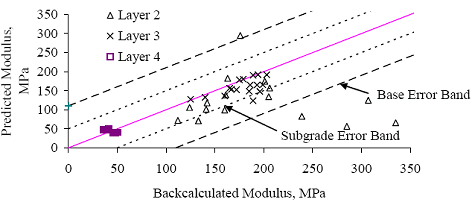
Figure 51. Section 091803 (Connecticut) E versus E predicted for section-specific models based on data for all available test dates

Figure 51. Graph. Section 091803 (Connecticut) E versus E subscript predicted for section-specific models based on data for all available test dates. The backcalculated modulus is graphed on the horizontal axis from 0 to 400 megapascals. The predicted modulus is graphed on the vertical axis from 0 to 400 megapascals. There are three layers plotted on the graph: layers 2, 3, and 4. The subgrade error band is at the minimum confidence of 95 percent and the base error band is at the maximum confidence of 95 percent. All three layers are scattered, beginning at a backcalculated modulus of 100 megapascals and increasing to 400 megapascals. All layers are scattered at a predicted modulus of 125 megapascals and above. This graph shows a weak correlation between backcalculated modulus and predicted modulus for specific models.

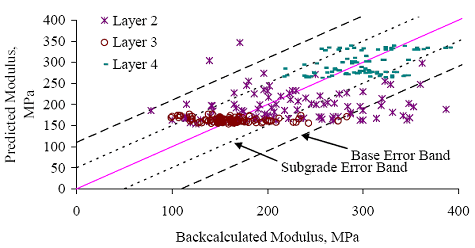
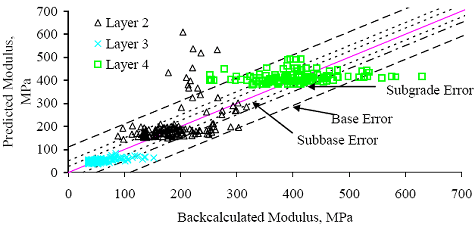
Figure 52. Section 131031 (Georgia) E versus E predicted for section-specific models based on data for all available test dates

Figure 52. Graph. Section 131031 (Georgia) E versus E subscript predicted for section-specific models based on data for all available test dates. The backcalculated modulus is graphed on the horizontal axis from 0 to 800 megapascals. The predicted modulus is graphed on the vertical axis from 0 to 800 megapascals. Three layers are plotted on the graph: layers 2, 3, and 4. The subgrade error is at a minimum confidence of 95 percent and the base error is at the maximum confidence of 95 percent. Layer 4 has a strong correlation between the modulus and is plotted at a predicted modulus of 75 megapascals between the backcalculated modulus of 50-100 megapascals. Both layers 2 and 3 have a weak correlation. Layer 2 is scattered in the middle of the graph. Layer 4 remains at a predicted modulus of 75 megapascals, between the backcalculated modulus of 100-210 megapascals.

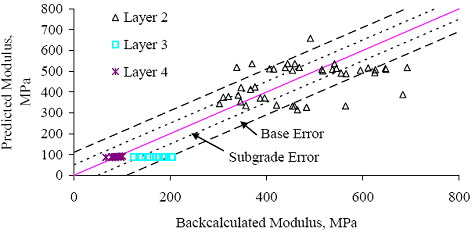
Figure 53. Section 161010 (Idaho) E versus E predicted for section-specific models based on data for all available test dates

Figure 53. Graph. Section 161010 (Idaho) E versus E subscript predicted for section-specific models based on data for all available test dates. The backcalculated modulus is graphed on the horizontal axis from 0 to 600 megapascals. The predicted modulus is graphed on the vertical axis from 0 to 600 megapascals. There are three layers: layers 2, 3, and 4. The subgrade error is at a minimum confidence of 95 percent and the base error is at the maximum confidence of 95 percent. All three layers are within the base layer. Layer 3 is plotted within 100 megapascals. Layer 4 is scattered between 125-325 megapascals. Layer 2 begins at a predicted modulus of 350 megapascals at backcalculated modulus of 300 megapascals and the plots increase to 425 predicted at 560 backcalculated.

Figure 54. Section 231026 (Maine) E versus E predicted for section-specific models based on data for all available test dates

Figure 54. Graph. Section 231026 (Maine) E versus E subscript predicted for section-specific models based on data for all available test dates. The backcalculated modulus is graphed on the horizontal axis from 0 to 700 megapascals. The predicted modulus is graphed on the vertical axis from 0 to 700 megapascals. There are three layers: layers 2, 3, and 4. The subgrade error is at a minimum confidence of 95 percent and the base error is at the maximum confidence of 95 percent. Layer 3 is clustered between backcalculated modulus 100-200 megapascals at 150 predicted. Layer 2 is scattered across the backcalculated modulus 125-350 megapascals mostly between predicted modulus from 150-300 megapascals. Layer 4 is scattered across the backcalculated modulus between 350-700 megapascals from predicted modulus of 400-500 megapascals. All three layers have a weak correlation.

Figure 55. Section 271018 (Minnesota) E versus E predicted for section-specific models based on data for all available test dates

Figure 55. Graph. Section 271018 (Minnesota) E versus E subscript predicted for section-specific models based on data for all available test dates. The backcalculated modulus is graphed on the horizontal axis from 0 to 350 megapascals. The predicted modulus is graphed on the vertical axis from 0 to 350 megapascals. There are three layers: layers 2, 3, and 4. The subgrade error is at a minimum confidence of 95 percent and the base error is at the maximum confidence of 95 percent. Layer 4 has a few scatter points around 50 megapascals for both back calculated and predicted modulus and is within the subgrade error band. Layer 2 has a weak correlation, with a few points outside of the base error band. Layer 3 is scattered between backcalculated modulus of 125-210 megapascals at predicted modulus from 120-200 megapascals. Both layers 2 and 4 have a strong correlation and are plotted within the base error band.

Figure 56. Section 331001 (New Hampshire) E versus E predicted for section-specific models based on data for all available test dates

Figure 56. Graph. Section 331001 (New Hampshire) E versus E subscript predicted for section-specific models based on data for all available test dates. The backcalculated modulus is graphed on the horizontal axis from 0 to 700 megapascals. The predicted modulus is graphed on the vertical axis from 0 to 700 megapascals. There are three layers: layers 2, 3, and 4. The subgrade error is at a minimum confidence of 95 percent and the base error is at the maximum confidence of 95 percent. Layer 3 is clustered across backcalculated modulus of 20-150 megapascals at predicted modulus of 10-60 megapascals. Layer 2 has a cluster of points across backcalculated modulus of 90-310 megapascals at predicted modulus of 125-200. Layer 4 has a cluster beginning at backcalculated modulus of 130-550 megapascals at predicted modulus of 360-450 megapascals. Layers 3 and 4 have a weak correlation and are scattered outside all the error bands. Layer 3 has a stronger correlation compared to the other two layers and is within the base error band.

Figure 57. Section 351112 (New Mexico) E versus E predicted for section-specific models based on data for all available test dates

Figure 57. Graph. Section 351112 (New Mexico) E versus E subscript predicted for section-specific models based on data for all available test dates. The backcalculated modulus is graphed on the horizontal axis from 0 to 700 megapascals. The predicted modulus is graphed on the vertical axis from 0 to 700 megapascals. There are three layers: layers 2, 3, and 4. The subgrade error is at a minimum confidence of 95 percent and the base error is at the maximum confidence of 95 percent. Layer 2 is scattered throughout the graph between predicted modulus of 150-525 megapascals. Layer 3 is clustered on backcalculated modulus of 150-450 megapascals on predicted modulus of 100-350. Layer 4 is tightly clustered between backcalculated modulus of 280-380 megapascals at the predicted modulus of 300-350 megapascals. Both layers 2 and 3 have a weak correlation for data beyond the error band.

Figure 58. Section 481077 (Texas) E versus E predicted for section-specific models based on data for all available test dates

Figure 58. Graph. Section 481077 (Texas) E versus E subscript predicted for section-specific models based on data for all available test dates. The backcalculated modulus is graphed on the horizontal axis from 0 to 700 megapascals. The predicted modulus is graphed on the vertical axis from 0 to 700 megapascals. There are two layers: layers 2 and 3. The subgrade error is at a minimum confidence of 95 percent and the base error is at the maximum confidence of 95 percent. Layer 2 is scattered throughout the graph between backcalculated modulus of 200-550 megapascals and predicted modulus of 200-450 megapascals. Layer 3 is tightly clustered between backcalculated modulus of 125-260 megapascals at the predicted modulus of 190 megapascals. Both layers 2 and 3 have a weak correlation.

Figure 59. Section 561007 (Wyoming) E versus E predicted for site-specific models based on data for all available test dates

Figure 59. Graph. Section 561007 (Wyoming) E versus E subscript predicted for site-specific models based on data for all available test dates. The backcalculated modulus is graphed on the horizontal axis from 0 to 350 megapascals. The predicted modulus is graphed on the vertical axis from 0 to 350 megapascals. There are three layers: layer 2, 3, and 4. The subgrade error is at a minimum confidence of 95 percent and the base error is at the maximum confidence of 95 percent. Layer 3 has a few plots between backcalculated modulus of 70-125 megapascals and predicted modulus of 100. Layer 4 has a few plots between backcalculated modulus of 125-178 megapascals and predicted modulus of 150-175 megapascals. Layer 4 has a few plots that are more spread out between backcalculated modulus of 125-225 megapascals and predicted modulus of 80-200 megapascals. All three layers have a strong correlation between predicted and backcalculated modulus, and all three are within the base error band.

Figure 60. Section 871622 (Ontario) E versus E predicted for section-specific models based on data for all available test dates

Figure 60. Graph. Section 871622 (Ontario) E versus E subscript predicted for section-specific models based on data for all available test dates. The backcalculated modulus is graphed on the horizontal axis from 0 to 350 megapascals. The predicted modulus is graphed on the vertical axis from 0 to 350 megapascals. There are three layers: layers 2, 3, and 4. The subgrade error is at a minimum confidence of 95 percent and the base error is at the maximum confidence of 95 percent. Layer 3 is tightly clustered between backcalculated modulus of 90-125 megapascals at the predicted modulus of 80-120 megapascals. Layer 4 is also tightly clustered between backcalculated modulus of 140-180 megapascals at the predicted modulus of 125-180 megapascals. Layer 4 has points widely spread out between backcalculated modulus of 125-320 megapascals and predicted modulus of 75-140 megapascals. Both layers 2 and layer 3 have a strong correlation between predicted and backcalculated modulus and remained within base error and subgrade error band.

Previous | Table of Contents | Next


Federal Highway Administration | 1200 New Jersey Avenue, SE | Washington, DC 20590 | 202-366-4000
Turner-Fairbank Highway Research Center | 6300 Georgetown Pike | McLean, VA | 22101