U.S. Department of Transportation
Federal Highway Administration
1200 New Jersey Avenue, SE
Washington, DC 20590
202-366-4000
Federal Highway Administration Research and Technology
Coordinating, Developing, and Delivering Highway Transportation Innovations
 |
| This report is an archived publication and may contain dated technical, contact, and link information |
|
Publication Number: FHWA-HRT-05-054
Date: September 2005 |
|
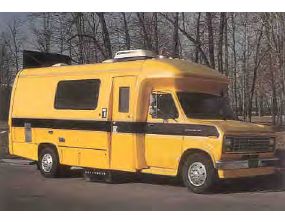
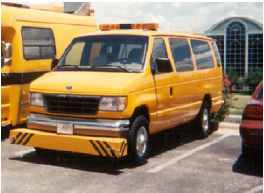
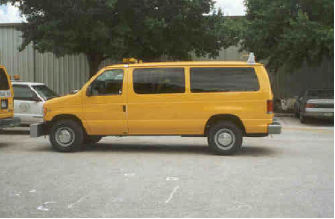
Quantification of Smoothness Index Differences Related To Long-Term Pavement Performance Equipment TypeChapter 2: Profiling Devices Used in The LTPP ProgramINERTIAL PROFILERSA brief description of each of the inertial profilers that have been used in the LTPP program is presented in the following sections. K.J. Law Engineers DNC 690 ProfilerThree of LTPP's DNC 690 profilers were identical, and the host vehicle used for these profilers was a Ford E 350 chassis that had a motor home body built onto it (see figure 2). The fourth DNC 690 profiler had the same profiling equipment as the other three profilers; however, the host vehicle was a passenger van (see figure 3). This profiler was used to collect profile data in the North Central region.
All of these profilers were equipped with two incandescent sensors manufactured by K.J. Law Engineers that collected data along the two wheelpaths. The sensors were fixed to the vehicle body and were located between the axles of the vehicle. The spacing between the two sensors in the profilers was 1,676 millimeters (mm) (66 inches), except for the passenger van-based profiler that had a sensor spacing of 1,422 mm (56 inches). The incandescent sensors emitted a beam of light onto the pavement surface, and the reflected light signal was detected by a rotating mirror that was located inside the sensor. The data collected by these profilers could become contaminated if the receiver in the sensor picked up any sunlight. If the sensor detected sunlight, the result would be spikes in the profile data. A shroud was installed around the sensors in these profilers to prevent contamination of the profile data by sunlight. However, there were instances when sunlight did get under the shroud (particularly on rough roads or when the sun angle was low) and cause spikes to appear in the profile data. Another problem that occurred with the incandescent sensors was caused by the insufficient reflectivity of some of the pavement surfaces-the light signal was not being reflected back to the sensor. This condition usually happened on pavements having a dark-colored surface, such as a newly placed asphalt surface, or when there was a change in reflectivity of the pavement surface. This condition was referred to as “lost lock.” When this condition occurred, it appears that only the accelerometer signal was used to compute the profile, and this resulted in an incorrect profile being recorded. The height-sensor footprint of an incandescent sensor (which is the area covered by the beam of light emitted by the sensor) was 150 mm by 6 mm (5.9 inches by 0.24 inches), with the 150-mm (5.9-inch) side being perpendicular to the direction of travel. It is believed that the incandescent sensors had a measurement range of 125 mm (4.9 inches). This profiler recorded data at 152.4-mm (6-inch) intervals. However, the profiler collected data at 25.4-mm (1-inch) intervals and then applied a 304.8-mm (12-inch) moving average onto the data before recording the data. K.J. Law Engineers T-6600 ProfilerIn 1996, FHWA purchased four K.J. Law Engineers T-6600 profilers (see figure 4) to replace the K.J. Law Engineers DNC 690 profilers. The T-6600 profilers collected data for the LTPP program from late 1996 until July 2002. These profilers were equipped with three infrared height sensors manufactured by K.J. Law Engineers, which were mounted on a profiler bar located on the front of the vehicle. Two of the sensors collected data along the wheelpaths, while the third sensor collected data along the center of the lane. The spacing between the two outer sensors in the profiler was 1676 mm (66 inches). The infrared sensors had an elliptical footprint that was 38 mm by 6 mm (1.5 inches by 0.24 inches), with the 38-mm (1.5-inch) side being perpendicular to the direction of travel. These sensors had a measurement range of 125 mm (4.9 inches). The data collected by the infrared height sensors were not affected by ambient light. These profilers recorded profile data at 25-mm (l-inch) intervals.
International Cybernetics Corporation ProfilerIn July 2002, FHWA purchased four new ICC MDR 4086L3 profilers (see figure 5) to replace the K.J. Law Engineers T-6600 profilers. The ICC profilers began collecting profile data for the LTPP program in August 2002, and currently are used to collect profile data.
These profilers were equipped with three Selcom® Systems laser sensors mounted on a profiler bar located on the front of the vehicle. Two sensors collect data along the wheelpaths, while the third sensor collects data along the center of the lane. The spacing between the two outer sensors is 1676 mm (66 inches). The footprint of a laser sensor is circular, and has a diameter of about 1.5 mm (0.06 inches). The laser sensors have a measurement range of 200 mm (7.9 inches). The readings obtained by the laser sensors are not affected by ambient light. The ICC profilers do not record profile data, but rather they record in a file the signals measured by the height sensors and the accelerometers, and the distance data from the distance measuring instrument (DMI). After data collection has been completed, a computer program is used to generate profile data at 25 mm (l-inch) intervals. DIFFERENCES AMONG THE INERTIAL PROFILERSSeveral differences among the three types of inertial profilers that have been used to collect profile data for the LTPP program are:
Height-Sensor Type and FootprintThe DNC 690, T-6600, and ICC profilers were equipped with incandescent sensors, infrared sensors, and laser sensors, respectively. The height-sensor data collected by the DNC 690 profiler could get contaminated by sunlight getting into the sensor through the shroud covering the sensors. The data collection capabilities of the infrared sensors on the T-6600 profiler and the laser sensors on the ICC profilers were not affected by ambient light. Another problem with the DNC 690 profilers was the occurrence of lost lock. This problem did not occur in either the T 6600 profilers or the ICC profilers There were differences in the height-sensor footprint size among the three profilers. The DNC 690 profilers had a footprint size of 150 mm by 6 mm (5.9 inches by 0.24 inches); the 150 mm (5.9-inch) side was perpendicular to the direction of travel. The T-6600 profilers had an elliptical footprint that was 38 mm by 6 mm (1.5 inches by 0.24 inches); the 38-mm (1.5 inch) side was perpendicular to the direction of travel. The ICC profilers were equipped with laser height sensors that had a circular footprint of about 1.5 mm (0.06 inches) in diameter. Figure 6 shows the relative size of the sensor footprints for the three height sensors. Sensor SpacingThe spacing between the two outer sensors for all three profilers was 1,676 mm (66 inches), except for the DNC 690 profiler operated by the North Central region. This profiler had a sensor spacing of 1,422 mm (56 inches). Number of SensorsThe DNC 690 profilers were equipped with two height sensors for collecting profile data along the wheelpaths. The T-6600 profilers and the ICC profilers had three sensors for collecting profile data (two sensors collected data along the wheelpaths, and the third sensor was located at the midpoint between the two outer sensors).
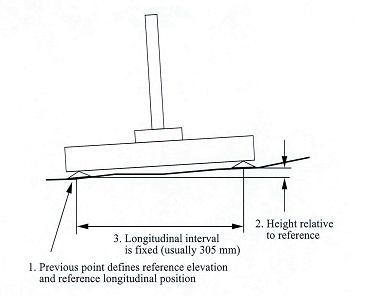
Figure 6. Height-sensor footprints. Location of Height SensorsIn the DNC 690 profilers, the height sensors were located midway between the two axles of the vehicle. The sensors in the T-6600 profilers and the ICC profilers were housed inside a sensor bar that was mounted on the front of the vehicle. Measurement Range of Height SensorsThe ICC profilers were equipped with Selcom laser sensors that had a measurement range of 200 mm (7.9 inches). The T-6600 profilers that were equipped with infrared sensors had a measurement range of 125 mm (4.9 inches). It is believed that the incandescent sensors that were used on the DNC 690 profilers had a similar measurement range. A National Cooperative Highway Research Program (NCHRP) study that analyzed data from roads having a roughness of up to 4.5 meters per kilometer (m/km) (285 inches per mile (inches/mi)) found that the range of vertical movement that was expected in a vehicle between the axles (where the sensors on the DNC 690 profiler were located) was well within the measurement range of the sensors on the DNC 690 profiler.(1) Therefore, it is unlikely that the height sensors on the DNC 690 profiler exceeded the measurement range while collecting data. On a road with a given roughness value, the range of movement that is experienced by the profiler bar that is located on the front of the vehicle is much more than the movement that occurs in the vehicle body between the axles. Therefore, on any given road, the height sensors of the T-6600 profiler that were mounted on the front profiler bar measured much more movement than that measured by the height sensors on the DNC 690 profiler. There is a possibility that the measurement range of the height sensors on the T-6600 profiler may have been exceeded at extremely rough locations. If this occurred, it is believed that the reading obtained at the cutoff limit of the height sensor was used to compute the profile at that location. The 200-mm (7.9-inch) height-sensor range for the ICC profilers is expected to be sufficient for collecting data on rough LTPP sections without the height sensors exceeding the measurement range. Data Recording IntervalThe DNC 690 profilers collected profile data at 25.4-mm (1-inch) intervals, and then applied a 304.8-mm (12-inch) moving average onto the data and recorded the data at 152.4-mm (6-inch) intervals. The T-6600 profilers recorded profile data at 25-mm (1-inch) intervals. The ICC profilers do not record profile data; however, they record data obtained from the height sensors, accelerometers, and DMI. It is possible to obtain profile data at 25-mm (1-inch) intervals from these data. Data Filtering MethodsDetails about the filters used in the computation of the profile data for all three profiler types are not available. The manufacturers of the profilers consider this information to be proprietary. It is possible that the filtering methods used with the DNC 690 and T-6600 profilers may be similar, since the same manufacturer built both of these profilers. Differences in the filtering techniques used in the K.J. Law Engineers profilers and the ICC profilers are expected. A 100-m (328-ft) upper-wavelength cutoff filter is applied to the data obtained from the T-6600 and ICC profilers. The data collected by the DNC 690 profiler were subjected to a 91-m (300-ft) upper-wavelength cutoff filter. DIPSTICKIn the LTPP program, longitudinal profile data collection at the test sections located in Alaska, Hawaii, and Puerto Rico is performed using Dipstick, a hand-operated device manufactured by the Face Company. Dipstick has a digital inclinometer that measures the elevation difference between the two footpads (see figure 7).(2) The diameter of the footpads of the Dipsticks used in the LTPP program is approximately 32 mm (1.25 inches). The spacing between the centers of the two footpads is 304.8 mm (12 inches). Dipstick is walked along a test section, and at each position it displays the elevation difference between the two footpads, which is recorded in a data collection form. The individual readings are then added to get the elevation profile. Dipstick is used during LTPP profiler comparisons to obtain reference elevations along the two wheelpaths at the test sections. In 1989, the Center for Transportation Research at the University of Texas at Austin investigated the ability of Dipstick to measure road profiles.(3) This investigation showed that when properly calibrated and operated, Dipstick could give profiles as good as those from rod-and-level surveys, but at a fraction of the time and cost. MANUALS FOR PROFILER OPERATIONSManuals have been developed that document the operational procedures to be followed when measuring pavement profiles for the LTPP program using an inertial profiler or Dipstick. These manuals cover field testing procedures, data collection procedures, calibration of equipment, record keeping, and maintenance of equipment. The operational procedures for the DNC 690 profiler are documented in a SHRP report (report no. SHRP-P-378).(4) The operational procedures for the T-6600 profiler are contained in a legacy document written by the LTPPtechnical support contractor.(5) Operational procedures for the ICC profiler are described in the LTPP Manual for Profile Measurements and Processing, Version 4.1.(6)
COMPUTATION OF ROUGHNESS INDICESThe longitudinal profile data collected by the inertial profilers and Dipsticks are used to compute roughness indices such as IRI, RMSVA, and Slope Variance. In the LTPP program, roughness indices from profile data are computed using FHWA‘s ProQual software.(7,8) This program uses the IRI computation algorithm that is presented in a World Bank document.(9) The DNC 690 profilers recorded profile data at 152.4-mm (6-inch) intervals in a binary format. ProQual converted this data to an ASCII format, and then used the data to compute roughness indices. The computed roughness indices and the profile data are stored in the LTPP database. Profile data obtained at 25-mm (1-inch) intervals are available for both the T-6600 and ICC profilers. ProQual imports this data and then applies a 300-mm (11.8-inch) moving average onto the 25-mm (1-inch) data, and extracts data points at 150-mm (5.9-inch) intervals. Roughness indices are computed using the data that are at 150-mm (5.9-inch) intervals. The computed roughness indices and the averaged profile data that are at 150-mm (5.9-inch) intervals are uploaded to the LTPP database. The raw profile data files that contain the data recorded by the profilers are stored at the regional offices. When computing IRI values from the Dipstick data, the following procedure is used in ProQual:
|