U.S. Department of Transportation
Federal Highway Administration
1200 New Jersey Avenue, SE
Washington, DC 20590
202-366-4000
Federal Highway Administration Research and Technology
Coordinating, Developing, and Delivering Highway Transportation Innovations
 |
| This report is an archived publication and may contain dated technical, contact, and link information |
|
Publication Number: FHWA-HRT-06-109 Date: September 2006 |
Mark P. McDonald
Auburn University
Albertville, AL
Faculty Advisor:
Larry G. Crowley
Auburn University
Albertville, AL
Faculty Advisor:
Rod E. Turochy
Auburn University
Albertville, AL
The nature of seasonal variations in highway skid resistance is investigated through use of the DataPave 3.0 friction data. The investigation is approached using the first principle of the conservation of energy. Two common theories explaining seasonal variation in skid resistance are considered, one stating that the seasonal variations in skid resistance occur as snowfall removal operations increase microtexture, which is then worn away throughout the summer. The other states that seasonal variations are caused by seasonal differences in pavement temperature.
This research also demonstrates a methodology that can be adapted to analyze general multivariate statistical systems and specifically the DataPave pavement structural data. The study uses visually oriented observational study techniques to assess the validity of the hypothesized factor structure in the data and to express it visually. After the visual analysis, structural equations modeling is used to express the structure numerically. The results indicate that snowfall did not organize the data; however, temperature did begin to organize the data. This suggests a temperature effect on skid resistance and indicates that seasonal variations in pavement friction depend on factors not related to surface texture.
Using the developed model, monthly adjustments for skid numbers were calculated and compared with those used by the Virginia Department of Transportation. This comparison showed significant agreement between the developed model and in-place practices.
An understanding of how and why pavements behave as they do is crucial in the effective management of highway infrastructure systems. For this reason, the Federal Highway Administration (FHWA) began work on the Long-Term Pavement Performance (LTPP) program in 1984 to examine the behavior of pavements. These experiments fall into two categories, General Pavement Studies (GPS) and Specific Pavement Studies (SPS). The GPS studies focus on the most commonly used pavement designs, while the SPS studies focus on specific pavement design factors.(1)
As the data collection and management phase of the LTPP program comes to a close, a long and difficult data analysis process begins. Unfortunately, the analysis task is very complex as the data result from a factorial design. The many confounding effects of the factors result in significant “noise” in the data and weaken the strength of correlations in the data. This investigation will demonstrate a methodology for exploring the database using visually oriented observational study techniques.
Highway skid resistance is a very important component of traffic safety. In Alabama, 22 percent of all accidents and 15 percent of all fatal accidents occur on wet pavements, although Alabama’s highways are wet only 4 percent of the time. While the benefits associated with wet-weather traction are very great, the costs associated with providing it are great as well.
Although much money is spent to provide wet-weather traction, the nature of the mechanics of tire friction is still poorly characterized. A better understanding of friction mechanics would allow researchers to understand the nature of seasonal and short-term variations in skid resistance that have been observed for more than 40 years. The purpose of this research is to explain the nature of seasonal variation in skid resistance.
The law of conservation of energy has been chosen as the focal point of this investigation because friction is an energy conversion process. The conservation of energy is one of the most fundamental truths of physics. To begin an investigation of friction from any other perspective is to risk the development of a theory of friction that may not be consistent with the fundamental laws of nature.
Richard Feynman explains that the law of conservation of energy is a fundamental law of nature for which we have no known exception.(2) We do not know exactly what energy is, but we do know the basic forms it takes. Feynman enumerates these as gravitational potential energy, kinetic energy, heat, sound, radiant energy, elastic energy, chemical energy, nuclear energy, and mass energy. He explains that while energy can be converted from one form to another, their sum is constant in a closed system.
Frictional phenomena have played a central role in the discovery of this law of energy. In the classic physics experiment, Count Rumford noticed that as horses did work to bore holes in cannon barrels, an equivalent amount of heat was generated. This experiment shows that friction is a process by which energy is converted to waste forms at an interface between two surfaces. A surface with good frictional properties suggests an improved rate at which energy can be converted to its waste forms.
While friction has played a central role in the discovery of the laws of energy, it is also interesting to note that until 40 years ago there was no attempt to explain friction mechanics in an energy context. Kummer was the first to attempt to explain the mechanics of the tire-pavement interface in such a context.(3) He examines several theories of friction before presenting his unified theory. First, he examines the classical Coulomb theory of friction, which stipulates that friction is caused by the interlock of two surfaces. He dismisses the theory on the basis that the kinetic energy lost as an object is lifted over the tops of the asperities is regained when the object is lowered.
After dismissing the Coulomb theory, Kummer considers the idea of an abrasive theory, in which energy is lost through the mechanical wear of the surfaces at the interface. In the well-known Fermi estimation problem, one realizes that for every revolution of a tire, a layer of atoms approximately one atom thick is worn. When Kummer considers the small amount of matter lost in abrasion, he seriously questions whether abrasion alone can account for the amount of energy lost in a braking maneuver.
Next, Kummer considers the possibility of friction resulting from a static electrical attraction. He experimented by applying an electrical potential difference across the interface, but he found that the voltage had no effect on the friction coefficient. After dismissing the impact of static electrical forces, his attention turns to the cyclical deformation and release of the rubber. He proposes that there are two types of deformations occurring simultaneously. He proposes that the macrotexture of the pavement creates bulk material deformations that agitate the polymer chains in the bulk rubber of the tire. This phenomenon is termed hysteresis. He further proposes that a similar adhesive phenomenon exists at the interface.
Kummer proposes that friction is the sum of adhesion and hysteresis, both of which depend strongly on temperature and velocity. He also proposed that adhesion comprised approximately 80 percent of friction and proposed a mathematical model for adhesion:
![]() (1)
(1)
Where:
Fa is the adhesive force on the tire.
A is the actual contact patch area.
s is the effective junction strength.
The adhesion model is important because it explains the importance of aggregate microtexture in the frictional process. More microtexture results in a greater contact patch area and greater adhesive force.
Kummer’s observations tend to defy conventional wisdom on the topic of friction, which states that friction is the function of the normal weight and the ability of the surfaces to interlock. There are, however, some recent observations of the Tokay Gecko that also defy the conventional wisdom. The gecko’s toes have been shown to be able to cling to micromechanically smooth surfaces because of van der Waals forces generated in the millions of hairs on its toes.(4) These van der Waals forces produce what Rabinowicz terms surface energy, or the energy of a free surface.(5) He explains that this phenomenon is also the cause of surface tension in water and causes capillary rise.
In addition to his observations about surface energy and the adhesive mechanism, Rabinowicz also makes some important observations on the temperature of the surfaces in contact. He comments that when an object slides rapidly over a cooler substrate, much more waste energy will enter the substrate. This is because the sliding object keeps the same hot contact patch at the interface while the contact patch continually moves over fresh substrate.
Burchett and Rizenbergs have found that seasonal variations in skid resistance exhibit an annual sinusoidal cycle.(6) The changes in asphalt concrete surfaces were generally greater than the changes in portland cement concrete (PCC). They found that the correlation between skid number and the combination of traffic volume and temperature was as good as the correlation between skid number and day of year. It is likely that Burchett and Rizenbergs observed greater changes in asphalt surfaces because asphalt surfaces are very nearly a black body and are much more sensitive to solar radiation than are PCC pavements. They are thus are less receptive to energy vented in heat through frictional processes in hotter weather.
Henry has also made some important observations on seasonal and short-term changes in the nature of the tire-pavement interface.(7) He has observed particularly dramatic seasonal variations in the northern climates. He has observed that snow removal and winter weather highway operations cause increased microtexture in the winter and early spring. Furthermore, Henry has observed that summertime operations wear the aggregate and reduce the microtexture. It is logical to conclude that not only would these wintertime operations increase microtexture and actual contact area, but they would also provide fresh, high-energy surfaces.
Henry has also observed that poor friction performance often results after a long lack of rain. Surface contamination would likely bind the surface energy of the aggregate and tend to lubricate the interface. Henry has also observed temperature-related changes in skid resistance.
As discussed earlier, friction can be conceived as a rate-based measure of energy transfer across an interface. Consider the path diagram in figure 1 for a general braking maneuver with a locked wheel. In figure 1, K1 and K2 are properties of the interface, and the model is specified by the equations:
![]() (2)
(2)
![]() (3)
(3)
The relationship between K1 and K2 is defined as follows:
![]() (4)
(4)
The relationship of K1 to K2 is governed by the properties of the interface, but for the general system, it is expected that K2 is highly correlated with the 64 kilometers-per-hour (km/h) (40 miles-per-hour (mi/h)) skid number.
K2 is obviously a function of many variables, including but not limited to coarse and fine aggregate properties and gradations, traffic loading, pavement age, geometric conditions such as grade and degree of curve, surface contamination, mixture-related problems such as bleeding and stripping, sliding velocity, and tire properties.
However, the variables listed above are not expected to be the primary causes of seasonal variations. It is expected that intense winter weather operations will increase frictional performance as snowplows and snow tires roughen the surface, exposing newer, cleaner surfaces and increasing microtexture.
In a locked-wheel test, assuming that all kinetic energy is converted to heat at the tire-pavement interface, it follows that energy will be vented directly into the pavement or into the tire as junctions formed at the interface rupture. If the pavement is cool, heat can enter the pavement at a rapid rate, but if the pavement is hot, more heat must enter the tire. The damping properties of the rubber (particularly at the interface) will change so that less energy is dissipated in straining and releasing the tire, lessening the ability of the tire to accept energy throughout the remainder of the test. This phenomenon is observed in time plots of friction tests with initially high peak performance that degrades as the test continues. If there is less heat sink available in the pavement and in the tire, then more energy will be forced to stay in the form of vehicular kinetic energy. Reduced friction performance should then be observed.
For these reasons, the investigation will explain only the effects of snow removal and other winter weather operations and the effects of temperature on the frictional system.
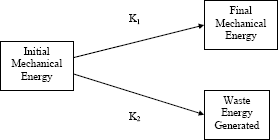
Figure 1. Conceptual model of frictional processes.
The benefit of DataPave to the research effort is tremendous. It allows researchers to conduct investigations of their choosing without spending time, money, and effort to design and execute a controlled experiment. For this reason, the investigation will use the DataPave 3.0 data.
The sections included in the study are found in the GPS–1, GPS–2, and GPS–6 studies in the DataPave 3.0 database because they contain only conventional and full-depth asphalt concrete pavement sections. Because strains are distributed much differently in an asphalt concrete overlay of PCC pavements, overlays have been excluded from the study. PCC sections, which have very different surface and mechanical properties, have also been excluded.
Because very little petrographical data existed for these sections, the data were parsed by coarse aggregate bulk specific gravity with hopes of excluding aggregates that do not have high silica content. Crowley has noticed the importance of the chain-like structure of silica tetrahedra to good frictional performance.(8) He speculates that the release of the adhesive bonds at the tire-pavement interface not only excites the polymer chains of the tire, but also likely excites the silica chains in the aggregate as well. For this reason, the bulk specific gravity of the uppermost layer was required to be between 2.60 and 2.70, as found in the DataPave INV_PMA module. The parsing process may still allow for the inclusion of some nonsiliceous material in the sample, but should exclude pure calcite with a bulk specific gravity of 2.72 and also exclude dolostones with a specific gravity of approximately 2.85. These are the two most common nonsiliceous materials used in highway construction.
The skid test information for the sections selected was extracted from the MON_FRICTION module, and latitude and longitude for each section was extracted from the INV_ID module. The information in the MON_FRICTION module included the skid number at the beginning and end of each section. Most records provided ambient air temperature. Skid tests that were not performed according to ASTM E274, Standard Test Method for Skid Resistance of Paved Surfaces Using a Full-Scale Tire, with the standard ribbed tire were excluded, as were any tests for which the exact day was not known. Tests not performed at 64 km/h (40 mi/h) are excluded from consideration. Only the skid numbers taken at the beginning of each section are used.
The nearest National Oceanic and Atmospheric Administration weather station in operation during the testing time period was selected for each site. The corresponding weather data for the 6 months before the test day were extracted from the National Climatic Data Center’s National Virtual Data System for each skid test. The information missing from the nearest weather station was either assumed on the basis of other information available or inferred from another nearby weather station. The variables extracted from the National Virtual Data System include 180-day snowfall, maximum temperature on the day of the test, and minimum temperature on the day of the test.
The 78 sites selected are in 28 States. Together, 263 skid tests were used in the analysis. The maximum skid number reported was 74 and the minimum was 16. The 25th percentile skid number was 44 and the 75th percentile skid number was 51. The mean and median skid number was 47, with a standard deviation of 8.25. The mode was 46. The skid numbers have a symmetric distribution. Figure 2 shows the distribution of the skid numbers.
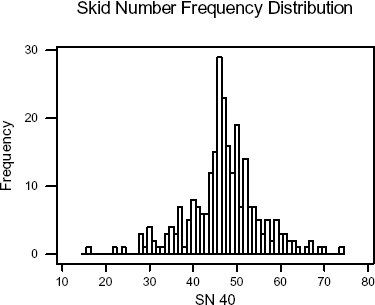
Figure 2. Skid number frequency distribution.
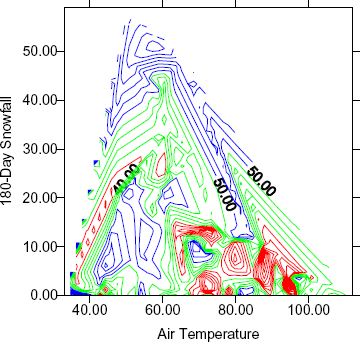
The problem of highway skid resistance is highly multidimensional. Many factors are expected to contribute to the frictional performance; some of these factors are naturally correlated with each other. For instance, heavy snowfall is expected to occur in colder climates. For this reason, if one were to examine the correlation between the skid number and snowfall as well as the correlation between the skid number and temperature, both might be significant. But whether either is causal is left unresolved. Numerically, it is difficult to assess the causality of the system, but if one uses graphical techniques, it is possible to quickly and easily distinguish whether one of these effects is not causal.
This research includes two analyses of the data compiled. First, the data were examined visually by use of contour plots to see which, if any, of the factors are significant. In the visual procedure, two plots have been used. The first plot is a post plot, which shows the location of the data points under consideration. The purpose of the post plot is to indicate contours that lie in an unpopulated region and are based on dispersed information; they are thus less stable indicators of underlying trends.
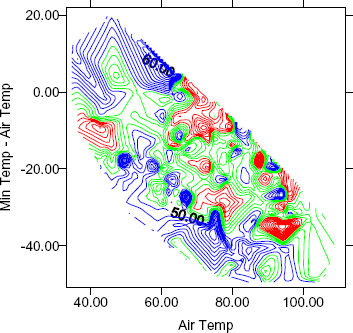
The second plot is a contour plot in which the elevations of the contour lines correspond with the skid number. The purpose of the contour plot is to enable the researcher to discern subtleties in the data. A main effect of a variable is shown by the slope of the plot in the direction of its axis. Slope in a direction not along either axis signifies a joint effect of two variables. The researcher may also find points that are unusually high or low relative to their respective cohort groups. These points are likely outliers on axes not included in the factor pairing. The outliers are not a problem, but rather the most informative points. As an aid in visually identifying the trends and outliers, contours corresponding to skid numbers of 40 and below are colored red, and contours corresponding to skid numbers of 50 and above are colored blue. Contours between 40 and 50 are colored green. These techniques allow the researcher to find patterns too complex for a computer to find.
After a thorough visual exploration, the data were numerically modeled using structural equations modeling (SEM). SEM is a tool developed by social scientists needing the ability to model the effects of concepts that they could not measure directly and is applicable to problems in scientific data analysis. SEM explains the covariance structure observed in the manifest variables with the use of latent variables. Latent variables are hypothetical constructs for which no operational methods for direct measurement exist. The purpose of SEM is to see whether the causal structure seen in several manifest variables can be described as the product of a few latent variables. SEM allows researchers to test hypotheses on causal processes.(9)
SEM involves creating a mathematical model to explain the covariance structure in the data. These models can be summarized with the equation:
![]() (5)
(5)
Structural equations models depend on the assumption of conditional independence, which states that given the values of the latent variables, the manifest variables are independent of one another. The assumption of conditional independence implies that the latent variables produce the observed relationships among the manifest variables.(9)
Structural equations models can be represented by path diagrams on which manifest variables are shown as rectangles and latent variables are shown as ovals. Arrows, or paths, show the relationships between the variables. The value associated with each path is the value of Pearson’s r for the correlation, which is also the standardized regression weight. Disturbance terms are added to the manifest variables to represent the residuals unexplained by the model. The values of the regression slopes and the variances of the disturbance terms can be estimated using software such as Amos™.
It is possible to test the significance of the regression parameters. In this process, Amos uses a bootstrap method in which the data set is sampled with replacement and the model is fit to the samples generated. From these samples, Amos can estimate the standard error of the regression slope and can return a critical ratio, which is the slope divided by its standard error. The critical ratio is a t-statistic for which the area of the tail of the t-distribution for the N minus p degrees of freedom is the probability that the regression slope is zero. In this test, N is the number of observations and p is the number of manifest variables. The area under the tail is commonly referred to as the P-value.
In this case, Amos was required to perform an analysis with incomplete data. Incomplete cases were excluded in pairs, meaning that the covariance of any two variables is computed using only the complete pairs of data common to the two variables.
The two types of factor pairings examined were the pairing of 180-day snowfall and temperature measures, and the pairing of ambient air temperature and deviations from temperature extremes.
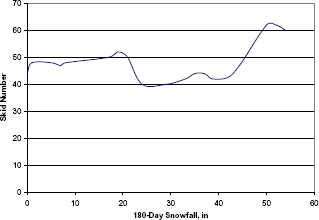
The plot of air temperature and 180-day snowfall in figure 3 shows that no main effect is associated with the snowfall axis. A main effect, however, is associated with the temperature axis. The absence of the effect of snowfall is further shown by the profile of the response surface of figure 4. taken at 15.56 °C (60 °F). On the other hand, the presence of a temperature effect is shown in figure 5, a profile of the same response surface taken at 2.7 centimeters (cm) (5 inches) of 180-day snowfall.
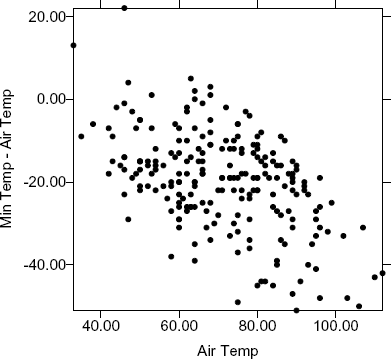
Significant organization of the data is also associated with plots of air temperature and minimum temperature on the day of the test minus air temperature, shown in figures 6 and 7. On these plots, lines of constant minimum temperature run from the upper left corner to the lower right corner, creating minimum temperature axes running from the lower left corner to the upper right corner. The plots segregate the points of poor and excellent performance along these minimum temperature axes. The poor performers have accumulated largely on the upper right side of the graphs, in the direction of higher minimum temperatures, and the excellent performers have accumulated largely on the lower left side.
The visual analysis of the data reveals no evidence of seasonal variations in skid resistance associated with snowfall removal operations and gives evidence of the existence of an independent temperature effect.
°C = (°F - 32) × 5/9
Figure 3. Contour plot of skid number versus air temperature and 180-day snowfall.
1 inch = 2.54 cm
Figure 4. Skid number versus 180-day snowfall.
°C = (°F - 32) × 5/9
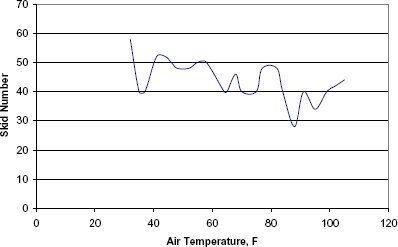
Figure 5. Skid number versus air temperature.
°C = (°F - 32) × 5/9
Figure 6. Post plot of skid number versus air temperature and minimum temperature minus air temperature.
°C = (°F - 32) × 5/9
Figure 7. Contour plot of skid number versus air temperature and minimum temperature minus air temperature.
The numerical exploration process involved fitting two structural equations models in light of the results of the visual analysis. The two structural equations models involved one latent variable called “energy transfer.” The manifest variables are assumed to be a reflection of this latent variable. The first structural equations model specified the skid number, maximum temperature, minimum temperature, and air temperature as linear functions of the single latent variable. The second model specified the same variables as the first, but included 180-day snowfall. The path diagrams for the structural equations models are shown in figures 8 and 9.
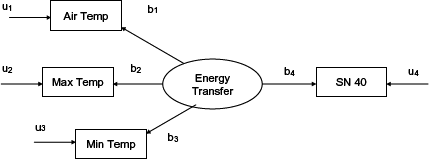
Figure 8. “Temperature alone” structural equations model.
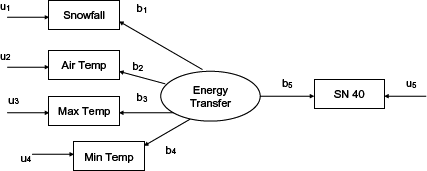
Figure 9. “Temperature and snowfall” structural equations model.
The results of the modeling process are shown in tables 1 and 2. The structural equations model without snowfall yielded path coefficients that were all significant beyond the 99.9 percent confidence level. Although the path between energy transfer and skid number is negative, the paths between the energy transfer and the temperature variables were all positive, indicating an inverse relationship between temperature and skid number.
The model could account for 5.7 percent of the variance in skid number. This means a central construct is reflected in the manifest variables and is a part of a much larger factor structure. This construct is a measure of the ability of the pavement to accept energy in the frictional process.
The addition of the snowfall variable did not increase the correlation between the latent variable energy transfer and the skid number. Although all paths were significant in the model, the correlation between the skid number and the 180-day snowfall was 0.055 and the R-square of the model for the skid number was still 0.057. This means that the addition of the snowfall variable added no descriptive power to the model. These results reaffirm the previous observations made in the contour plots and previous structural equations models that snowfall does not account for the organization in the data.
The Virginia Department of Transportation (VDOT) currently applies a seasonal deduction to the skid test measurements it takes.(10) To validate the model developed through the investigation of the DataPave data, monthly correction factors for Richmond, VA, have been developed and compared with the seasonal adjustments VDOT now uses.
From the defining structural equations of the model in figure 9 and the results in table 1, the following relationship with standardized slope is derived between temperature and skid number:
![]() (6)
(6)
In unstandardized form:
![]() (7)
(7)
with SN 40 in skid numbers and Max Temp in degrees Fahrenheit.
Using this relationship and climate normals for Richmond, a set of seasonal deductions is developed.(11) These deductions and the VDOT deductions are shown in table 3. There is agreement between the two sets of correction factors, signifying that the model is able to replicate the currently used seasonal corrections. The calculated corrections are somewhat higher than the in-place VDOT corrections. This is likely because of the exclusion of PCC pavements from the data used to develop the model.
| Regression Weights | |||||||
|---|---|---|---|---|---|---|---|
| Estimate | S.E. | C.R. | P | Label | |||
| Max Temp | Energy Transfer | 14.21 | 0.71 | 20.025 | 0.000 | b2 | |
| SN 40 | Energy Transfer | -1.965 | 0.515 | -3.816 | 0.000 | b4 | |
| Air Temp | Energy Transfer | 11.926 | 0.878 | 13.582 | 0.000 | b1 | |
| Min Temp | Energy Transfer | 12.348 | 0.706 | 17.484 | 0.000 | b3 | |
| Standardized Regression Weights | |||||||
| Estimate | |||||||
| Max Temp | Energy Transfer | 0.964 | |||||
| SN 40 | Energy Transfer | -0.239 | |||||
| Air Temp | Energy Transfer | 0.768 | |||||
| Min Temp | Energy Transfer | 0.884 | |||||
| Intercepts | |||||||
| Estimate | S.E. | C.R. | P | ||||
| Air Temp | 70.909 | 1 | 70.921 | 0.000 | |||
| Min Temp | 51.133 | 0.863 | 59.236 | 0.000 | |||
| SN 40 | 47.027 | 0.508 | 92.498 | 0.000 | |||
| Max Temp | 74.46 | 0.911 | 81.728 | 0.000 | |||
| Variances | |||||||
| Estimate | S.E. | C.R. | P | ||||
| Energy Transfer | 1 | ||||||
| u1 | 98.805 | 10.643 | 9.283 | 0.000 | |||
| u3 | 42.763 | 6.415 | 6.666 | 0.000 | |||
| u4 | 63.861 | 5.599 | 11.406 | 0.000 | |||
| u2 | 15.54 | 7.029 | 2.211 | 0.000 | |||
| Squared Multiple Correlations | |||||||
| Estimate | |||||||
| Air Temp | 0.590 | ||||||
| Min Temp | 0.929 | ||||||
| SN 40 | 0.781 | ||||||
| Max Temp | 0.057 | ||||||
S.E. - Standard Error
C.R. – Critical Ratio
P – P-Value
| Regression Weights | |||||||
|---|---|---|---|---|---|---|---|
| Estimate | S.E | C.R. | P | Label | |||
| Max Temp | Energy Transfer | 14.15 | 0.709 | 19.946 | 0.000 | b2 | |
| SN 40 | Energy Transfer | -1.967 | 0.516 | -3.813 | 0.000 | b5 | |
| Air Temp | Energy Transfer | 11.963 | 0.876 | 13.65 | 0.000 | b1 | |
| Min Temp | Energy Transfer | 12.396 | 0.703 | 17.625 | 0.000 | b3 | |
| Snowfall | Energy Transfer | -2.321 | 0.629 | -3.693 | 0.000 | b4 | |
| Standardized Regression Weights | |||||||
| Estimate | |||||||
| Max Temp | Energy Transfer | 0.960 | |||||
| SN 40 | Energy Transfer | -0.239 | |||||
| Air Temp | Energy Transfer | 0.771 | |||||
| Min Temp | Energy Transfer | 0.887 | |||||
| Snowfall | Energy Transfer | -0.232 | |||||
| Intercepts | |||||||
| Estimate | S.E. | C.R. | P | ||||
| Air Temp | 70.917 | 1 | 70.94 | 0.000 | |||
| Min Temp | 51.133 | 0.863 | 59.236 | 0.000 | |||
| SN 40 | 47.027 | 0.508 | 92.498 | 0.000 | |||
| Max Temp | 74.460 | 0.911 | 81.728 | 0.000 | |||
| Snowfall | 3.932 | 0.619 | 6.351 | 0.000 | |||
| Variances | |||||||
| Estimate | S.E. | C.R. | P | ||||
| Energy Transfer | 1 | ||||||
| u1 | 97.878 | 10.55 | 9.278 | 0.000 | |||
| u3 | 41.573 | 6.28 | 6.620 | 0.000 | |||
| u5 | 63.853 | 5.60 | 11.403 | 0.000 | |||
| u2 | 17.256 | 6.824 | 2.529 | 0.011 | |||
| u4 | 95.008 | 8.33 | 11.406 | 0.000 | |||
| Squared Multiple Correlations | |||||||
| Estimate | |||||||
| Snowfall | 0.054 | ||||||
| Air Temp | 0.594 | ||||||
| Max Temp | 0.921 | ||||||
| Min Temp | 0.787 | ||||||
| SN 40 | 0.057 | ||||||
| Month | Model | VDOT |
|---|---|---|
| January | 5.8 | 3.7 |
| February | 5.2 | 3.7 |
| March | 4.0 | 3.1 |
| April | 2.6 | 1.7 |
| May | 1.6 | 0.7 |
| June | 0.5 | 0.3 |
| July | 0.0 | 0.0 |
| August | 0.2 | 0.0 |
| September | 1.1 | 0.6 |
| October | 2.5 | 1.7 |
| November | 3.8 | 3.1 |
| December | 5.2 | 3.7 |
The investigation of the friction data selected has shown that the seasonal variations in the data set cannot be attributed to snowfall removal and winter weather highway operations. However, it is likely that temperature-related effects create the seasonal variations observed in the data set. This result is significant because it implies that seasonal variations in pavement friction depend on variables not related to surface texture. The observations support prior assertions that the release of energy through hysteresis and adhesion is the principal cause of tire friction.
Temperature-related effects accounted for approximately 5.7 percent of the total variance in the skid numbers, and these effects are statistically significant. These results imply that temperature effects are part of a much larger factor structure. Further investigations performed in a similar manner should reveal more fully the impact of factors such as aggregate size and properties, wear, rainfall and surface contamination, tire properties, and the amount of water present. These investigatory techniques can also be applied to DataPave structural data with good result.
Transportation Research Board Long-Term Pavement Performance Committee. (2001). Fulfilling the Promise of Better Roads: A Report of the TRB Long-Term Pavement Performance Committee. Transportation Research Board, Washington, DC.
Feynman, R. (1995). Six Easy Pieces: Essentials of Physics Explained by its Most Brilliant Teacher. Originally prepared for publication by Robert B. Leighton and Matthew Sands, new introduction by Paul Davies. Reading, MA: Helix Books.
Kummer, H. (1966). Unified Theory of Rubber and Tire Friction: Engineering Research Bulletin B-94. Pennsylvania State University, State College, PA.
Autumn, K., Sitti, M., Liang, Y., et al. (2002). “Evidence for van der Waals Adhesion in Gecko Setae.” Proceedings of the National Academy of Sciences, vol. 99, no.19. Washington, DC.
Rabinowicz, E.R. (1995). Friction and Wear of Materials (2nd ed.). New York: John Wiley and Sons.
Burchett, J. and Rizenbergs R. (1980). “Seasonal Variations in the Skid Resistance of Pavements in Kentucky.” Transportation Research Record, Transportation Research Board, Washington, DC. 788, 6–14.
Henry, J., and Saito, K. (1983). “Mechanistic Model for Seasonal Variations in Skid Resistance.” Transportation Research Record, Transportation Research Board, Washington, DC. 946, 29-38.
Crowley, L. (2001). Skid Resistance of Asphalt Wearing Courses Made With Limestone Aggregates. Alabama Department of Transportation, Montgomery, AL.
Everitt, B. (1984). An Introduction to Latent Variable Models. London: Chapman and Hall.
Henry, J. (2000). National Cooperative Highway Research Program Synthesis 291: Evaluation of Pavement Friction Characteristics. Transportation Research Board, Washington, DC.
National Climatic Data Center. (2002). “Monthly Station Normals of Temperature, Precipitation, and Heating and Cooling Degree Days 1971–2000.” Climatography of the United States No. 81, 44 Virginia. Asheville, NC.

