U.S. Department of Transportation
Federal Highway Administration
1200 New Jersey Avenue, SE
Washington, DC 20590
202-366-4000
Federal Highway Administration Research and Technology
Coordinating, Developing, and Delivering Highway Transportation Innovations
 |
| This report is an archived publication and may contain dated technical, contact, and link information |
|
Publication Number: FHWA-HRT-06-121 Date: November 2006 |
To further the investigation of frost penetration and multiple FTCs, an indepth comparison of predicted performance was conducted for all of the States contributing to the pooled fund study. Information on the environment for every test section used in the analysis dataset and located in one of the PFS is provided in table 23. The test sections highlighted in the table were selected as the representative climate conditions for the respective agency. These values were used along with constant nonenvironmental factors, shown in table 20, to predict flexible pavement performance.
| State | Site | FTC | FI | CI | PRECIP |
|---|---|---|---|---|---|
| Alaska | 1002 | 112 | 793 | 0 | 2020 |
| Alaska | 1001 | 124 | 890 | 0 | 1116 |
| Alaska | 1004 | 87 | 1110 | 2 | 420 |
| Alaska | 6010 | 92 | 1248 | 1 | 413 |
| Alaska | 9035 | 106 | 1513 | 3 | 729 |
| Alaska | 1008 | 74 | 2584 | 23 | 317 |
| Alaska | average | 99 | 1356 | 5 | 836 |
| Idaho | 1001 | 113 | 217 | 158 | 693 |
| Idaho | 1005 | 121 | 399 | 339 | 627 |
| Idaho | 1007 | 121 | 326 | 271 | 254 |
| Idaho | 1009 | 137 | 351 | 221 | 262 |
| Idaho | 1010 | 136 | 665 | 144 | 303 |
| Idaho | 1020 | 128 | 328 | 331 | 280 |
| Idaho | 1021 | 129 | 622 | 149 | 342 |
| Idaho | 3017 | 125 | 356 | 344 | 342 |
| Idaho | 3023 | 107 | 278 | 400 | 295 |
| Idaho | 6027 | 162 | 817 | 57 | 380 |
| Idaho | 9032 | 111 | 259 | 121 | 718 |
| Idaho | 9034 | 117 | 316 | 89 | 807 |
| Idaho | average | 127 | 432 | 213 | 398 |
| Illinois | 1003 | 79 | 212 | 742 | 1052 |
| Illinois | 6050 | 78 | 239 | 747 | 995 |
| Illinois | 1002 | 96 | 652 | 383 | 871 |
| Illinois | average | 84 | 368 | 624 | 973 |
| Indiana | 1028 | 80 | 217 | 696 | 1209 |
| Indiana | 1037 | 73 | 152 | 821 | 1186 |
| Indiana | 2008 | 84 | 399 | 471 | 963 |
| Indiana | 3002 | 84 | 451 | 520 | 950 |
| Indiana | 3003 | 88 | 454 | 453 | 1005 |
| Indiana | 3030 | 88 | 386 | 476 | 1017 |
| Indiana | 3031 | 70 | 230 | 772 | 1165 |
| Indiana | 6012 | 71 | 215 | 798 | 1165 |
| Indiana | average | 80 | 313.1 | 625.9 | 1082.5 |
| Michigan | 0200 | 86 | 382 | 443 | 866 |
| Michigan | 0100 | 105 | 510 | 324 | 870 |
| Michigan | 1010 | 91 | 532 | 309 | 825 |
| Michigan | 1013 | 109 | 568 | 251 | 915 |
| Michigan | 1012 | 115 | 612 | 230 | 931 |
| Michigan | 3068 | 109 | 670 | 215 | 827 |
| Michigan | 1001 | 109 | 759 | 174 | 790 |
| Michigan | 6016 | 100 | 787 | 173 | 751 |
| Michigan | 1004 | 77 | 960 | 131 | 878 |
| Michigan | average | 100 | 642 | 250 | 850 |
| New York | 0800 | 87 | 437 | 319 | 891 |
| New York | 1011 | 90 | 505 | 298 | 1007 |
| New York | 1008 | 87 | 582 | 257 | 1133 |
| New York | 1643 | 99 | 618 | 270 | 1006 |
| New York | 1644 | 109 | 990 | 111 | 1110 |
| New York | average | 94 | 627 | 251 | 1029 |
| North Carolina | 0800 | 47 | 14 | 998 | 1343 |
| North Carolina | 1645 | 57 | 19 | 975 | 1260 |
| North Carolina | 1030 | 50 | 24 | 951 | 1192 |
| North Carolina | 2825 | 52 | 28 | 965 | 1093 |
| North Carolina | 1352 | 69 | 32 | 876 | 1232 |
| North Carolina | 1028 | 54 | 32 | 870 | 1186 |
| North Carolina | 3008 | 67 | 33 | 815 | 1212 |
| North Carolina | 1006 | 60 | 35 | 887 | 1153 |
| North Carolina | 2819 | 69 | 43 | 799 | 1139 |
| North Carolina | 3816 | 71 | 44 | 830 | 1141 |
| North Carolina | 3011 | 71 | 45 | 867 | 1151 |
| North Carolina | 3807 | 77 | 46 | 772 | 1142 |
| North Carolina | 1817 | 74 | 46 | 779 | 1126 |
| North Carolina | 0200 | 83 | 47 | 773 | 1151 |
| North Carolina | 3044 | 77 | 49 | 784 | 1161 |
| North Carolina | 1992 | 73 | 53 | 779 | 1221 |
| North Carolina | 2824 | 73 | 54 | 780 | 1224 |
| North Carolina | 1802 | 82 | 58 | 775 | 1110 |
| North Carolina | 1024 | 93 | 59 | 475 | 1308 |
| North Carolina | 1814 | 100 | 70 | 446 | 1477 |
| North Carolina | 1803 | 107 | 86 | 407 | 1371 |
| North Carolina | 1801 | 88 | 116 | 323 | 1205 |
| North Carolina | 1040 | 109 | 141 | 218 | 1441 |
| North Carolina | average | 74 | 51 | 745 | 1219 |
| Ohio | 3801 | 89 | 249 | 480 | 1037 |
| Ohio | 3013 | 89 | 250 | 533 | 1140 |
| Ohio | 0100 | 96 | 375 | 414 | 972 |
| Ohio | 0200 | 96 | 375 | 414 | 972 |
| Ohio | 0800 | 96 | 375 | 414 | 972 |
| Ohio | average | 93 | 325 | 451 | 1018 |
| Pennsylvania | 3044 | 99 | 269 | 433 | 1164 |
| Pennsylvania | 1623 | 95 | 309 | 415 | 1004 |
| Pennsylvania | 1608 | 107 | 311 | 334 | 944 |
| Pennsylvania | 1605 | 107 | 331 | 339 | 1092 |
| Pennsylvania | 1618 | 100 | 343 | 270 | 1028 |
| Pennsylvania | 1597 | 111 | 514 | 196 | 865 |
| Pennsylvania | 1599 | 124 | 546 | 141 | 1121 |
| Pennsylvania | average | 106 | 375 | 304 | 1031 |
| Note: Shaded cells denote climate selected as representative for agency. |
Figure 60 shows pavement roughness predictions. In comparing these results with the confidence interval results in figures 44 and 45, it appears that Alaska’s climate contributes to larger accumulations of pavement roughness compared to the other agencies; however, because the differences in performance are relatively small, it is doubtful that they are significant.
Figure 60. Scatter chart. Flexible pavement IRI for selected sites in each agency.
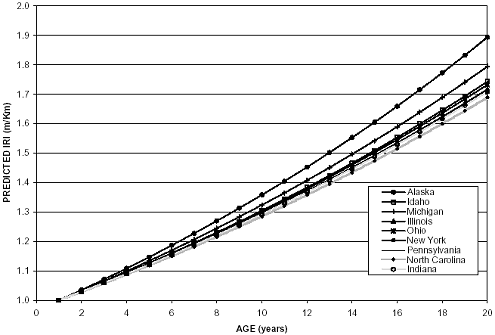
| 1 m/km = 5.28 ft/mi |
Figure 61 lists rutting performance predictions for each of the agency’s representative climates. The confidence interval information in figures 48 and 49 can be used to determine the significance of the predicted differences between the participating agencies. The most obvious observation is the small accumulation of rutting predicted in Alaska and North Carolina in comparison with all other PFS, which appears to be significantly less than the climates in Idaho, Pennsylvania, and New York. All other variations in rutting performance do not appear to be significant.
While the climate in Alaska contributes to minimal amounts of rutting, the tradeoff is evident in the development of transverse cracking. From figure 62, transverse cracking in Alaska initiates very early in the pavement life and reaches a maximum deduct value at age 16 years. This is the likely source of increased pavement roughness values predicted for Alaska in figure 60. Transverse cracking predictions for North Carolina are significantly smaller than all of the other agencies. Climates in Illinois and Indiana exhibit transverse cracking that is very similar, and the contribution of these climates results in significantly smaller amounts of transverse cracking compared to Michigan and New York. Predictions for Idaho, Ohio, and Pennsylvania fall in between the Illinois/Indiana and Michigan/New York climates; however, the differences are insignificant, and they may be the result of error within the regression models.
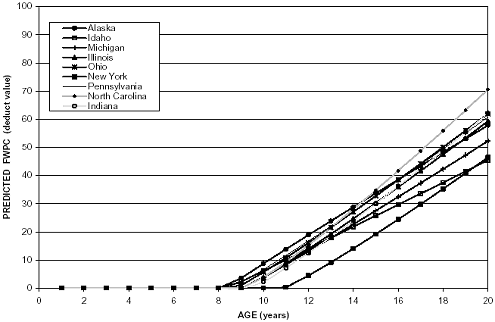
Last, figure 63 provides fatigue and wheelpath cracking predictions for each of the respective agency climates. Predicted cracking in the New York and Indiana regions are slightly less than the other agencies. These differences, however, are not significant.
Figure 61. Scatter chart. Flexible pavement RUT for selected sites in each agency.
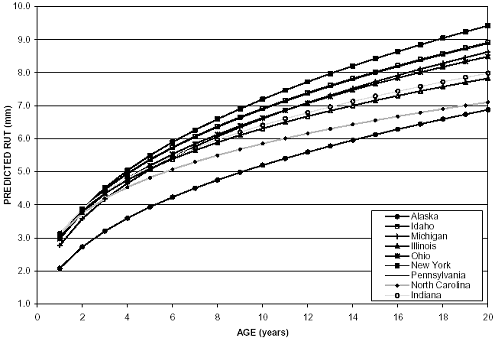
| 1 mm = -0.04 inch |
Figure 62. Scatter chart. Flexible pavement TC for selected sites in each agency.
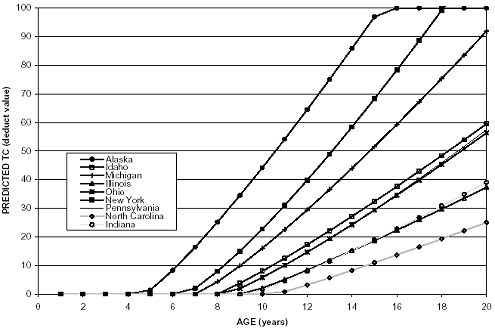
Figure 63. Scatter graph. Flexible pavement FWPC for selected sites in each agency.
It should be noted that these comparisons were based on the environmental conditions observed at one representative location within the agency. It is well known that climates can vary drastically from one location to the next within an agency and a so-called representative climate does not accurately describe climatic conditions for all areas of the agency. As such, an evaluation of regional environments was conducted for each participating state.
Figures 83 through 91 in appendix C show State maps containing the geographic location of each test section used in the study. Tables below each of the figures contain environmental and pavement structure information (GPS test sections only) corresponding to the test sections. Test sections in each agency were grouped based on FI. Some States exhibit climates that fall within the different climatic zones established for the analysis (i.e., deep-freeze, moderate-freeze, and no-freeze). Test sections were grouped based on climatic zone for these cases. In other States, all climates were characteristic of one of the defined zones; however, the test sections were divided where large differences in FI were noted. For example, all test sections in New York fall into the deep-freeze region, but the FI at site 1644 is considerably higher; therefore, this site was separated from the average of the remaining sites in New York.
Some of the largest climatic variations occur in Idaho and Michigan. To highlight the differences in performance across one state, environmental factors from two sites in each of these States were used, along with the standard nonenvironmental factors in table 19, to predict performance. In Idaho sites 1001 and 6027 were selected because they are at the two climatic extremes in the State. Similarly, sites 0200 and 1004 were selected from Michigan.
Figure 64 provides FWPC predictions for the Idaho sites. Site 1001 exhibits a predicted deduct value of more than 2.5 times larger than the prediction for site 6027 at 20 years. This is a significant difference. It is interesting to note that site 1001 has lower FI and FTC values in comparison with site 6027. However, site 1001 is in the wet region while site 6027 is in the dry region. In addition, site 6027 has a larger CI than site 1001.
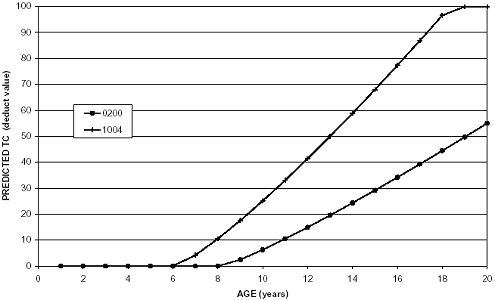
TC predictions for the two sites in Michigan can be found in figure 65. Predictions for site 1004 reach a maximum level of 100, while the predictions for the environment at site 0200 are at approximately 50. The environment at site 1004 has a very large FI value in comparison to site 0200. Conversely, CI is smaller at site 1004 than at site 0200. Both are in the wet region and experience similar amount of FTCs (77 and 86 for site 1004 and 0200, respectively).
These examples highlight the regional differences in performance that can be expected in one State given a constant pavement structure and traffic loading conditions.
Figure 64. Scatter graph. FWPC predictions for sites 1001 and 6027 in Idaho.
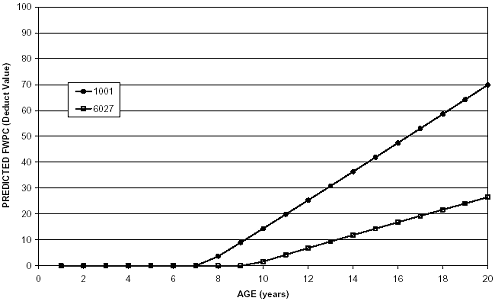
Figure 65. Scatter graph. Flexible TC predictions for the environments at sites 0200 and 1004 in Michigan.