U.S. Department of Transportation
Federal Highway Administration
1200 New Jersey Avenue, SE
Washington, DC 20590
202-366-4000
Federal Highway Administration Research and Technology
Coordinating, Developing, and Delivering Highway Transportation Innovations
 |
| This report is an archived publication and may contain dated technical, contact, and link information |
|
Publication Number: FHWA-HRT-08-057 Date: November 2008 |
To obtain a better understanding of the early LTPP frost depth determination procedures, the LTPP reports, SMP directives, software, and other literature relating to detection of frost in unbound pavement layers were obtained and reviewed in detail. In addition, a coordination meeting took place between the Data Analysis Technical Support (DATS) team, FHWA/LTPP team and regional service centers, and Technical Support Services Contract (TSSC) representatives. The review included SMP installation/de-installation reports, the procedures and equipment used to collect data needed for the interpretation of LTPP ER and TDR data, and the quality control (QC) procedures used to evaluate the SMP data prior to upload into the database, all of which include the following documents: (See references 3, 4, 5, 6, 7,8, and 9.)
In the SMP I experiment, 37 test sites were instrumented to measure ER, moisture content, and temperature in the unbound pavement layers (base and subbase) and the upper layers of subgrade. The LTPP SMP instrumentation layout is shown in figure 1. The techniques, equipment, and schemes of data collection under the SMP are described in detail in the LTPP Seasonal Monitoring Program: Instrumentation Installation and Data Collection Guidelines, Report No. FHWA-RD-94-110.(4) This section of the report provides a summary of how temperature, moisture, and ER data are collected and their relevance to frost penetration in pavement layers.
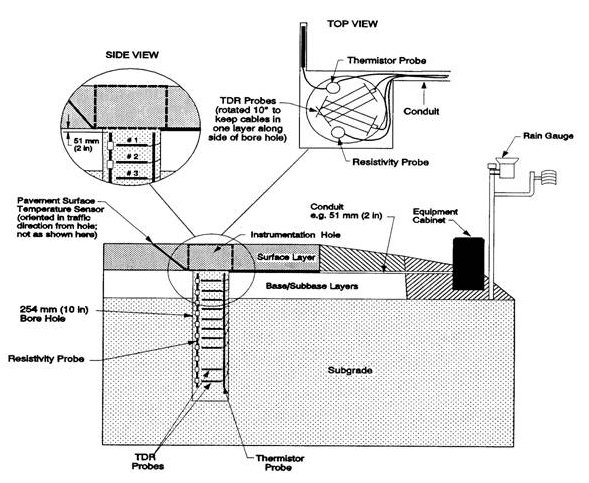
Figure 1. Illustration. LTPP SMP instrumentation layout.(4)
The electrical resistivity probes used in the initial SMP program were developed by the U.S. Army Corps of Engineers' Cold Regions Research and Engineering Laboratory (CRREL). The probes were installed to monitor the freeze state in the unbound pavement layers and the top subgrade layers. Each resistivity probe consists of 36 metal wire electrodes spaced 51 mm (2 inches) apart on a solid polyvinyl chloride (PVC) rod 1.9 m (73 inches) long. The top of the resistivity probe was installed approximately 50 mm (2 inches) below the bottom of the lowest bound pavement layer. The weakness with this multiplexer was that there was no reference to check the voltage outputs recorded.
In the SMP II experiment, the CRREL multiplexer was replaced with an ERB20 multiplexer, manufactured by ABF Manufacturing, Inc. This multiplexer provides an input voltage at the start of each cycle and reference voltage through a 100k resistor at the completion of the cycle.
The electrical resistivity technique is based on the fact that the bulk resistivity of a soil increases dramatically when the soil freezes. Electricity is conducted exclusively by the pore water contained in the soils because the soil minerals and air voids are nonconductive. The electrical resistivity of frozen water is much higher than that of liquid water, and this difference is used to differentiate between frozen and unfrozen soil. However, if water content is low, or if the water phase is discontinuous, the difference in electrical resistivity between the frozen and unfrozen soil is difficult to detect reliably.
For SMP I, the automated and manual resistivity profiles were collected at the time of the Falling Weight Deflectometer (FWD) data collection to evaluate changes in layer stiffness based on the soil properties. As a result, only limited ER measurements were taken at the time of FWD data collection for the majority of LTPP sites: once a month or less every other year for SMP I sites and six months a year for SMP II noncontinuous sites. During the SMP II experiment, more extensive ER data were collected at selected continuous monitoring sites.
The challenge working with ER data is that the majority of data were not collected continuously, except at a few SMP II sites that were set up for continuous monitoring. Sparse measurements make it difficult to capture the beginning and ending of freezing and thawing periods. Changes in ER equipment and measuring techniques also created challenges when comparing the values collected during the SMP I and SMP II experiments.
For the SMP I experiment, ER data were stored in the following tables:
Since the launch of the SMP II program, the collection, processing, and storage of ER data for SMP II sites has been modified. The SMP II ER data are collected using different continuous automatic equipment and are stored in the following tables:
The sites that were moved from the SMP I experiment to the SMP II experiment have ER data collected prior to 2000 in the old ER data tables and ER data collected after 1999 in the new data tables. In addition, manually collected ER data are stored in the tables used in SMP I.
The volumetric moisture content (VMC) is determined using TDR probes placed at approximately 10 depths in the unbound base, subbase (if present), and subgrade layers. The VMC represents a ratio of the volume of water to the total volume (soil solids + water + voids). The probe closest to the pavement surface was installed at the mid-height of the highest unbound layer unless that layer was more than 300 mm (12 inches) thick, in which case the probe was installed 150 mm (6 inches) below the top of the layer regardless of thickness. The next seven probes were installed at 150-mm (6-inch) depth intervals, and the two deepest probes were installed at 300-mm (12-inch) depth intervals, thereby placing the deepest probe approximately 1.8 m (6 ft) below the top of the highest unbound pavement layer.
The data collected with the TDR instrumentation are used to determine the dielectric constants for the soil. The volumetric moisture content is then computed using regression equations relating the dielectric constant to moisture content, which are discussed in Report No. FHWA-RD-99-115.(10) The results from the recently completed LTPP data analysis study LTPP Computed Parameter: Moisture Content, Report No. FHWA-HRT-08-030,(22) contain computed volumetric moisture content values estimated based on the dielectric constant and properties of soil using calibrated micromechanics equation. These results are included in the LTPP table MP_TDR_MOISTURE.
Since the dielectric constant for ice is significantly different than that for water, the water contents measured by the TDR probes during the frozen periods may reflect the presence of ice.
Like the ER data, the majority of TDR data were not collected continuously, except at a few SMP II sites that were set up for continuous monitoring. Sparse measurements make it difficult to capture the beginning and ending of freezing and thawing periods.
The temperature profile is measured by thermistors installed at 18 depths through pavement structure. The thermistors are permanently installed in a 0.25-m (10-inch) diameter hole located near the section end. The first three thermistors are embedded in the surface bound layer, and the rest are embedded in the base, subbase, and subgrade layers. The five thermistors closest to the pavement surface are spaced 75 mm (3 inches) apart. The rest are spaced 150 mm (6 inches) apart. Data from the first five thermistors are recorded hourly. Daily temperature statistics, including maximum, minimum, average temperature, and times of maximum and minimum temperature, are recorded for all thermistors in table SMP_MRCTEMP_AUTO_DAY_STATS.
Subsurface temperature measurements are taken every day, providing a complete picture of temperature changes in subsurface layers throughout the year. Seasonal temperature trends can be used to correlate temperature, moisture, and ER data. From these correlations, it is possible to establish freezing and thawing temperatures, freezing isotherm, and the freeze state of the soil for a given SMP section.
Previous LTPP frost penetration methodology is documented in FHWA, Determination of Frost Penetration in LTPP Sections, Report No. FHWA-RD-99-088.(3) This report was reviewed in detail to obtain a thorough understanding of the procedures used to generate the existing LTPP computed parameter tables with regard to frost depth in unbound pavement layers. The previous method used to determine SMP_FREEZE_STATE and SMP_FROST_PENETRATION is shown in the flowchart in figure 2.
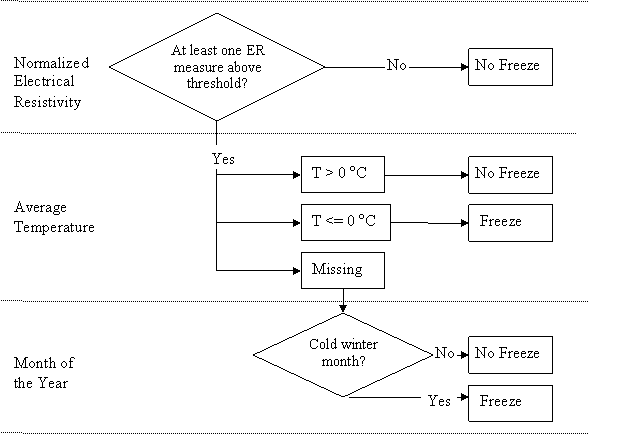
Figure 2. Chart. Previous FROST decision tree.
Upon review of the SMP I and II experimental designs and LTPP frost analysis methodology, the following shortcomings and potential future improvements were identified:
Previously estimated frost information stored in the SMP_FREEZE_STATE and SMP_FROST_PENETRATION tables was reviewed during the study. The estimates were available for 37 SMP I sections and 12 SMP II sections and are listed in table 1 for the period from 1994 to 2001.
| STATE_CODE | SHRP_ID | SMP I | SMP II | State |
|---|---|---|---|---|
| 4 | 1024 | Y | Arizona | |
| 8 | 1053 | Y | Colorado | |
| 9 | 1803 | Y | Connecticut | |
| 16 | 1010 | Y | Idaho | |
| 18 | 3002 | Y | Indiana | |
| 20 | 4054 | Y | Kansas | |
| 23 | 1026 | Y | Maine | |
| 24 | 1634 | Y | Maryland | |
| 25 | 1002 | Y | Massachusetts | |
| 27 | 1018 | Y | Minnesota | |
| 27 | 1028 | Y | Minnesota | |
| 27 | 4040 | Y | Minnesota | |
| 27 | 6251 | Y | Y | Minnesota |
| 30 | 0114 | Y | Y | Montana |
| 30 | 8129 | Y | Montana | |
| 31 | 0114 | Y | Y | Nebraska |
| 31 | 3018 | Y | Y | Nebraska |
| 32 | 0101 | Y | Y | Nevada |
| 32 | 0204 | Y | Nevada | |
| 33 | 1001 | Y | New Hampshire | |
| 36 | 0801 | Y | Y | New York |
| 36 | 4018 | Y | New York | |
| 39 | 0204 | Y | Ohio | |
| 39 | 0901 | Y | Y | Ohio |
| 42 | 1606 | Y | Y | Pennsylvania |
| 46 | 0804 | Y | Y | South Dakota |
| 46 | 9187 | Y | South Dakota | |
| 48 | 1077 | Y | Texas | |
| 49 | 1001 | Y | Utah | |
| 49 | 3011 | Y | Utah | |
| 50 | 1002 | Y | Y | Vermont |
| 56 | 1007 | Y | Wyoming | |
| 83 | 1801 | Y | Y | Manitoba |
| 83 | 3802 | Y | Manitoba | |
| 87 | 1622 | Y | Ontario | |
| 89 | 3015 | Y | Y | Quebec |
| 90 | 6405 | Y | Saskatchewan |
The primary method of reviewing the LTPP frost estimates was by examining the ER, moisture, and temperature data collected as part of the SMP study and then comparing the trends observed in these data with freeze estimates obtained from the LTPP database. During the review, the following potential data problems and drawbacks of previous methodology were identified:
The results of review are discussed in detail in the following subsections.
The sparse ER data put limitations on the accuracy and validity of the frost estimates. The example in figure 3 demonstrates the limitation of the frost penetration estimates attributed to limited ER data availability. The example shows a comparison between frost predictions based on ER and temperature data for SMP II section 0114 in Montana for the 2000–2001 winter season. The frost penetration profile based on ER probe measurements is laid over the freeze state predictions based on subsurface temperature profile, as shown in the graph's legend. Blue "Freeze" cells indicate temperatures below -1 °C. Grey "No Freeze" cells indicate temperatures above 0 °C. Yellow cells indicate temperatures between 0 ° and -1 °C. Burgundy cells indicate a freeze state based on ER data.
As can be seen from the plot, ER data were collected almost daily during November 2000. Frost predictions show agreement between temperature-based and ER-based predictions for this period. However, no ER data were collected again until January 8, 2001. As a result, the LTPP database contains no frost penetration predictions for December 2000, while temperature data strongly suggest a freeze state up to 1 m (3.28 ft) in depth, as indicated by the blue region. After data collection on January 8, 2001, no ER measurements are reported until mid March 2001, completely missing the spring thaw period.
Figure 4 shows a comparison of ER, temperature, and moisture trends for the same site, as evaluated 0.52 m (1.71 ft) below the pavement surface. ER and moisture data are reported on the left axis. ER data are normalized between 0 and 1 to provide better means for analysis of seasonal fluctuations. Temperature data are reported in degrees (°) Celsius on the right axis. The following can be observed from this figure:
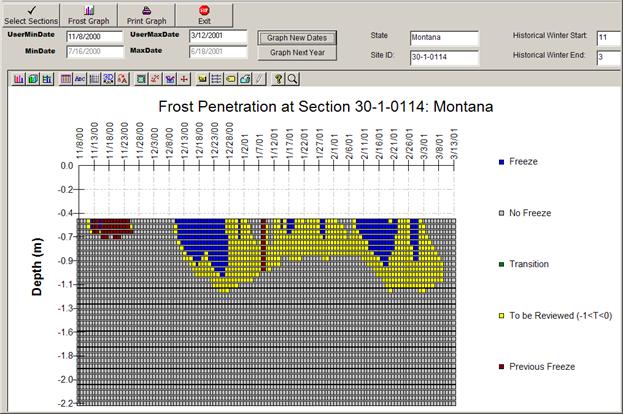
Figure 3 . Chart. Frost predictions for section 0114 in Montana.
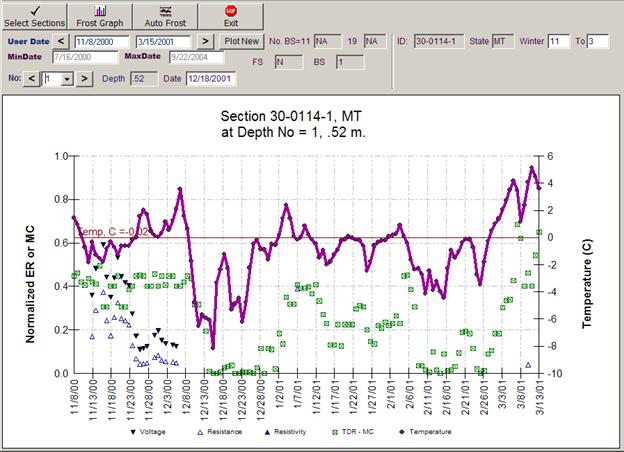
Figure 4. Chart. Comparison of ER, temperature, and moisture trends for section 0114 in Montana.
Figure 5 shows frost predictions for SMP I site 1028 in Minnesota. While most ER-based frost predictions (marked as "Previous Freeze" on the plot) follow the temperature-based frost predictions, it is evident that ER-based frost estimates are more questionable when temperatures are between 0 °C and -1 °C (see yellow section of the plot). The state of soil may be in transition between frozen and unfrozen for these temperatures.
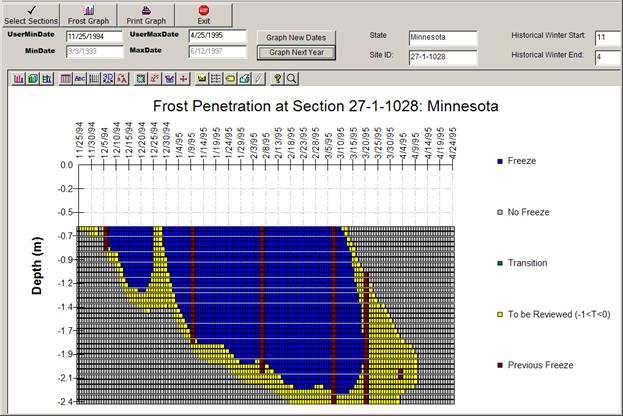
Figure 5. Chart. Frost predictions for section 1028 in Minnesota.
Review of the ER data pointed to the instability in ER trends—ER values may go down during freezing temperatures and up during hot summer months, although the opposite trend is expected. Because the previous methodology relies heavily on the ER data, such ER trends may result in inaccurate frost estimates.
Figure 6 illustrates the failure to predict frost penetration at lower depths where soil temperature remained below -1 °C for extended periods of time. The reasons for inaccurate frost predictions include subjectivity when establishing an ER threshold value and unexplained dips in ER values during the cold season. Figure 7 shows changes in ER, moisture, and temperature values with time at a depth of 1.01 m (3.31 ft). Examination of the temperature data in figure 7 indicates that freezing at that depth occurred during mid to late December. The freezing process was accompanied by a constant temperature around 0 °C for several days while heat loss took place. After that period, the soil temperature fell below 0 °C, indicating a freeze state. The soil remained frozen until mid March, when temperatures rose above 0 °C and moisture content increased. Moisture content values decreased sharply between December and April, also indicating a "Freeze" condition.
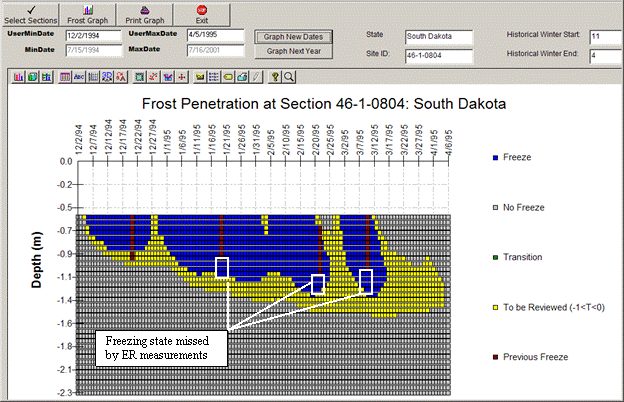
Figure 6. Chart. Frost predictions for section 0804 in South Dakota for 1994–1995 winter season.
The example in figure 7 shows high fluctuations in resistivity values taken in February and then in early March 2005. The ER values differ by over 80 percent, although temperature and moisture data indicate that the soil remained frozen for both dates.
Further data review indicates that the accuracy of ER predictions had improved once the same sections became part of the SMP II continuous monitoring experiment. However, ER-based determination of frost penetration for temperatures just below the freezing point remained challenging.
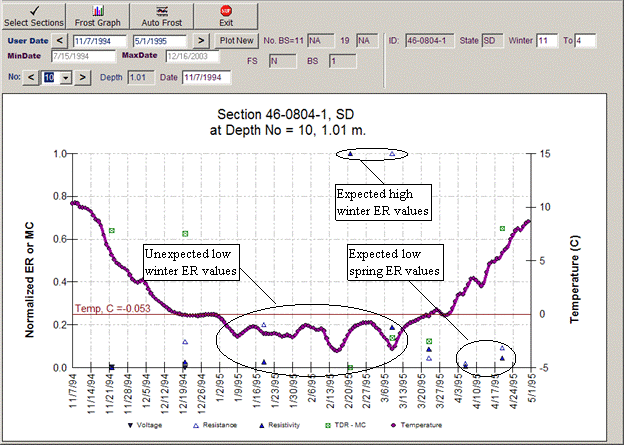
Figure 7. Chart. Comparison of ER, temperature, and moisture trends for section 0804 in South Dakota at 1.01 m (3.31 ft) depth.
There were eight sites with noncontinuous frost regions found in the LTPP database during the data review task. Each case with noncontinuous frost regions was reviewed. The following reasons were found that might have affected judgment when assigning noncontinuous frost regions:
In all cases, assignments of freeze or no freeze conditions were highly subjective. Other noncontinuous frost layers could form as a result of thawing and refreezing of the top layers while a deep frozen layer remained in place until the end of the freezing period. Identifying areas of noncontinuous frost regions is difficult using either ER or temperature data. ER measurements can be ambiguous at the freezing isotherm. Temperature data are not adequate to identify noncontinuous frost regions because nonfrozen water between two frozen zones would be very near to 0 °C.
To remove some subjectivity in these assignments, moisture content analysis could be added to the frost analysis algorithm.
Two conclusions have been drawn from reviewing the existing LTPP frost data. The first conclusion is that the previous values for SMP_FREEZE_STATE and SMP_FROST_PENETRATION are not describing the actual freeze conditions in the subsurface layers accurately. This conclusion is primarily derived from examining the previously derived LTPP frost data. The reasons are as follows:
The second conclusion is that a more accurate determination of the freeze state of the soil is possible by using subsurface temperature and moisture data in addition to ER measurements more extensively and by incorporating thermodynamic modeling to fill the gaps in measured temperature data. Thermodynamic modeling also could be useful for analyzing heat and moisture transfer processes that take place in subsurface layers, as well as assisting the analyst with frost predictions.
| << Previous | Contents | Next >> |

