U.S. Department of Transportation
Federal Highway Administration
1200 New Jersey Avenue, SE
Washington, DC 20590
202-366-4000
Federal Highway Administration Research and Technology
Coordinating, Developing, and Delivering Highway Transportation Innovations
| REPORT |
| This report is an archived publication and may contain dated technical, contact, and link information |
| Publication Number: N/A Date: November 2001 |
Publication Date: November 2001
|
PDF files can be viewed with the Acrobat® Reader®
LTPP TSSC
November 1, 2001
Software version 1.61
TABLE OF CONTENTS
3.1 PREFS4. Data Viewer
3.2 DB Connect
3.2.1 Setting up a Data Source3.3 Data Loader
3.2.2 Data Source Selection3.3.1 Post-Processing File Location3.4 File Tracker
3.3.2 Summary Data
3.3.3 Output Files
3.3.4 Transmittal Sheets
3.3.5 Processing Outcomes for Bad Data Files
3.3.6 User Notes3.4.1 Plett-Plot3.5 Graph MGR
3.4.2 User Notes3.5.1 Site and Data Selection3.6 PRF Editor
3.5.2 Graph Selection
3.5.3 Data Selection Options for Vehicle Based Graphs
3.5.4 Graph Template Manger
3.5.5 Printing Graphs
3.5.6 User Notes3.6.1 Purge File Structure3.7 Card Statistics
3.6.2 Standard entries used in PURGE files
3.6.3 User Notes3.7.1 AVC Statistics3.8 QC Report
3.7.2 Weight Card Statistics Report
4.1 Viewing Classification Records5. Interpreting Results of QC Processing
4.2 Viewing Weight Records
5.1 4-Card DataA. LTPP QC System Requirements5.1.1 Time Check Edit5.2 7-Card Data
5.1.2 4+ Consecutive Static Volumes Edit
5.1.3 8+ Consecutive Zero Volumes
5.1.4 Missing Hourly Volume5.2.1 Distribution of Gross Vehicle Weight5.3 7-card, 4-card Comparisons5.3.1 Volume Comparison5.4 Generating Statistics using the ORACLE tables
5.3.2 Vehicle Class Distribution Comparison5.4.1 List of Days - 1 am > 1 pm Volume5.5 Standard Graphing Templates
5.4.2 List of Days - 4 Consecutive Static Volumes
5.4.3 List of Days - 8+ Consecutive Zeros
5.4.4 List of Days - Missing Data
5.4.5 Statistics for Class 9 Weights
5.4.6 Volume Comparisons 4- & 7- cards
5.4.7 Graphs Excluding Purged Records5.5.1 4-card checks5.6 Plotting Data Trends
5.5.2 GVW graph - Class 9
5.5.3 7-Card vs. 4-Card Volume
5.5.4 7-Card vs. 4-Card Class Distribution
A.1 Installation InstructionsB. DAT File Requirements for Operation LTPP QC
D.1 Keywords - GeneralE. NEWSHT.DAT File Format
D.2 Keywords - Classification Data Transmittal Sheets
D.3 Keywords - Weight Data Transmittal Sheets
D.4 Keywords - Volume Data Transmittal Sheets
D.5 Key Word Deficiencies
E.1 Example - NEWSHEET to list incoming filesF. Input and Output File Conventions
E.2 Example - NEWSHEET Changing DEFSHT values
F.1 File Naming - Raw Data FilesG. ORACLE Tables
F.2 File Naming - Processed Data Files
F.3 File Naming - Extensions for Data Files
F.4 Sort Order for Input Data
F.5 Format Classification Records (4-card)
F.6 Format - Classification Records (C-card)
F.7 Format - Weight Records (7-card face)
F.8 Format - Weight Records (7-card continuation)
F.9 Format - Station Description Record (2-Card)
F.10 Format - Weight Records (W-card)
F.11 Format - Station Description Record (S-Card)
F.12 Codes used in TMG card submissions
F.13 Format - Weight Records (HELP-card)
F.14 Format - ATR Station Record (1-Card)
F.15 Format - Volume data records (3-card)
G.1 G.FILETRACKERH. Processing Resubmitted Raw Data
G.2 LTPPD4 tables
G.3 LTPPVOL7 tables
G.4 LTPPGVW tables
G.5 LTPPRC tables
G.6 LTPPRW tables
G.7 LTPPERRORCOUNT
G.8 Codes for ERROR in ORACLE tables
G.9 Statistics Possible Using ORACLE Tables
H.1 Data processed only by the NT softwareI. Data Evaluation and Error Identification
H.2 Going from all lanes to LTPP lane only
H.3 Data not previously processed by the NT software
I.1 Card 4 Range Check ParametersJ. Log Files
I.2 Card 7 Range Check Parameters
I.3 Continuation card 7 range check parameters
I.4 QC Edit Flag Codes
I.5 File Fatal Flaws
J.1 Log File Names and LocationK. LTPP QC Program Error Descriptions
J.2 Log File Contents
L.1 Support volume filesM. Transmittal Sheets
L.2 Support HELP files
L.3 SHRP.DAT as an ORACLE table
L.4 DEFSHT.DAT in ORACLE
L.5 Elimination of NEWSHT.DAT
L.6 Transmittal sheets (*.inx file) in ORACLE
L.7 Processed raw data files in ORACLE
L.8 Log file for processing
L.9 Consolidate GVW tables to one per site
L.10 Consolidate VOL7 files to one per site
L.11 Consolidate error tables
L.12 Create a duplicate checking process
L.13 Pre-processor
L.14 Support Site ID cards
L.15 Alpha characters in SHRP_ID
L.16 Loading robustness
L.17 Purge Conditions
M.1 Sheet 12
M.2 Sheet 13
M.3 Sheet 11
Table 1-1 Software modifications since version 1.5
Version 1.51 - Limited number of continuation cards to 1 and set software to load sets of 2 or more but flag as a critical error. Incoming record storage modified to accommodate the change. Tightened validation on continuation card values and sequencing. Year, month, day and hour checked on all records not just the first in a file. Check added for constant or increasing date and hour. Printing routine modified to insure data always prints. Edit flags changed to record rather than vehicle basis.
Version 1.52 - Graphs per printed page increased from 2 to 4 and titles shortened to accommodate the change. Changed WIM line type on graphs to be able to more easily differentiate it on printouts. Insured storage of comments longer than 255 characters in LTPPFILETRACKER.
Version 1.53 - Created QC cover sheet version 1.0 to summarize data in terms of quantity and errors by site, lane and direction. Modified AVC and WIM types to correct a printing problem. Sorted graph output so that graphs, when printed, appear in chronological order for classification errors. Included ability to restrict graphs printed for this error type to a single year. Corrected mixed case problems in path names.
Version 1.6 - Modified QC cover sheet to remove site statistics and do all reporting on a by lane and direction basis.
Version 1.61 - Modified Daymaker to account for missing hours or days which might otherwise create a continuously increasing sequence for the purposes of error graphing. Corrected AVC and WIM labeling errors. Corrected process for counting classification errors. Corrected loading process to account for orphaned continuation cards. Corrected loading to handle errors in counting 8+ consecutive zero hours
Document Modifications
1. Converted to Word and removed line numbering. Changed line spacing to 1.2 and placed page numbers in header rather than footer.
2. Added change lists for software and document.
3. Modified the document to reflect the software changes in user notes sections as applicable.
4. Added process flow charts to section 2.
5. Modified section 3.5 and replaced figure 3.14 to reflect capability to select 4-card error graphs by year.
6. Replaced section 3.8 to reflect new QC cover sheet report including replacement of figure 3.27.
7. Added a new subsection to section G to describe a new table, LTPPERRORCOUNT. Labeled the subsection G.7 and renumbered previous sections G.7 and G.8.
8. Replaced section H.3 since analysis software as designed is indifferent to the QC software used to initially review the file.
9. Removed Section N on Data Management. The material is now part of the LTPP directive on traffic data processing.
10. Added purge codes to Table I.2.
11. Added ORACLE codes for purges to section G.8.
The Long Term Pavement Performance traffic quality control (QC) software is designed to load, process, and produce reports on monitored traffic data submitted to the LTPP program. It is divided functionally based on the flow of data through the system to ultimately produce a data review report and data for loading into the analysis software. Eight program functions (buttons) are available from the main control panel for use by the program operator as data are loaded, processed, and analyzed for reports. The software uses an ORACLE database to store summaries of data and writes processed data to text files for use in the LTPP traffic analysis software.
The program has 4 basic types of files: input files, reference files, summary files and output files.
The input files consist of volume, classification, and weight files. The file formats are those of the Traffic Monitoring Guide (TMG) 2nd and 3rd editions. The latter uses S.I. units for weight data. Volume files are not supported by the program nor are HELP files. Reference files contain site specific and file details. Input files and reference files must be correctly prepared as discussed later in this document (sections B, C, D, E, and F).
ORACLE tables include a file tracker, error summaries for classification and weight data, daily volume tables for classification and weight data, and monthly summaries of gross vehicle weight (GVW). These tables, particularly the file tracker, are essential for program functions. The routine backup of these tables is suggested. A daily backup is strongly recommended and weekly backup is essential for good practice. The tables themselves are discussed in detail in section G.
Summary files are created within the QC software. The summary files serve as the basis for creating the various ORACLE tables. They are not modified by the purge process.
The output files are the processed files which have completed QC. They are the direct inputs into the analysis software (formerly referred to as Level 3-2-1 processing). There is a one to one correspondence between input and output files.
The QC software is designed with an expected program sequence procedure in mind. This design is reflected in the position of the main options on the control panel. In the first position is the ADB Connect" button, which allows the user to make a connection to the database. A database connection is a fundamental requirement of all operations within the software. The following steps are a general guideline for operating the software. A series of flow charts illustrating the process are found at the end of this section. Processing requirements for the LTPP program are addressed by directives issued to FHWA LTPP contractors.
Refer to section 3.1 or section B on DAT files information regarding this feature.
Select the files to be loaded and load them. Check the log file after the load is completed according to the on screen message to verify that all files did in fact load. Correct and try to load again any file that did not load the first time.
For each file that had transmittal sheet comments, enter them in the View/Edit files comments box and apply to entry to save the information. Review the Plett-plots for the sites. For files that are thought to be missing check the log files and look for a state XX unusual values for subdirectories.
Check the counts in both the card statistics and data view portions.
Use the relevant templates to review and print the necessary graphs. (The templates will need to be created the first time the software is used by each user.)
Chapter 5 discusses conditions where purges may be appropriate. Save the recommended purge lists WITHOUT applying them. Print a copy for inclusion in the QC packet if needed.
At this point the QC report block needs to be checked in the File Tracker.
The date the report was generated should be included in comments for the File Tracker for at least one of the files of each type for each site included in the report. The date the report is being sent should also be entered.
Open up the File Tracker and check report received for at least one file of each type at each referenced site. The date the report was returned should be entered in the View/File Edit Comments section. Retrieve the saved PRF files, modify them to reflect the accepted purges. Apply the purges and save the modified purge file for reference.
Unfamiliar users should read the following sections before running the software:
3.1 PREFSInstallation instructions accompany the software and are found in section A.
3.2.2 Data Source Selection
3.4.1 Plett-Plot
3.5 Graph Manager
3.6 PRF Editor
3.8 QC Report
B. DAT File Requirements
E NEWSHT.DAT
F.1 File Naming Raw Data Files
F.3 File Naming Extensions for Data Files
J.2 Log File Contents
Table 2-1 Initial File Preparation
First, Log in and acknowledge receipt and prepare files for loading.
Question 1: Does Input directory exist?
If NO, create input directory and then place files in input directory.
If YES, place files in input directory.
Next, create NEWSHT.dat (sec E)
Question 2: Does Output Directory exist? (sec 3.3.1)
If NO, create output directory and create dat subdirectory in output directory. Then go to Question 3.
If YES, go to Question 3.
Question 3: Are all .dat files current? (sec B)
If YES, start software.
If, NO go to Question 4.
Question 4: Is the SHRP.dat file current?
If NO, update for new year and data (sec C). Then go to Question 5.
If Yes, go to Question 5.
Question 5: Is the DEFSHT.dat file current?
If NO, update for changed site conditions (sec D). Then go to Question 6.
If YES, go to Question 6.
Question 6: Is the FUNCLASS.dat file current?
If NO, update for new class (sec B). Then start the software.
If YES, start the software.
Table 2-2 Starting Data Processing
First, check PREFS (sec 3.1).
Question 1: Is the output directory correct?
If NO, revise PREFS. Then connect to the database (sec 3.2)
If YES, connect to the database (sec 3.2)
Question 2: Is the ORACLE option available?
If NO, set up the ORACLE ODBC. Then, select Data processing option.
If YES, select Data processing option.
Data Processing Options: 3.3 Load Data, 3.4 File Tracker, 3.5 Graph, 3.6 PRF Editor, 3.7 Card Statistics, 3.8 QC Report.
Table 2-3 Loading Data Files
First select input file(s) and open option.
Then acknowledge loading complete message box.
Next, review log file (sec J).
Question 1: Did all files load?
If NO, determine reason and modify file names or edit data as appropriate. Then continue processing with File Tracker.
If YES, continue processing with File Tracker.
Table 2-4 File Tracker Options
First, select site.
Question 1: Did one or more files successfully load for year of interest?
If NO, go to Question 2.
If Yes, create Plett plot after selecting year of interest (sec 3.4.1). Then add file comments from transmittal sheets. Then go to the next site or process.
Question 2: Have all possible file corrections been made?
If NO, load Data process.
If YES, comment all failed files with reason.
Table 2-5 Purge File Editor
Select site and data type.
Question 1: Are there suggested or approved purges?
If Approved, recall purge file. Apply ONLY approved purges. Then save updated purge file and go to the next data type, site or process.
If Suggested purges, enter the list of suspect days in each month. Enter supplementary comments on purge reasons for agency reference if needed. Then save purge file and go to the next data type, site or process.
Table 2-6 Suggested Selections for Graphing Options
Question 1: Are templates present?
If NO, create templates (sec. 5.5 plus user specific). Then select site or file.
If YES, select site or file.
Next, determine appropriate time scale for graphing:
Option 1: If all continuous, then use quartely graphs.
Option 2: If samples and continuous, then use Volumes - monthly and Distributions quartely.
Option 3: If all samples, then use monthly graphs.
Next, data types available:
Option 1: If ACV only, plot daily errors and vehicle distributions.
Option 2: If WIM only, plot vehicle and weight distributions.
Option 3: If AVC and WIM, plot all vehicle and weight graphs.
Next, print review packet either internal or external and then go to the next file, site or process.
Table 2-7 Card Statistics - Record Level Errors
First select site and file.
Option 1: AVC Data (sec 3.7.1).
If YES, go to Note 1.
If NO, go to Option 2.
Note 1:
Number of records
Number of record level errors
Number of days of data
Check before graphing.
If NO, determine principle reasons for the failure. Then go to Option 2.
If YES, go to Question 1.
Question 1: Is a useable file expected? If not, why not?
If NO, determine principle reasons for the failure. Then go to Option 2.
If YES, go to Option 2.
Option 2: WIM Data (section 3.7.2)
If YES, go to Note 2.
If NO, go to next file, site or process.
Note: 2
Number of records.
Number of record level errors.
Question 2: Is error rate and type acceptable?
If NO, are errors correctable by agency? Then go to next file, site or process
If YES, go to next file, site or process.
Table 2-8 Options for QC reports
Step 1: Select report.
Option 1 - QC cover sheet.
Option 2 - Daily Summary. Then select file (opt.).
Option 3 - Error Summary. Then select file.
Step 2: Select site, year.
Step 3: Print.
Step 4: Go to next file, site or process.
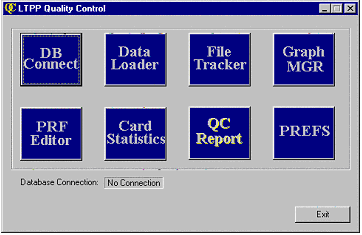
Figure 3-1 Control Panel
The control panel, or main menu, shown in Figure 3-1 contains eight functional buttons, a database connection indicator, and an exit button for exiting the program. The version number can be found under About after clicking on the QC in the upper left-hand corner.
The user preferences menu provides the ability to customize the behavior of the program. Currently, only one option is available: base data location. This location is very important to the behavior of the program and must be set to a location the output files and reference files are to be or have been stored. Many directories and files are generated by the QC software during the data loading process, and most of these are used in the analysis software. Except for tables generated in ORACLE, files and directories are created in a consistent structure under the Base Data Location. Set this directory to a location with ample space to store data and that is designated for the archival and processing of LTPP data.
All directory and subdirectory names in the path must be 8 characters or less.
Figure 3-2 shows the PREFS dialog box.
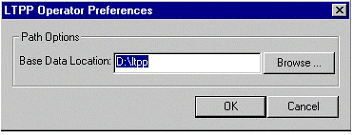
Figure 3-2 Sample operator preferences dialog box.
Selecting BROWSE brings up the currently accessible directories for user selection in lieu of typing in the directory name as shown in Figure 3-3 Results of Browse Selection. Open and close perform that function for the selected directory. OK selects the directory name to be used for PREFS. Multiple data locations for PREFS may be used within a processing session. It should be noted however that using anything other than the drive name and regional abbreviation for the path will result in work to relocate files for use by the analysis software.
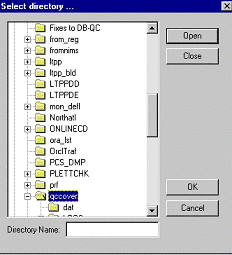
Figure 3-3 Results of Browse Selection.
A database connection to ORACLE is required for most of the functionality within the software. This is due to the fact that data are loaded from files into the ORACLE database and stored there for graphing and file tracking. Tracking information is also stored within a table in the ORACLE database, LTPPFILETRACKER (see section G.1 for a discussion of this table).
To make a connection to the database, select the "DB Connect" button on the main control panel. This will invoke a "Select Data Source" window, which expects the user to select the method through the database will be accessed.
There may or may not be any data sources listed in the selection window. If an ORACLE ODBC option is not available in the white selection window, continue with section 3.2.1, Setting up a Data Source. If there is a choice available like the example in Figure 3-4 for connecting to ORACLE, skip to section 3.2.2, Data Source Selection. The software will not recognize anything but an ORACLE ODBC connection.
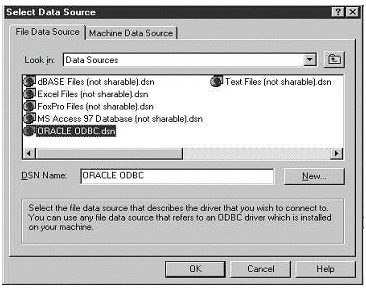
Figure 3-4 Data Selection Screen
3.2.1 Setting up a Data Source
To make a database connection to any database available, the user must identify a method for the software to make this connection. On the "Select Data Source" menu, click the "New…" button, which invokes a "Create New Data Source" window.
This window provides a list of data base drivers that may be used to connect to a database. Figure 3-5 shows an example. In the list select Microsoft ODBC for ORACLE. The software will only recognize this ODBC option. If this option is not available, contact the system administrator to have the driver installed on the computer. After selecting this driver from the list, click "Next>" at the bottom of the menu. An input window, should now be available that asks where to save this driver configuration.
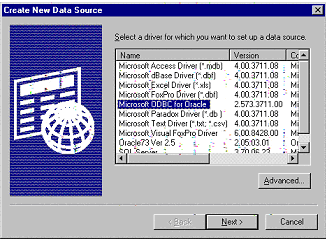
Figure 3-5 Driver selection when setting up new database
Type "ORACLE ODBC" in the window like the example in Figure 3-6, and click the "Next>" button. A final window (Figure 3-7) provides some information about the driver.
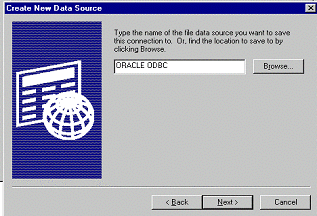
Figure 3-6 Creating a new data source
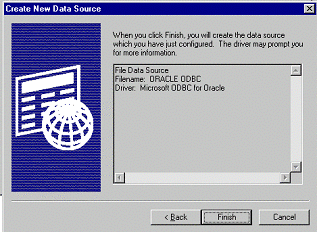
Figure 3-7 Configuration of data source selection
On this window, click the "Finish" button. At this point, a log in dialog box for the database appears as illustrated in Error! Reference source not found. For ORACLE, there are three inputs: User Name, Password, and Server. Type the required information into the spaces for the relevant ORACLE database. The established Traffic User Account should be used to connect to the database. If the account has not been established or the required user name/password is not known, contact the local database administrator (DBA). After entering all of the information, click the "OK" button. "ORACLE ODBC" selection should now appear on the "Select Data Source" menu.
In the "Select Data Source" window, select the data source which allows a connection ORACLE database. A dialog box like Figure 3-8 will appear to enter a user name, password, and server. Enter the required information to connect as the established Traffic User. (See the DBA if necessary.)
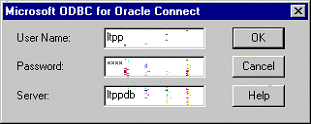
Figure 3-8 ORACLE log in screen
Assuming all information is correct, and the database is available, the connection will be established and the Database Connection message box updated to 'Connected' on the control panel of the LTPP QC software. The software may or may not recall the items User Name and Server from session to session.
To disconnect from the database, or re-establish the connection, click again on the "DB Connect" button. If currently connected, the program will request confirmation to disconnect. Selecting "No" will leave the database connected. On selecting "Yes", the program will terminate the database connection. If the software is not closed, clicking on "DB Connect" will bring up the query "Do you want to make a new connection?" To make a new connection or reconnect, select "Yes". It is not necessary to disconnect from the database before exiting the program.
The first time the software is used, a message box will come up with a Yes/No query - "Your file tracking table does not exist. Create one?" Click on "Yes". (Clicking on "No' disconnects the database.) If this message ever appears again, it indicates that the ORACLE file tracking table has been renamed or dropped from the database. If this was unintentional, restore the table from the most recent backup.
The data loader permits loading of 4-, 7-, C-, and W- card files as well as 7-card files with as many as eight 2-card header records into the program (See section F for a discussion of the card types). 3-card files will not load. HELP data files (a prefix of H) will not load. While data are loaded, they are checked for errors at the file, record and daily (if applicable) levels. They are consolidated into daily summary records for reporting purposes, statistics and errors are stored in the ORACLE database, and a corresponding text data file is written for use with the traffic analysis software. Days of data are counted and summarized by calendar days. This does not depend on whether collection equipment is permanent or portable. This is the way the original LTPP traffic QC software counted days.
To load a data file, select the Data Loader button on the main control panel. The window that appears is used to select the files to load from any input source available as shown in Figure 3-9.
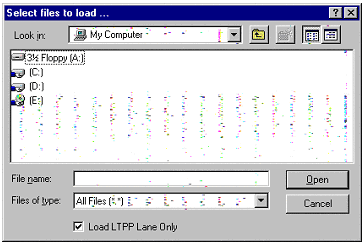
Figure 3-9 Sample screen for selecting files to load
It is possible to switch between drives during a loading session as well as switch floppy disks or CD-ROMs as needed.
Double-click on the file to be loaded. To select multiple files, press the CTRL key and single-click on each file to be loaded. Alternately, press the SHIFT key, and click on the first and last file for a group of files to be loaded. All files in between will be selected. Depending on the length of the path for the input files, up to 70 files can be loaded at a single time. If more than 70 are selected, NONE are loaded and no record of the loading attempt will appear in the log. When satisfied with the selection, click the Open button on the menu. The data is not loaded by the program in alphabetical order by filename. The loading success or failure of each file is written to the log file. For failures, a reason is identified as well. (See section A.)
The option to load only the LTPP lane is provided, which results in the program loading only data from the LTPP lane and direction as defined in the SHRP.DAT (See Section C for a discussion of this file.) file. The option selected is retained from load selection to load selection. This selection is also used in other portions of the program. Turning it on in one section will affect the others (Graph Manager, PRF Editor and Card Statistics.) To see other lanes later, the file will need to be reloaded in its entirety. Reloading the IDENTICAL file to obtain the information on all lanes will not require the processing described in section H. However, going from all lanes to LTPP lane only in all the output files needs to be addressed per section H.1.
A "Loading LTPP Card File" message box (Figure 3-10) appears to indicate the processing status of the file. To cancel the loading process at any time, click the "Cancel" button. Canceling the loading process stops processing of the current file for the current step only. The cancel feature does not erase any subdirectory structures or temporary files that have been created for the file being read at the time of cancellation. It can damage summary.dat (See section 3.3.2 for a discussion of this file type.) files leaving a summary.tmp file instead and may remove any output file with the same extension as the input file. Canceling the loading process is not encouraged or recommended. If loading must be cancelled, treat the file as if the raw data is being reloaded per section H.1.

Figure 3-10 Reporting loading progress
At this point in the loading procedure, the data file is being checked at the record level for data errors. Incoming data is separated into monthly files for more efficient summarization in the QC software. For each file loaded, a record-by-record table is created within the database to store records containing errors. The errors can be viewed with the Data Viewer. (See section 4 for a detailed explanation of the function.)
Once the file is loaded and saved, the daily processor loads summary files for months of input data that have been updated. Only months containing altered data are loaded so as to reduce redundant processing and increase program efficiency. During this process, multiple status bars will appear to show the processing status of each monthly file that contains new data. Upon completion of processing for all files selected to load, the status bars will disappear and either the next file will be processed or a "Load Completed" message box will appear. The process may take a considerable amount of time when loading weight data since the summary.dat files are not indexed.
It is CRITICAL to note that when data is resubmitted for a site, old data must be removed prior to processing. This includes information in both the summary files and ORACLE tables. If this is not done there will be problems with creating ORACLE tables, their contents, and the QC graphs. See section H on processing resubmitted data for details.
3.3.1 Post-Processing File Location
ORACLE tables are stored in the Traffic User account, as established by the ORACLE DBA. The remaining files are stored in the directory which was identified when selecting PREFS. The traffic data and working files are discussed here. Purge recommendation files are discussed in section 3.6, PRF Editor. ORACLE tables are discussed in section G. Log files are discussed in section J.
A working file called workindx.$$$ is used as a scratch file for data processing. It is located in the directory identified in user preferences. If processing terminates normally the file will be empty or non-existent.
Scratch files for converting C-card and W-card files are written to the root directory of the drive identified in PREFS. If processing terminates normally, there will be no trace of these files. Otherwise files with a S prefix will be found.
The new software creates a somewhat different directory structure than the old software. There are more levels and differentiation between the traffic file types. As a result, the base directory should be the root directory on the drive with the region name. (See section 3.1, PREFS.)
The first level of the directory structure is region. The second level is state as identified by its 2 character alpha abbreviation. The third level is the 6 character STATE_CODE, SHRP_ID combination. The fourth level is LEV4 or LEV5 (LEV1, LEV2, and LEV3 are created as a function of the analysis software). The subdirectory structure below LEV4 has a subdirectory DATA which is split into a subdirectory for each YEAR. A YEAR subdirectory is split into a subdirectory for AVC (AVC4) and a subdirectory for WIM (WIM7). When volume data can be loaded, an ATR3 subdirectory is created. The processed data files are stored in the data type directories. Additionally, the type subdirectories are split in up to thirteen additional subdirectories, one for each month of the year and (Non) one for any data with an invalid month value. A sample of a partial, post QC subdirectory structure appears in Figure 3-11.
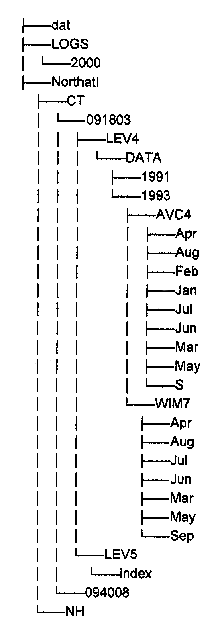
Figure 3-11 Sample output directory structure
The first and last character of the file extension, not file content, is used in determining the year for a given site. The month and year of the file extension must match the month and year of the first record in the data file in order for the file to be loaded.
Each data type has two groups of summary data: ORACLE tables and summary. The ORACLE tables are discussed in section G. The input files for the ORACLE tables are created one per month for any month with data. There is a set for classification (under AVC4) and one for weight (under WIM7). They are all called summary.dat. They are text files which group all of the data for a month together in chronological order. Each record indicates the file which supplied the data. The exception is continuation cards (for weight data) which are not labeled in this fashion. These files include most QC flags. Daily level classification errors are omitted. The records do not include purges. Graphs for counts after purging must be done with other tools (spreadsheets or the LTPP traffic analysis software). See Section 5.4.7 for a description of a possible process. The flags on the records in summary.dat files determine what information is added to the ORACLE tables. Data with critical errors is excluded from the total counts of vehicles and weights. Data associated with critical errors is identified in section I.
Output data files are renamed using the existing file naming conventions for such processed files. (See section F.) They are stored in the AVC4 or WIM7 subdirectories by data type for the site and year under evaluation. They include the error information and are the only files to which the purge flags are applied. They are used as input to the LTPP traffic analysis program. Output files, like input files, are in ASCII fixed column format. All output files are either 4-card or 7-card records.
The QC software will automatically create the transmittal sheets (Note: Trasmittal sheets are used to catalog what data has been submitted on a file by file basis. The origials are paper forms completed by the states and sent with the data submission. There is a differnrt format for each type of data. The information on the sheets includes beginning and ending dates and times, classification scheme, equipment type, and any comments on the data collected. This information is used in creating or modifying the DEFSHT.DAT and NEWSHT.DAT files. See sections D and E for more information on these files.) that are required for each QC'd file. Transmittal sheets are written to the Index subdirectory of the LEV5 subdirectory. There is only one such file for the site for all years. The name for this file is xxxxxx5.inx where xxxxxx is the STATE_CODE, SHRP_ID for the site. This is a binary file with visible ASCII characters. This file is an artifact of the original LTPP traffic QC software and is not used in the ORACLE based traffic analysis software. Comments that would have appeared in the electronic version of the transmittal sheets are not entered in the 'View/Edit File Comments' box in the File Tracker module (section 3.4).
Writing correct transmittal sheets requires that two files be present in the DAT subdirectory: DEFSHT.DAT and NEWSHT.DAT (See sections D and E respectively for a discussion of these files.). If the state code, SHRP ID combination is missing from DEFSHT.DAT, the information will default to blanks. If the input file is missing from NEWSHT.DAT, the QC processing will occur but a note will appear the log file.
3.3.5 Processing Outcomes for Bad Data Files
The processing of various types of data errors is discussed in section J.2, Log File Contents. If a file fails to load, the error message in the log should be sufficient to indicate what actions are required to correct the problem. Section J has more details on the log file and its messages.
To maximize the number of files which can be loaded, path names store used to input data should be kept as short as possible.
The LTPP File Tracker is a partially automated feature within the QC software. It is the user's responsibility to maintain some information contained within the file tracker. The purpose of this tracker is to maintain information about the status of data from loading through applying purge recommendations. The file tracker provides the ability to monitor the processing status of files loaded into the software by state and site and contains the capability to graph data received from a given site (Plett-Plot).
Select the "File Tracker" option on the control panel to invoke the LTPP File Tracker. A window appears with a variety of information as shown in Figure 3-12. PREFS may be set to any location without affecting the operation of this module.
Much of the information pertains to the currently selected file, and some of the information can be changed. For this reason the file tracker is considered "partially automated."
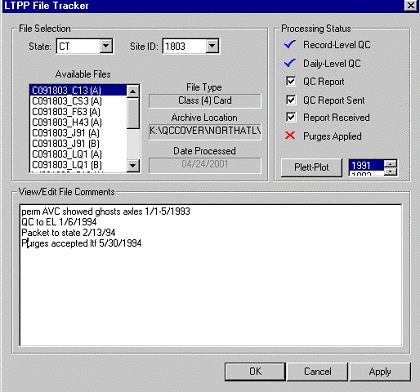
Figure 3-12 File Tracker screen
Two selection lists, state and site, are provided to specify the site for which loaded files should be displayed. File loading failures result in a state XX with a SHRP ID of 0000. Loaded files will be displayed in the "Available Files" selection list - an empty list indicates no files were loaded or a selection has not previously been made to view files. The file lists contains information about the file name and the versions loaded. The file name is displayed first with the period replaced by an underscore and the version of the file is in parenthesis. The first time a specific file is loaded, version A will be assigned. If a file with the same name is loaded at a later time, the next version (B) will be assigned and so on.
The file type (data and format), archive location (to locate processed data), and date processed are displayed next to the file list for each file selected. On the right side of the menu are the processing steps that have been completed for the selected file. Steps marked with a red X are not yet completed, while steps with a blue check mark are completed. Steps with an empty check box next to them are provided for the user to check off when the step is completed.
Figure 3-12 illustrates the results of a file which has completed the QC process.
A white, text input box, labeled "View/Edit File Comments" is provided. The user can enter comments regarding the selected version of the data file. Up to 2000 characters of information can be included containing any notes the user considers relevant. This is where any comments from the transmittal sheets should be stored electronically. This information is not carried forward to the QC report. It is stored in the LTPPFILETRACKER (See section G.1 for a discussion of this table.) table in the COMMENTS field. To print it out an extraction must be made from that table. Standard copy and paste commands (Ctrl+C and Ctrl+V respectively) work if comments need to be repeated for multiple files or imported from other files. To electronically store notes on a site the user may also use the commenting capability in the purge file. (See section 3.6.1, Purge File Structure).
Note: Any changes made on this menu must be "Applied" before changing the selected data file or exiting the menu. Failure to apply the changes results in the loss of changes. The Apply button greys out after changes are applied. Any revision to the comments reactivates the Apply button.
The ability to plot a graph of data received from a given state/site is provided by the file tracker for years in which data have been received and processed to date by the software. Displayed on the right side of the file tracker menu below the processing steps list is the Plett-Plot button. Beside the button is a selection list of years for data already processed for this state and site.
To produce a Plett-Plot:
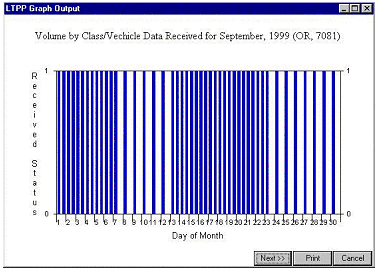
Figure 3-13 Sample Plett-plot
WARNING: The option to delete files exists through this module. Selecting a file from the Available Files list and pressing the delete key on the keyboard will delete knowledge of that file from the ORACLE database. It will not, however, affect either the summary files used for graphing or the output files used for analysis even if the last version loaded is selected. Deleting files here can produce erratic results in further processing activities. The user is solely responsible for dealing with any consequences of deleting files here. Reloading files from scratch is generally the only corrective action.
The graph manager produces graphics of data containing errors, gross vehicle weight (GVW) plots, and comparisons of volume and weight data over a given time period within a year. The graph manager includes a template manager to set up predefined graph sets. The template can then be run for the selected state, site, and year to produce the series of graphs saved within that template. (See section 5.5 for a set of recommended templates.)
Graphs can be printed from the Graph Manager.
The purge file editor can be accessed from the Graph Manager without having to exit it and enter the PRF module.
The Graph Manager selection screen is divided in to three main sections, beginning with the site selection criteria, followed by the graphics options and the template manager as shown in Figure 3-14.
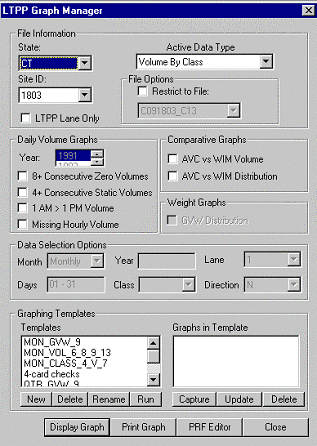
Figure 3-14 Graph Manager Screen
If more than one output location has been defined for a site for a year, the graphs will be wrong since the ORACLE tables will be incomplete. It is the user's responsibility to ensure that all data files processed for a site for a year are output to the same place as defined by PREFS and the standard subdirectory structure. Failure to do so will prevent the QC software from producing accurate results.
The entry in PREFS affects the functioning of this element of the software. The graphing requires access to the SHRP.DAT file since LTPP Lane Only is an option. If multiple PREFS have been adopted for processing (i.e. separate state subdirectories) and the current selection does not contain a SHRP.DAT entry for the currently selected state and site, the error message "Unable to find SHRP entry for the state and site." will appear. Either change the site or change the PREFS entry before continuing.
The file information section in the Graph Manager consists of a state and site to identify the data sets to be used, a data type, and a file restriction option. Selecting the active data type determines the graphing options available. For example, the weight graphs are not available when the Volume By Class data option is selected. Daily volume graphs cannot be produced without classification data being loaded.
It is possible to restrict graphs to a specific file or to the LTPP lane data. The former can be useful for plotting only errors or statistics from that file and not all files loaded for the site. By selecting the "LTPP Lane Only" option, the direction and lane should automatically be filled in under "Data Selection Options" when a new site is chosen.
Graphing is not restricted to the data for the LTPP lane if multiple lanes of data have been loaded for a site.
A variety of graphs are available through the graph manager to plot errors and comparison values. For Volume by Class data, four graphs are available. They are based on LTPPRC tables. To limit the number of graphs produced by the software the year of interest is one of the selection options for "Daily Volume Graphs". These graphs do not exist for volumes derived from weight data.
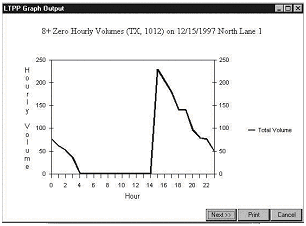
Figure 3-15 Sample 8+ consecutive zero volumes graph
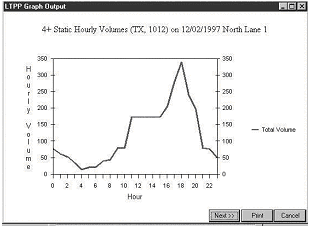
Figure 3-16 Sample 4+ consecutive static volumes graph
These four types of plots are created only from 4-/C-cards. They can be obtained if any classification data exists even if 'Weight by Vehicle' is selected as the active file type.
The following graphs are available to display AVC versus WIM data and require information be set in the "Data Selection Options" of the Graph Manager (see section 3.5.3.)
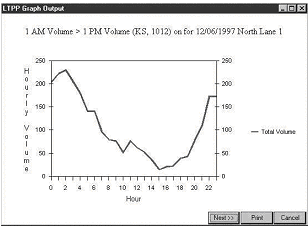
Figure 3-17 Sample 1 a.m.>1p.m. volume graph
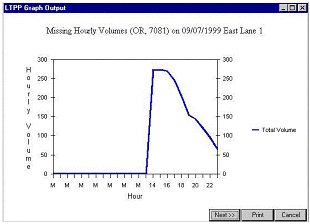
Figure 3-18 Sample Missing Hourly Volumes graph
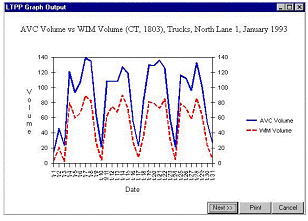
Figure 3-19 Sample AVC vs. WIM volume graph
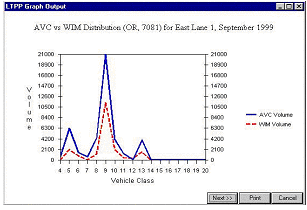
Figure 3-20 Sample AVC vs. WIM vehicle distribution graph
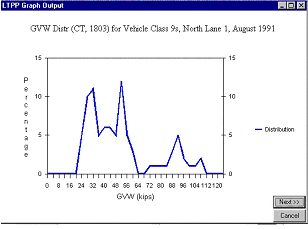
Figure 3-21 Sample GVW graph for a vehicle class
3.5.3 Data Selection Options for Vehicle Based Graphs
Various data selection criteria in the graph manager are required for the comparative and GVW graphs. Date ranged, class, lane, and direction information must be specified to produce the comparison desired graphs. While the comparative graphs require that a day range be specified, the GVW graph does not, (it is either a monthly or quarterly graph). The following criteria are available:
After the graphing options are selected (one or many may be selected, but changes can be made to produce graphs with other options), click the "Display Graph" button at the bottom of the menu. If any data meet the selection criteria specified, a "LTPP Graph Output" menu will appear with the desired graph. If no data exist which meet the graphing criteria, a message - "No data available which match your criteria or graph selection" will appear. Selection of the "Print Graph" button will generate a copy to a printer.
If multiple graphs are generated by the criteria selected, click the "Next >>" button, to display the next graph for the criteria used. Once all graphs have been viewed, clicking "Next >>" brings back the graphing options menu. The "Cancel" button may be selected at any time to terminate the viewing process. It is not possible to go backwards through a series of graphs.
The graphing template manager allows for the setup a set of templates, each containing a set of graphs that can be saved and run at any time with the specified state, site, and year. This is useful to consistently produce the same set of graphs for different sites. Daily graphs (4-card errors) cannot be in the same template as monthly/quarterly graphs which may use WIM data.
Two windows are displayed in the template manager, the left displaying saved templates, and the right displaying graphs saved within the selected template. Begin by creating a new template with the "New" option under the "Templates" window. A new template is created with a default name, which can be changed with the "Rename" option.
To save a new graph to the new template, setup the graphing options on the graph manager menu, including desired data type, graphs to produce, and data selection options. Once set, select the "Capture" button under the "Graphs in Template" window of the template manager. A new graph will appear, numbered consecutively, in the graphs window. A user may store up to 30 templates, each with 10 graphs.
To run a template at any time, select the state and site for the data to be graphed, and specify the year of the data to graph. Select the template containing the graphs to be produced, and select the "Run" button under the "Templates" window. To view any of the saved graphs, select the graph in the "Graphs in Template" window, which will update the Graph Manager screen to reflect the settings of the saved graph.
Templates are user specific. The instructions for each are contained in a file - templates.dat. This file is saved in WINNT\Profiles\user name\LTPP. Procedures for setting up a minimum recommended set of templates are contained in section 5.5.
The option to print graphs is provided within the Graph Manager. Graphs must be printed individually whether defined and selected individually or produced using a template. Graphs are printed one or four per page. Printing directly from the screen display produces one graph per page. Printing using the Graph Manager "Print" button results in four graphs per page. All graphs on the page are the same type. If fewer than four of the type exist, a new page is started for the next graph type. Any available printer can be used or the graphs may be printed to a file. The latter course is not recommended since the files contain all of the printer control characteristics. For the most readable graphs, printers should be set in landscape mode prior to printing.
The Purge Recommendations File (PRF) Editor is used to enter purge recommendations into the software. These recommendations instruct the software to purge (exclude) data in the given data file from inclusion in the daily summaries and annual estimates. The data will still exist in the output file used by the analysis software. To accomplish this, the PRF Editor provides a graphical interface through which to exclude data within specific date ranges.
The editor is started with the "PRF Editor" button on the control panel. A "PRF Editor" screen is presented with variety of input windows to specify which data should be excluded for the given state and site as shown in Figure 3-22. The PREFS selection will affect the function of this element if the user intends to have the LTPP lane selected automatically for the lane and direction entries.
Select the state and site for which to purge data as well as the data type to be affected by the purge. Checking the "Use LTPP Lane Only" checkbox should result in the LTPP lane and direction being automatically be filled for the lane and direction boxes for rows with a date range to purge.
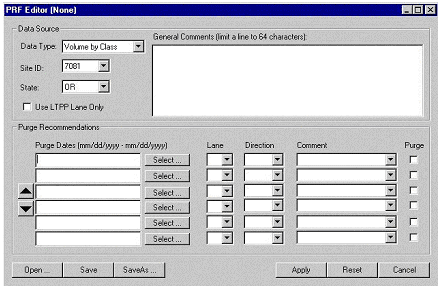
Figure 3-22 Screen for the purge file editor
To begin entering purge recommendations, start with the Purge Dates column of the menu. Dates can be entered by typing or point and click. When typing dates a range must be entered even if only one day is to be purged. To graphically enter a purge date range, click the "Select…" button next to the date input window. Each window requires using the accompanying "Select" button. A calendar appears that allows selection of the date range to be purged.
The calendar will start by displaying the current month and year. The month and year may be rapidly changed as follows. Click on the year to get a list of years that may be scrolled through to pick the desired year. Click on the month to get a pick list of months. The months may also be changed by using the arrows or clicking on the greyed out dates of the previous or following months. To select a range of dates, simply click the mouse on the starting date and move the mouse, holding down the button, across the range of dates within a month. Hit Enter to accept the date(s) selected. Up to 31 days can be selected at a given time. Entering a range of dates longer than a month will not be accepted by the software. Date ranges for purges do not have to match the range of dates associated with an individual file(s). To dismiss the calendar at any time, press the Esc key.
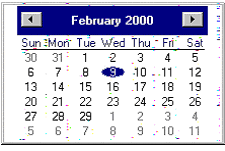
Figure 3-23 Calendar example for purge date picks
For the given date range, select the lane and direction (if the "Use LTPP Lane Only" option was not selected). Each lane and direction affected must be purge separately. It is recommended that each lane and direction be saved in a separate file.
A list of standard comments is presented to choose from or another reason may be manually entered for the purge recommendation.
The checkbox listed under the Purge column indicates whether the data should actually be purged (an X in the box), or whether this recommendation identifies a potential problem (an empty box). In the latter case, DO NOT check the Purge box with data matching the specified criteria. This is to prevent accidentally applying the purge which CANNOT be undone. Up to 53 purge recommendations may be entered by clicking the up or down arrows on the left hand side of the dialog box to scroll through the input windows. Multiple purge files may be created for a data type for a year.
To save the current recommendations to a file select the "Save" or "Save As" buttons at the bottom of the menu. The name of the *.prf file currently being used is shown in parentheses at the top of the dialog box. A file name and location must be entered. A .prf extension is automatically added to the file. A systematic file naming and storage convention is suggested. Year and data type may be sufficient as a file name if the file is located in the site-level subdirectory and only a single lane and direction is affected. If the file is located in the year level subdirectory, file type may be sufficient. At a later time, this file can be loaded with the "Open" button to recreate the exact purge recommendations that were entered for the specified data file. If the purge recommendations file is not saved, the purges applied will need to be determined by manual inspection of the analysis files or the ORACLE tables, LTPPD4 and LTPPVOL7.
To return the window to all blank entries select the "Reset" button at the bottom of the menu. Saving the .prf file at this point will erase all information previously stored in it.
Identify accepted purge recommendations by checking the associated purge box(es). To implement the purge recommendations select the "Apply" button at the bottom of the menu. The program will prompt for confirmation to apply the current purges. Once purges are applied, they CANNOT be removed. New purges can be added or existing purge reasons can be modified. Purges are applied to the data tables in ORACLE and the output data file used for processing in the analysis software. To be able to see that purges have been applied by viewing the purge file itself, the file must be saved when the purge boxes are selected (preferably immediately after applying the purges.)
A comments section is included in the PRF screen. Comments entered in this box are restricted to 64 characters per line. This is where any comments on the purge recommendations that should be seen by reviewers are saved. There is no limit on the number of lines allowed. The comments are saved in the purge file and will be printed out when the purge file is printed.
The purge file is an ASCII text file. While separate purge files must be generated for class and weight files, the structures are similar as shown by the two following examples. There may be up to 53 lines beginning PURGE in each file.
#
# LTPP Purge Recommendations File
# Generated on 03/24/2000 at 23:16
#
# PURGE entry format is:
StartDate-EndDate,Lane,Direction,Reason,Purge (1=Yes, 0=No)
#
STATE 9
SITE 1803
COMMENTS STATE CONCURRED WITH RECOMMENDATIONS 7/31/94
END*COMMENTS
DATATYPE Volume by Class
PURGE 01061991-01091991,1,1,"sample for manual", 0
....
#
# LTPP Purge Recommendations File
# Generated on 03/24/2000 at 23:16
#
# PURGE entry format is:
StartDate-EndDate,Lane,Direction,Reason,Purge (1=Yes, 0=No)
#
STATE 9
SITE 1803
DATATYPE Weight by Vehicle
COMMENTS The data is considered suspect because previous data
COMMENTS for January have volumes only 1/3 of those shown.
COMMENTS In addition, the average ESAL value has doubled
COMMENTS from the previous month.
COMMENTS
END*COMMENTS
PURGE 01061991-01091991,1,1,"sample for manual", 1
....
The only extension the program recognizes to retrieve purge files is .prf. The .prf extension on a system running Internet Explorer may be associated as a PICS Rules file. In this instance it will not be possible to open the file for review directly from Windows Explorer. The file will need to be opened and printed from a text editor or word processor instead.
3.6.2 Standard entries used in PURGE files
The following direction codes are used in PURGE files:
1 - North
2 - Northeast
3 - East
4 - Southeast
5 - South
6 - Southwest
7 - West
8 - Northwest
The contents of Reason tell the software what code follows Q at the end of a purged record. The following reasons are provided on a pick list for use in assigning a code to purged records. Other is not provided as an option. The user entering a reason will result in a code of ?. The software will not indicate if the purge being applied is inappropriate for the data type selected.
8+ Consecutive Zeros (r)
Time Check (s)
Missing Data (t)
Zero Data (u)
Improper Direction Designation (v)
Improper Lane Designation (w)
7 Card Greater Than 4 Card Daily Volume by Significant Difference (x)
4 + Consec Nonzeros (y)
Zero Daily Volume (+)
4 Card Greater than 7 Card Daily Volume by Significant Difference (z)
Over Calibrated (&)
Under Calibrated (#)
Large % of Vehicles > 80 KIPS (^)
Large % of Vehicles < 12 KIPS (~)
Lower Volumes Than Expected - Possible Sensor Problem (|)
Misclassification Error (>)
Atypical pattern (<)
user entered (?)
The software will not report an error if the lane or direction does not exist in the file.
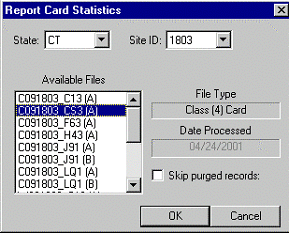
Figure 3-24 Screen for selecting card statistics
The Card Statistics menu produces a data statistics report on screen for a given file that has been loaded by the software. This report also includes the Data View option for viewing data records. The Card Statistics window as shown in Figure 3-24 includes an option to exclude purged records from the statistics report. These records are not excluded from the Data View report.
Select the state and site for the statistics reviews. A list of files and versions are displayed in the "Available Files" selection window. Select the file for the data statistics report. General information about the data type in the file and the date the file was processed is shown on the right side of the menu. To exclude purged records from the statistics report (to not see errors for purged records), check the "Skip purged records" checkbox. Different reports are generated for AVC and WIM data.
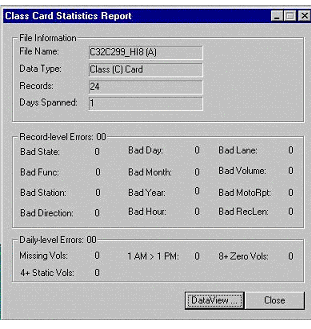
Figure 3-25 Screen for classification data statistics report
Selecting an AVC data file produces a screen like the one in Figure 3-25. The information is generated from the LTPPD4 and LTPPRC tables (See section G for information on these ORACLE tables.). The number of daily errors and the number of records with errors respectively are summed to produce the totals.
To view data in depth for the site to which this data file belongs, select the DataView option on the menu, which invokes the LTPP data viewer (See Section 4, Data Viewer).
3.7.2 Weight Card Statistics Report
For WIM data files the report provides information on record-level errors only since those are the only type the software recognizes for weight data. The report uses LTPPRW (See section G.4 for a discussion of this table type.) tables. In order to view errors on a screen similar to that in the relevant file must be selected. See Figure 3-26 for an example of this screen.
There are three options for QC report generation, a cover sheet, a record counting option and a file level error summary.
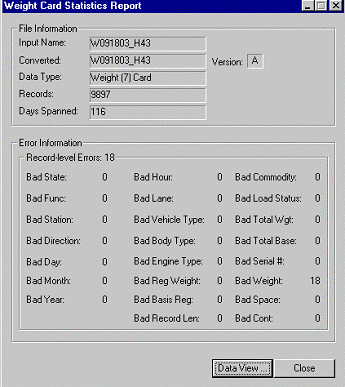
Figure 3-26 Screen for weight records statistics report
The QC cover sheet generation is the most frequently used as it summarizes the data and volumes provided. The report is generated at the site and year level on a by lane by direction basis. All data included in the ORACLE tables for that year is reported as no "LTPP Lane only" option exists. For each lane and direction the report indicates by month the number of days of classification data received and how many of them had no critical errors and are therefore suitable for use in annual estimates. Within the classification section the number of vehicles by class, the total trucks and the total vehicles by month are also reported. The same information is translated into percentages for the truck population only so that the percentage distribution of trucks by class and the percentage of trucks on a monthly basis can be viewed. The end of the classification section indicates the number of days by error type. The second section of the report covers weight data. For each month the number of days of data, the number of record received, the number passing QC and the error percentage are reported. Then the by month, by vehicle class statistics for the classification records are computed for the weight records. The end of the section indicates the percentage of Class 9 vehicles over 80 kips or under 20 kips in each month and tabulates the total number of errors by type observed in the weight records.
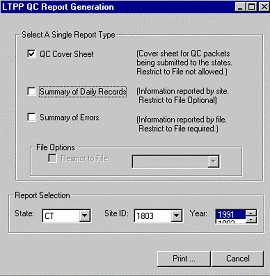
Figure 3-27 QC Report selection screen
The second option is a summary of the total number of records by data type by lane by direction received for the year at a site. Only one year and site are printed per page. Each year and site must be selected separately. This count may also be done at the file level.
The third option is a summary of errors found at the file level. Only one file is printed per page and each file must be selected separately.
Invoke the QC Report Menu with the "QC Report" button on the control panel. A screen like Figure 3-27 appears with a series of boxes to select report type and its site, year and file where applicable.
After selecting all the options necessary, click the "Print" button to invoke the printer selection menu. Any printers or printing to a file are options. No other options have any affect on the printing process. After selecting the printer, click "OK" to begin the printing process, or click "Cancel" to cancel the process. If graphs have been printed using the selected printer, the layout option, Landscape or Portrait, should be checked before printing.
Any comments and notes to be included in the report should have been entered in the purge file. The purge file must be printed separately as a text file for inclusion in a review packet. If comments to be included in the review are located in the LTPPFILETRACKER an SQL statement must be used to generate the relevant text file.
The Data Viewer allows review of records stored in the ORACLE database after a data file is loaded. It is available through the Card Statistics button on the control panel. It is helpful for looking at each record to determine what a possible cause for an error may be and what sorts of problems may exist with a given set of data.
To invoke the Data Viewer, use the Card Statistics button on the control panel. A data file report will be generated with a Data View button at the bottom. Select this button to invoke the Data Viewer.
Depending on the type of data being viewed, the viewer will contain information specific to that data type.
4.1 Viewing Classification Records
The Class Data Viewer shown in Figure 4-1 uses the LTPPD4 (See section G.2 for a description of this table type.) tables for the site. As can be seen from the figure there are three options for reports: By Day; By Day, errors only; and By hour, errors only. The option to restrict the report to the selected file, changes which reports can be viewed.
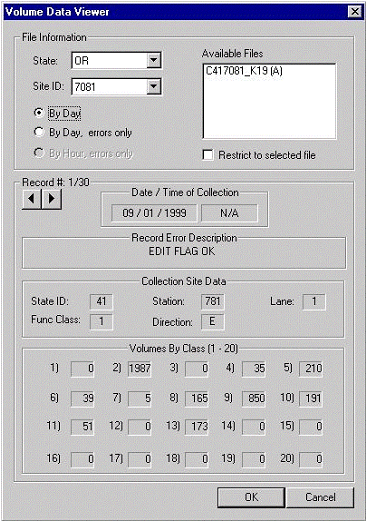
Figure 4-1 Sample classification data viewer
If the option selected is 'By Day', all days in the LTPPD4 table will be displayed in the order they were loaded into the software whether or not they have errors. The data within a given file will be in chronological order because that is a requirement for successful loading of data. However, the files are not loaded in file extension order and are therefore do not appear in date order in the LTPPD4 table.
In order to restrict the records viewed to a specific file, the 'Restrict to Selected File' option must be checked. The file selected here does not need to match the one selected in the Card Statistics dialog box.
When the option selected is 'By Day, errors only' all records with errors in the LTPPD4 table will be displayed in the sequence they are encountered in the table (recall that the loading order is not chronological). To see only the errors in a specific file, the 'Restrict to Selected File' box must be checked.
The 'By Hour, errors only' option is only available when the 'Restrict to Selected File' box is checked. The data for this display comes from the LTPPRC (See section G.3 for a description of this table type.) table associated with the selected file. It will show all hourly records for a day which has an error whether or not they contribute to the error.
The current record number out of the total number of records is indicated (e.g. Record #: 1/30 in figure 4.1). Use the left and right arrows to scroll through the records to obtain information about the date and time of collection, the error status of the record, and the data on that record.
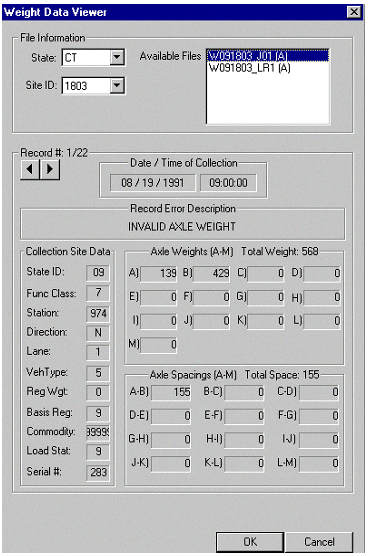
Figure 4-2 Sample weight data viewer
There is no LTPP lane only option for this review. The user must know that information (lane number and cardinal direction) if that data is of particular interest in reviewing the error information.
The Weight Data Viewer illustrated in Figure 4-2 can only be used to view weight data records with errors. It works on a file by file basis using the LTPPRW (See section G.4 for a description of this table type.) table associated with a file to obtain the necessary information. The errors are presented in the order in which they are encountered. It is possible to go both forwards and backwards through the list of errors.
There is no LTPP lane only option for this review. The user must know that information (lane number and cardinal direction) if that data is of particular interest in reviewing the error information.
5. Interpreting Results of QC Processing
This section describes the basic quality control tests the Long-Term Pavement Performance (LTPP) program applies to state and provincial highway agency data. State agencies can use these same tests to help identify potential errors in any weigh-in-motion or vehicle classification data, whether or not they intended for submission to the LTPP program.
Note to the Reader:
The items in "red" in this section reflect functionality that existed in the SAS version of the software but does not currently exist.
The LTPP QC software automates these checks through a program that uses C++ and ORACLE 8.0 in the WINNT 4.0 environment. Users are able to control the processing through the software's Control Panel. Directions for running these programs are provided in sections 1-5 of this document. The program produces a number of output reports and graphs that require interpretation. Essentially, the LTPP software summarizes a data set in a series of simple graphs that can be used to identify "unusual occurrences" in the submitted traffic data. The reviewer must then determine whether these "unusual occurrences" are actually invalid data or rather the result of unusual traffic patterns. A series of examples is provided to illustrate how the quality control checks work and provides information on interpreting the output from the LTPP software.
Note that all graphs produced by the LTPP software are lane- and direction-specific for a relevant period. The software can create graphs for all lanes and directions for which data are submitted and loaded.
The revision of the software has eliminated a number of functions present in the original version of the QC software. Most of that functionality can be reproduced by using SQL on the ORACLE tables and spreadsheets if required. Section 5.4 discusses how this can be done. In order to fully understand this section the user should be familiar with section G on the ORACLE tables associated with this application.
QC edit checks are the first set of quality control checks. The first check counts the number of records (usually 4-card records) present for each day and examines the hourly traffic volume patterns that occurred on those days. The checks performed on volume patterns are discussed in sections 5.1 and 5.2. Gross vehicle weight analysis is a quality control check of 7-card data intended to detect both unreasonable scale calibration and scale calibration shifts over time. It is discussed in section 5.3.
The first set of graph types produced by the LTPP software points out potential equipment failure by showing hourly volume patterns for 4-card records. Each of the QC checks described below results in a graph whose heading indicates the type of potential error detected. Each QC check produces one graph for each lane and direction per day in which an error is detected. If the QC check detects more than one occurrence of a specific error per quarter (for one lane and direction), the hourly volumes for those days are printed on the same graph. (This means that a graph can become quite cluttered if the QC program detects data "errors" in a large number of days.) This means that a substantial number of graphs can be generated.
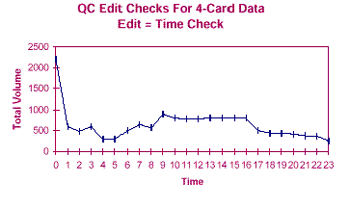
Figure 5-1 Time check edit - Example 1
The TIME CHECK edit graphs the hourly volumes for any day in which total volume at 1:00 a.m. exceeds total volume at 1:00 p.m. for the same lane and direction. If 1:00 a.m. volumes are larger than 1:00 p.m. volumes, the clock may be incorrect, or equipment failures may have arisen midday. Instructions to generate a listing of days which fail this criteria in a text file rather than a graph are found in section 5.4.1.
Examples of output from the Time Check edit routine are shown in Figure 5-1 though 8.
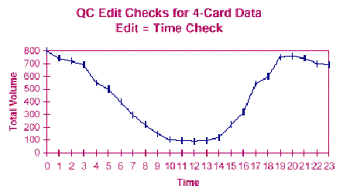
Figure 5-2 Time check edit - Example 2
In Figure 5-1, there is no direct evidence showing that these are caused by a special event that dramatically increased the volume data from a malfunctioning machine. In fact, the high volume around midnight could have been. However, Figure 5-2 shows that all volumes at night are greater than the noon hour volume. These data are questionable.
Figure 5-3, Error! Reference source not found., and Figure 5-5 also show questionable data.
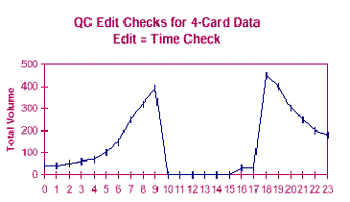
Figure 5-3 Time Check Edit - Example 3
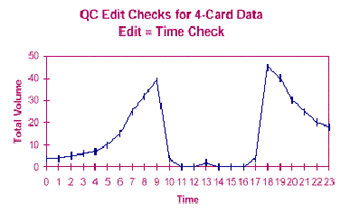
Figure 5-4 Time Check Edit - Example 4
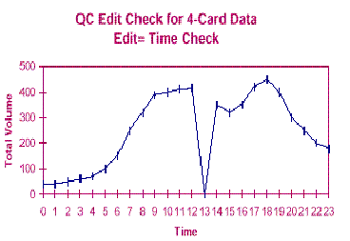
Figure 5-5 Time Check Edit - Example 5
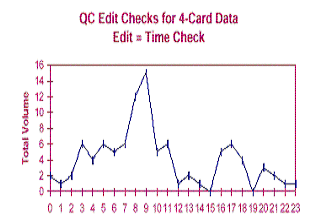
Figure 5-6 Time check edit - Example 6
It is difficult to decide whether Figure 5-6 shows valid data. This volume pattern can occur frequently when the hourly volumes are very low at a given site.
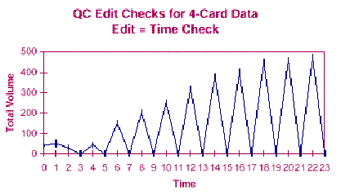
Figure 5-7 Time check edit - Example 7
Figure 5-7 shows irregular on/off patterns. Two hourly volumes seem to be combined into one hour volume. These data would be purged, as it is extremely unlikely that traffic would behave in this manner.
5.1.2 4+ Consecutive Static Volumes Edit
No example of four or more consecutive non-zero hourly volumes is shown. The production of graphs for 4+ Consecutive Non-zeros occurs frequently in the QC analyses, especially with 7-card data from locations where hourly truck volumes are low. However, most of these occurrences represent valid conditions. Therefore, this edit check is ignored most of the time. If the hourly volumes are high and the repeated non-zero hourly volume is also high, then this day of data might be purged.
5.1.3 8+ Consecutive Zero Volumes
The 8+ consecutive zero volume edit graphs the hourly volumes for every day during which the hourly volumes recorded at the site are zero for eight or more consecutive hours. This event usually indicates that some portion of the equipment (typically axle sensors) may have failed, but the data collection equipment is still producing hourly records. Instructions to generate a list (a text file listing dates which are identified by this check) rather than a graph are found in section 5.4.3.
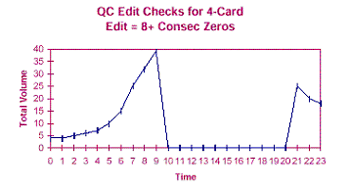
Figure 5-8 8+ consec zeros edit
Figure 5-8 shows a pattern where the hourly traffic volumes from 10 a.m. to 8 p.m. are zero. These data should be purged. This edit check may detect errors when devices are malfunctioning (outputting zero hourly volumes).
The program missing hourly volumes edit graphs hourly volumes for each day during which 4-card records are present for some, but not all, 24 hours of a day. This QC check points out when counters have failed and are no longer producing 4-card records. The graphs show the hours for which data are present for these days, and they are often helpful in explaining days with extremely low volumes that appear elsewhere in the QC graphic output.
The LTPP traffic data QC software discards data for these days if the data are from permanent devices. If the data are from portable devices, they are kept if they are part of a continuous, 24-hour data collection period that stretches over two or more calendar days. The LTPP program makes this distinction between "permanent" and "portable" devices to assure as much consistency as possible in the database (all of the daily volumes from permanent devices are based on midnight-to-midnight counts) while keeping and using as many data as possible from sites where few data are available. (Sites with portable devices may produce only one midnight-to-midnight day of data per year, but more than 48 hours of consecutive traffic counts may be present. Using all of the available hours doubles the number of days of data available for LTPP research in these cases.) (The revised LTPP analysis software ignores the "permanent" and "portable" equipment distinctions. Data is treated as continuous, 7 or more midnight to midnight days for a month, or sampled, less than 7 midnight to midnight days in a month. This distinction applies only to classification data. All weight data is treated as if midnight to midnight days exist.) Instructions to generate a list rather than a graph are found in section 5.4.4.
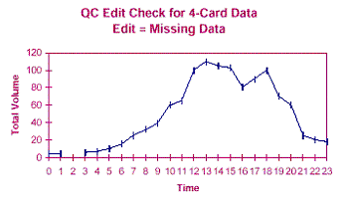
Figure 5-9 Missing data check edit
Figure 5-9 demonstrates the missing data edit check for 4-card data. If the day of data is incomplete (contains less than 24 hourly volumes) and from a permanent device, then the day of data will be purged in level 3 processing in the LTPP database. Level 3 processing does not delete incomplete days of data from a portable device if the incomplete day is the beginning day or ending day of a short-term count. This edit therefore produces graphs of the data that may be purged in Level 3 processing. States using the QC software for their own purposes should treat these partial days in the way that best fits their normal data processing routine.
Two more types of graphs result from a review of the hourly volume patterns for 7-card records. [Not implemented in new software since they are seldom, if ever critical to making decisions on retaining WIM data.]
EDIT= 4+ CONSEC NONZEROS prints the hourly volumes for any day during which four or more consecutive hours have the same non-zero volume. This check is similar to that applied to 4-card records, described above. The only difference is that the 4-card records include car and light truck volumes, whereas the 7-card records usually do not include this information. This means that more 7-card record sites will have "low" volumes, and more of these graphs are likely to be produced even when state reviewers would consider the data valid.
EDIT=ZERO DATA or EDIT=MISSING DATA prints the hourly volumes for days during which 7-card records are present for some, but not all, 24 hours of a day. Unlike this check for 4-card data, when no 7-card data are present for a given hour, the hourly volume is considered zero. This difference is due to the data collection and reporting process. (4-card records are meant to be generated for all hours of the day, regardless of how many vehicles are observed; 7-card records are only generated when a vehicle is observed.)
If the data with zero hourly volumes are from sites that have typically high truck volumes, the data for the remainder of that day are usually considered to be invalid and should be flagged for removal to prevent false hourly volumes (i.e., the information that no traffic occurred during those hours) from being used in the data aggregation process. (The LTPP data aggregation process assumes that lack of a 7-card record simply means that no trucks were present.) If the data are from sites with typically low truck volumes, the data present for the remainder of the day are usually assumed to be valid and should be retained.
5.2.1 Distribution of Gross Vehicle Weight
The Gross Vehicle Weight graph illustrates the distribution of gross vehicle weights (GVW) for a user selected vehicle class (generally FHWA Class 9, 5-axle tractor-trailers). This graph presents a single month, or an entire quarter, at a time depending on the period marked. Only one month or one quarter will appear on each graph. All valid vehicle weights measured during the time period selected are incorporated into the GVW distribution graph. The logic underlying the quality control process is based on the expectation of two peaks in the GVW distribution for Class 9 vehicles. The first peak represents unloaded tractor-trailers and should occur between 28 and 36 kips (1 kip = 1,000 pounds). This weight range has been determined from static scale data collected from around the country and appears to be reasonable for most locations. (Most unloaded peaks fall between 28 and 32 kips.) The second peak in the Class 9 GVW distribution represents the most common loaded vehicle condition at that site and varies somewhat with the type of commodity being carried. Generally, the loaded peak falls somewhere between 70 and 80 kips.
The QC software plots the GVW distribution.
A standard template to obtain a Class 9 GVW distribution is discussed in section 5.5.2. This must be examined to decide whether the vehicle weights illustrated represent valid data or the scale either is not correctly calibrated or is malfunctioning. The following discussion uses the Class 9 vehicles as the standard for site evaluation. To help the you, reference lines appear on the GVW graph at 28, 36, and 80 kips. [not implemented] The graphs also lists percentages of vehicles that are less than 28 kips and vehicles greater than 80 kips in the lower left hand corner of the graph. [Not implemented]. To get the data to calculate these values see section 5.4.5.
Number of Vehicles Heavier than 80 Kips - [Not implemented] A second check performed with the Class 9 GVW data is an examination of the number (or percentage) of vehicles that are heavier than 80 kips. This check should be performed partly because when many piezo-electric scales begin to fail, they generate a nearly flat GVW distribution. This distribution results in an inaccurate ESAL computation for a given number of trucks. It is particularly important to look at the number and percentage of Class 9 vehicles that weigh more than 100 kips. High percentages of extremely heavy Class 9 trucks (particularly vehicles over 100 kips) are assumed to be a sign of scale calibration or operational problems. It is highly unusual for 5-axle trucks (FHWA Class 9) to carry such heavy weights. In almost all cases, trucks legally carrying these heavy weights are required to use additional axles and are therefore classified as FHWA Class 10 (or higher) and do not appear in the GVW graph. While illegally loaded 5-axle trucks may be operating at the site in question, most illegally loaded trucks do not exceed the legal weight limit by more than several thousand pounds, and the number (or percentage) of these extremely high weights is usually fairly low.
In the case of either scale problems or extreme numbers of overloaded trucks, agency personnel should investigate the situation. If the data are valid, they should be submitted to the LTPP database along with an explanation of the investigation findings. Otherwise, the data should be withheld from further use by the LTPP.
Figure 5-10 is an example of a Class 9 gross vehicle weight (GVW) distribution. The unloaded peak falls within the expected unloaded range (28-36 Kips) and the loaded peak is less than the loaded maximum (80 Kips). There are no extreme outliers (large percentage of vehicles greater than 80 kips or less than 12 kips).
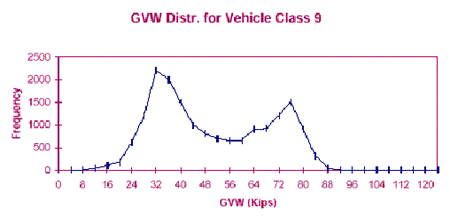
Figure 5-10 Gross vehicle weight distribution for vehicle class 9
Figure 5-11 is an example of a GVW distribution plot that shows a large percentage of vehicle Class 9s that weigh more than 80 kips.
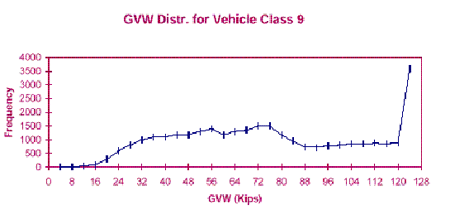
Figure 5-11 GWV Distribution - Example of high percentage of overweights
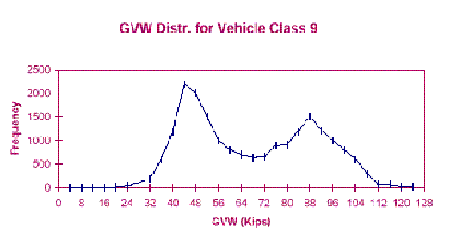
Figure 5-12 GVW Distribution - Example of right shifted peaks
The unloaded and loaded peaks in Figure 5-12 are shifted to the right of the expected ranges. There are also some vehicles that are greater than 100 kips. This plot demonstrates an over-calibration error.
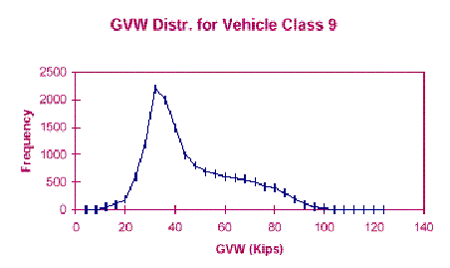
Figure 5-13 GVW distribution - Example without loaded peak
Figure 5-13 illustrates a GVW distribution without a loaded peak. These data would not be purged if this situation was typical for this site.
5.3 7-card, 4-card Comparisons
This analysis compares daily traffic volume information submitted in 4-card and 7-card formats. Each graph produced by the program (by lane and direction) contains volumes for one vehicle class, for one month or quarter, from both the 4-card and 7-card files. Significant differences between these two estimates of truck volume are often an indication of machine error. In addition, because most roads have fairly repeatable traffic volume patterns, visual inspection of daily traffic volume patterns often can be used to detect equipment malfunction.
The template described in section 5.3.1 will automatically produce graphs of daily truck volumes for FHWA Classes 6, 8, 9, and 13 on a monthly or quarterly basis. These classes constitute the majority of trucks for many sites, and they are also the classes into which most vehicles are incorrectly classified when vehicle classification equipment is malfunctioning. States may want to examine additional truck classification volumes (for example, for FHWA Class 11) at specific sites using the Graph Manager.
Errors that the graphs produced by this program can help identify include the following:
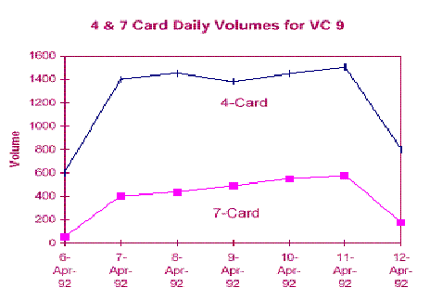
Figure 5-14 Example of non-matching 4- & 7-card volumes
Daily volumes may be examined to see whether they fall within an acceptable range given by the other data points. Seasonal and weekly patterns should be consistent. A dramatic decrease in daily and weekly volumes may indicate a sensor problem. When an axle sensor begins to fail, it often starts to miss one axle on closely spaced tandems. This problem results in a significant shift in observed volumes by classification, as the number of Class 9 trucks counted decreases significantly, and the number of Class 8 trucks increases significantly. Truck volumes also drop because of a variety of sensor errors and other equipment problems. Invalid truck volume increases are usually caused by chattering sensors (which often result in simple misclassification problems and therefore a commensurate drop in some other volume classification) or by poorly tuned loop sensors. Other types of axle sensor failures can also result in sudden volume increases.
When volume estimates from 4-card and 7-card records differ significantly, it is a sign that additional attention must be paid to the submitted data. A variety of conditions can produce these differences.
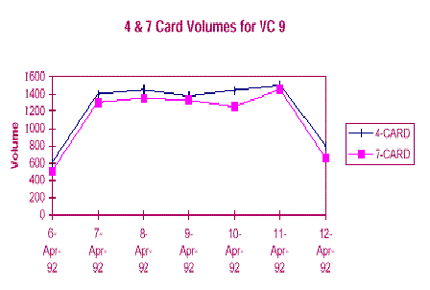
Figure 5-15 Example of matching 4- and 7-card volumes
Two Pieces of Collection Equipment - This graph allows a "sanity check," or a check of the reasonability, of the data collected by both devices. Where two different devices are used (usually a portable classifier and a portable WIM scale, or a permanent classifier and a portable WIM scale), large differences in the two volume estimates can mean either that at least one of the data collection devices is not functioning correctly or that the classification algorithms being used by the devices are inconsistent. In all likelihood, one (or both) of the data collection devices is incorrectly classifying trucks. This may mean that one of the devices is malfunctioning, or it may mean that one of the devices has a poor translation table for converting axle spacing and axle count information into classification information. Usually the equipment has to be visually observed to determine which system is misclassifying vehicles.
Figure 5-14 gives an example of a big difference between 4-card and 7-card daily volumes for trucks. Figure 5-15 shows an example in which the 4-card and 7-card daily volumes for vehicle class 9 are similar.
5.3.2 Vehicle Class Distribution Comparison
This analysis compares vehicle class frequencies (percent of truck volume by class) submitted in 4-card and 7-card formats. Each graph produced by the program contains quarterly or monthly frequencies for vehicle classes 4 through 13 from both the 4-card and 7-card files. See section 5.5.4 for the templates on producing these graphs on either a monthly or quarterly basis. Percentages of each vehicle class in comparison to total trucks are shown at the top of each graph for 4- and 7-card data. The total volume of trucks counted (by card type) is plotted in the graph itself. [Not implemented; see section 5.4.6 for instructions on how to obtain the necessary data.] Note that the plot shows total vehicle volumes not percentages. These volumes are not adjusted to account for different count durations. Thus, the total volume presented in this graph for a 12-day classification count will be much higher than the volume for that vehicle class from a 2-day weighing session during the same period, even if the two devices counted the same number of trucks during the two days that the WIM scale operated. Similarly, the percentages of vehicles counted by class and shown in tabular form at the top of the graph are for the duration of all days of data for the period being plotted. This tabular information and graph can be used to perform several quality control checks. The primary checks that can be performed are discussed below. The percentages referenced must be generated separately.
Atypical Percentages or Frequencies - If agency personnel know roughly the typical truck mix at the site, this graph can indicate when a scale is malfunctioning by showing atypical vehicle percentages or frequencies for truck classes. For example, in many states Class 9 trucks are observed much more frequently than Class 8 trucks. (This ratio is usually more than 3 to 1.) When this graph shows that the number of Class 8 trucks observed exceeds the number of Class 9 trucks, the agency should examine the operation of the data collection equipment to determine whether the equipment is consistently missing axles.
Similarly, these graphs often show that WIM and automatic vehicle classification devices are treating some smaller vehicles differently. This becomes apparent when one of these devices observes a very high proportion of Class 5 trucks (2-axle, 6-tire trucks) while the other observes relatively few of these vehicles. This discrepancy normally indicates either that one of these devices is slightly off on its measurement of axle spacing distances or that the classification algorithms used by the two devices are dissimilar.
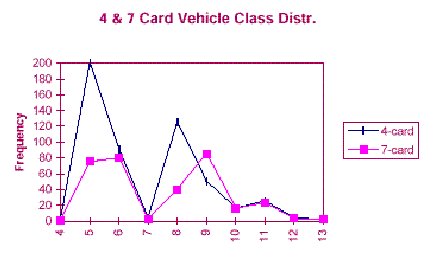
Figure 5-16 Example of vehicle class distribution discrepancies
If there is a big difference between 4-card and 7-card daily volumes for a given vehicle class, the 4- and 7-card vehicle class distribution plots can detect misclassification errors. Figure 5-16 demonstrates misclassification errors between vehicle Class 8 and vehicle Class 9.
5.4 Generating Statistics using the ORACLE tables
The user is assumed to be familiar with SQL and its syntax in the ORACLE environment when referencing this section. Any application used to create and run SQLs may used with any needed syntax changes. The SQLs presented were developed for SQL Worksheet® in ORACLE Enterprise Manager®.
The naming conventions used in this subsection are:
D = direction
dd = day
L = lane
mm = month
yyyy = 4-digit year
xxxxxx = concatenation of STATE_CODE and SHRP_ID
The direction for a LTPP lane is numeric. The value of D can be from 1-8 where 1 is North, 2 is Northeast, 3 is East, 4 is Southeast, 5 is South, 6 is Southwest, 7 is West and 8 is Northwest. The IMS reports only N, S, E or W. How the intermediate directions are converted (or if they even exist in the original data) has not been determined at this point. The LTPP lane, L, is the number of the lane on the highway counting through lanes from the right shoulder in the LTPP direction. With one or two exceptions, the LTPP lane is equal to 1. A value of 0 for LTPP lane means that all of the lanes in one direction have been included in the data as a single value. This data will not be in the summary tables. Grouped lane data is considered a critical error. To determine if there is more than 1 lane in the LTPP direction, the LTPP Information Management System (IMS) must be checked.
The common syntax to get data from a table is:
SELECT * FROM tablename WHERE fieldname1 = AA [ AND fieldname2 = BB ...] [ORDER BY fieldnameA [, fieldnameB, ....] ;
The asterisk indicates that all fields in a record will be extracted from a file. It can be replaced by explicit lists of variables in any of the statements in these subsections. Where variables are explicitly named, other orders are possible. The ones provided reflect the author's preferences. In this section anything in brackets [ ] is optional.
To generate a listing of specific information to accompany the data set, a file may be spooled to capture the extraction results. The process produces an ASCII text file that may be manipulated in a spreadsheet or database. Start the sequence with a spool command which includes a path and file name to store the text output in a logical place. There can be NO spaces in any of the subdirectory names in the path. Enter as many SQLs as desired and end the sequence of commands with the spool off command. Alternatively, each command may be sent to an individually named file.
5.4.1 List of Days - 1 am > 1 pm Volume
SELECT direction, lane , year, month, day, error FROM LTPPD4xxxxxx
WHERE error = 62 [AND direction = D] [AND lane = L] [AND year = yyyy] [AND month = mm]
[ORDER BY [direction, ] [lane, ] [year], [month,] [day]];
5.4.2 List of Days - 4 Consecutive Static Volumes
SELECT direction, lane , year, month, day, error FROM LTPPD4xxxxxx
WHERE error = 61 [AND direction = D] [AND lane = L] [AND year = yyyy] [AND month = mm]
[ORDER BY [direction, ] [lane, ] [year], [month,] [day]];
5.4.3 List of Days - 8+ Consecutive Zeros
SELECT direction, lane , year, month, day, error FROM LTPPD4xxxxxx
WHERE error = 60 [AND direction = D] [AND lane = L] [AND year = yyyy] [AND month = mm]
[ORDER BY [direction, ] [lane, ] [year], [month,] [day]];
5.4.4 List of Days - Missing Data
SELECT direction, lane , year, month, day, error FROM LTPPD4xxxxxx
WHERE error = 63 [AND direction = D] [AND lane = L] [AND year = yyyy] [AND month = mm]
[ORDER BY [direction, ] [lane, ] [year], [month,] [day]];
5.4.5 Statistics for Class 9 Weights
This application requires manipulating the exported data by hand or in a spreadsheet to obtain the actual statistics.
SELECT * FROM LTPPGVWyyyyxxxxxx
WHERE vehicle_class = 9 [AND lane = L] [AND direction = D]
ORDER BY [direction,] [lane,] month;
The total number of class 9 vehicles can be determined from the LTPPGVW table by summing all the bins (BIN1 - BIN50). The BINj represent the weight groups into which gross vehicle weights have been aggregated to obtain a frequency distribution. Each bin represents a four kip (four thousand pound) interval from the lowest value up to 1 less than the next multiple of 4000 (i.e. 0-3999, 4000-7999 ...). It is also possible to use the LTPPVOL7 tables and sum the values over all days in a month.
To find the percentage and number of unusually light or heavy vehicles use the following calculations.
A extra step is required to get quarterly numbers. Aggregation with Excel® of all relevant monthly totals for a quarter is probably the simplest way.
The same data set can be used to plot comparative monthly or quarterly gross vehicle weight distributions after loading into a spreadsheet. A similar process may be used to get the data for any other vehicle classification.
5.4.6 Volume Comparisons 4- & 7- cards
Note that to compare data for a given period the values of year (yyyy) within the SQL statement must match in these two statements.
4-card Volume information -
SELECT * FROM LTPPD4xxxxxx
WHERE error = 0 AND purge = 0 AND hour = 0 [AND direction = d] [AND lane = L]
AND year = yyyy
ORDER BY [year,] [direction,] [lane,] month;
The values for error = 0, purge = 0 and hour = 0 eliminate all days with invalid data or less than 24 hours in the day.
7-card Volume information -
SELECT * FROM LTPPVOL7yyyyxxxxxx
[WHERE [direction = d] [AND lane = L] ]
ORDER BY [direction,] [lane,] month ;
A separate select statement is needed for each year to be matched in the 4-card data set.
5.4.7 Graphs Excluding Purged Records
Purging data eliminates it from inclusion in creating daily summaries and annual estimates of vehicle statistics. However, the QC software provides no method for reviewing the impact on the data set after the purges are applied. The process described here is one method for investigating the effects of the purges. It uses the ORACLE tables since the software processes the output files first and then annotates the ORACLE tables with the same information.
To determine which data files have had purges applied a query may be made of the LTPPFILETRACKER table with as much detail as required.
SELECT filename FROM LTPPFILETRACKER WHERE purge = 1 [AND state_code = XX] [AND shrp_id = AAAA ..] [AND startdate BETWEEN ('dd-MON-yyy' AND 'dd-MON-yyyy)]. The required date format is '01-JAN-1998'.
This does not provide any information as to the reason for the purges.
To verify that all classification data which failed a daily record check and was supposed to be purged has been use the following two step process.
Run a SQL of the form:
SPOOL path\dailypurge.sql;The value of xxxxxx may be as general or specific as desired.
SELECT 'SELECT year, month, day, error, purge FROM ', table_name, ' WHERE error >= 60 AND purge = 0 AND year = yyyy order by year, month, day ; ' FROM USER_TABLES WHERE table_name LIKE 'LTPPD4xxxxxx' ORDER BY table_name;
Edit the spooled results to remove any non-SQL statements and set up the spool file to save the results. The output of the SQL (the nested select) will be a list of all days with 8+ consecutive zero volumes, 4+ consecutive static volumes, a 1 a.m. > 1 p.m. volume or missing hourly volumes which have NOT been purged. This does not automatically imply an error as there are instances (i.e. portable data collection equipment) where these records should not be purged.
To verify days have been purged for other types of errors, omit the error >= 60 condition from the SQL. Wildcard characters can be used to generate multiple file lists.
To verify that the relevant days of weight data have been purged, the same process can be executed using the LTPPVOL7yyyyxxxxxx table name and omitting the condition on error. The daily level errors are not applicable to weight files.
The output of any of these SQLs may then be graphed.
There is no way using this software to investigate the impact of purges on the GVW file without using the output files as raw data and reloading the data to compute new GVW distributions.
5.5 Standard Graphing Templates
The following set of graphing templates are suggested as standard for any installation of the traffic software. They provide the functionality to evaluate the data using the guidelines in this section.
A discussion of the Graph Template Manager is found in section 3.5.4.
This template will produce all of the graphs discussed in section 5.1.
This template will produce the monthly graph discussed in section 5.2.1.
This template will produce a quarterly GVW graph for Class 9s.
5.5.3 7-Card vs. 4-Card Volume
The procedure as explicitly outlined is for monthly graphs. A quarterly template should also be created using the same process with Quarterly as the 'Month' option and QTR in lieu of MON in the labels.
5.5.4 7-Card vs. 4-Card Class Distribution
The procedure as explicitly outlined is for monthly graphs. A quarterly template should also be created using the same process with Quarterly as the 'Month' option and QTR in lieu of MON in the labels.
A number of trends can be plotted using appropriate extractions and summaries of data from the ORACLE tables. The list provided here is not intended to be exhaustive. It should be apparent that the yearly data comparisons require processing more than 1 year of traffic data through the new software in order to load the relevant ORACLE tables.
A. LTPP QC System Requirements
Most newly purchased, standard personal computers are sufficient to operate the software. Minimum system requirements recommended for operating the LTPP QC software include:
The software is distributed in a zipped file. The contents should be unzipped and the program added through the Add/Remove Programs function of Control Panel using the setup.exe provided.
Updates are generally done by unzipping a revised executable and copying it over the existing executable.
The software may be installed and run on multiple machines simultaneously.
B. DAT File Requirements for Operation LTPP QC
The DAT files are the group of files referred to elsewhere in this document as reference files. All .dat files must be located in a DAT directory, which must be located in the directory specified in the "Base Data Location" on the PREFS menu. For example:
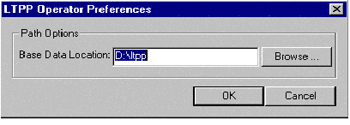
Figure B-17 Example of preferences selection
In this example, the base data location is D:\LTPP. All .dat files must then reside in D:\LTPP\DAT. Note that all user supplied subdirectory names are limited to 8 characters.
The required DAT files for LTPP QC are:
An operator.dat file is created in each user's WIN NT profile under LTPP subdirectory. This text file has the following :
Example data:
SS SHRP Y M D ID3 ID6 RHO SN DPTH PTYPE DIR LN NUMLTPP NUMNON FLGS SRO REASON
# -- This is a comment line in the SHRP.DAT file
48 0001 0000 00 00 001 000001 2.5 . 8.0 R 7 1 2 2 100 SS3 ORIGINAL PAVEMENT PARAMETERS
48 0001 1991 10 22 001 000001 2.5 . 8.0 R 7 1 2 2 100 SS3 1/4" OVERLAY
48 1039 0000 00 00 039 000239 2.5 3.0 . F 3 1 2 2 100 SS3 ORIGINAL PAVEMENT PARAMETERS
48 1039 1991 05 29 039 000239 2.5 3.0 . F 3 1 2 2 100 SS3 1/2" OVERLAY
48 1039 1991 09 12 039 000239 2.5 3.0 . F 3 1 2 2 100 SS3 CHIP SEAL COAT
48 1039 1991 07 08 039 000239 2.5 3.0 . F 3 1 2 2 100 SS3 COMPLETE REBUILDING OF SECTION
| FIELD | TYPE | LEN | DESCRIPTION |
|---|---|---|---|
| SS | INTEGER | 2 | State FIPS Code |
| SHRP | INTEGER | 4 | SHRP 4 digit Id code |
| Y | INTEGER | 4 | Effective year |
| M | INTEGER | 2 | Effective month |
| D | INTEGER | 2 | Effective day |
| ID3 | ALPHA | 3 | State 3 digit Id code |
| ID6 | ALPHA | 6 | State 6 digit Id code |
| RHO | FLOAT | x | Terminal serviceability Index |
| SN | FLOAT | x | Structural Number |
| DPTH | FLOAT | x | Pavement Depth |
| PTYPE | CHAR | 1 | Pavement type R=rigid or F=flexible |
| DIR | INTEGER | 1 | Direction of LTPP Lane (compass direction 1-8) |
| LN | INTEGER | 1 | LTPP lane number |
| NumLTPP | INTEGER | 1 | Number of lanes in the LTPP direction |
| NumNON | INTEGER | 1 | Number of lanes in the Non-LTPP direction |
| FLGS | INTEGER | 3 | 3 digit flags field |
| SRO | ALPHA | 3 | Data availability code including SRO code and data quality/quantity indicator |
| REASON | ALPHA | x | Construction reason |
Data Entry Rules:
Field definitions:
The Data Availability Code is written in this order (see Table C-1 for the list of Data Availability Codes):
For example, if a permanent, continuously operating AVC device is located at the site, but the portable WIM device is set up at a location downstream of the LTPP test location, the code would be S-R-7 and would be defined as follows:
Table C.1: Codes for Data Availability
0 to 9 Code (Amount of Data Collected):
9 - Continuous WIM meeting the ASTM standard.
8 - Continuous WIM that does not meet the ASTM standard (or hasn't been tested against the ASTM standard).
7 - Permanent classifier operating continuously, with portable WIM for all seasons and weekday/weekend time periods.
6 - Continuous vehicle classification with some seasonal WIM.
5 - Continuous vehicle classification with limited WIM.
4 - Continuous AVC with no WIM data.
3 - Continuous ATR volume station, with limited vehicle classification and truck weight data, and a measurement of truck seasonality.
2 - Vehicle classification and WIM data with some measure of seasonality.
1 - Limited data (only short duration counts) for either vehicle classification or truck weights.
0 - Data collected on a different roadway that the LTPP site, including system level estimates.
S/R/O Code (Location of Class and Weight):
S - Site specific data collection (data collected immediately up- or down-stream from the LTPP site).
R - Site related data collection (data collected on the same road as the LTPP test section, but separated from the test site by some traffic generator).
O - Other (data collected on another highway, or at a location which does not experience the same traffic stream as the LTPP test section.)
An entry in the DEFSHT.DAT file consists of a site index and a set of keyword parameters. The site index is simply a line of text that indicates state FIPS code and SHRP ID. The keyword parameters are labels defining every field that may be set on sheets 11, 12, and 13. This section contains two examples of entries in the DEFSHT.DAT file. Refer to sections D.1, D.2 and D.3, and D.4 for a complete list of the valid keyword parameters.
[48 1123] -- Format: [<STATE> <space> <SHRP ID>]ROUTE*=SH 43
MILEPOST*=109.4
LOCATION*=4 Miles East of Stanton River Bridge
*Each of these are keyword parameters - Format: <KEYWORD> = <VALUE>
Each entry may contain any or all of the available keyword parameters. When a sheet is initially created in memory, all fields are set to blank. When the entry is read from the DEFSHT.DAT file, only those fields that have keyword parameters are modified. Consequently, an entry may be created so that the resulting transmittal sheet can have as many or as few fields filled in with default values as the user desires.
Example:
The following example shows the entries in the DEFSHT.DAT file for two sites in the state of Idaho. Site 1001 has a permanent Diamond TT2001 vehicle classifier installed using piezo film as the axle sensors. Once a quarter, a Golden River Weighman is used to collect the WIM data. The AVC data is submitted using the FHWA class scheme, while the WIM data is submitted using the 6 digit code. Site 2034 has a permanent PAT DAW200 WIM device installed that generates both 4 and 7 cards in the FHWA class scheme. Since the DAW200 uses a bending plate as the sensor, the vehicle class sensor type (CSENSOR) keyword parameter is set to OTHER and the bending plate sensor is specified using the CSENSOROTHER keyword parameter.
[16 1001]
ROUTE = US 95
MILEPOST = 230.92
LOCATION = 1.5 MILES SOUTH OF JCT US 12
CCLASS = FHWA
CMAKE = DIAMOND
CMODEL = TT2001
CTYPE = PERM
CSENSOR = FPFILM
WCLASS = 6DIGIT
WMAKE = GOLDEN RIVER
WMODEL = WEIGHMAN
WTYPE = PORT
WSENSOR = CAPPAD
[16 2034]
ROUTE = I84
MILEPOST = 113.6
LOCATION = 4.0 MILES EAST OF BLISS
CCLASS = FHWA
CMAKE = PAT
CMODEL = DAW200
CTYPE = PERM
CSENSOR = OTHER
CSENSOROTHER = BENDING PLATE
WCLASS= FHWA
WMAKE = PAT
WMODEL = DAW200
WTYPE = PERM
WSENSOR = BENDPLATE
| KEYWORD PARAMETER | VALID VALUES | DESCRIPTION |
|---|---|---|
| ROUTE | ANY VALID CHARACTER STRING | HIGHWAY ROUTE THE SHRP SITE IS LOCATED ON |
| MILEPOST | ANY VALID CHARACTER STRING | MILEPOST ON ROUTE |
| LOCATION | ANY VALID CHARACTER STRING | DESCRIPTION OF LOCATION OF SITE |
| BDATE | MM-DD-YYYY, MM-DD-YY, MM/DD/YYYY, MM/DD/YY, MM\DD\YYYY, MM\DD\YY | BEGINNING DATE OF COUNT |
| BTIME | HH:MM | BEGINNING TIME OF COUNT |
| EDATE | MM-DD-YYYY, MM-DD-YY, MM/DD/YYYY, MM/DD/YY, MM\DD\YYYY, MM\DD\YY | ENDING DATE OF COUNT |
| ETIME | HH:MM | ENDING TIME OF COUNT |
| COMMENT0 | ANY VALID CHARACTER STRING | COMMENT LINE #1 |
| COMMENT1 | ANY VALID CHARACTER STRING | COMMENT LINE #2 |
| COMMENT2 | ANY VALID CHARACTER STRING | COMMENT LINE #3 |
| COMMENT3 | ANY VALID CHARACTER STRING | COMMENT LINE #4 |
| COMMENT4 | ANY VALID CHARACTER STRING | COMMENT LINE #5 |
| COMMENT5 | ANY VALID CHARACTER STRING | COMMENT LINE #6 |
| COMMENT6 | ANY VALID CHARACTER STRING | COMMENT LINE #7 |
| COMMENT7 | ANY VALID CHARACTER STRING | COMMENT LINE #8 |
| COMMENT8 | ANY VALID CHARACTER STRING | COMMENT LINE #9 |
| COMMENT9 | ANY VALID CHARACTER STRING | COMMENT LINE #10 |
D.2 Keywords - Classification Data Transmittal Sheets
| KEYWORD PARAMETER | VALID VALUES | DESCRIPTION |
|---|---|---|
| CMAKE | ANY VALID CHARACTER STRING | MAKE (MANUFACTURER) OF CLASSIFICATION EQUIPMENT (SHEET 12) |
| CMODEL | ANY VALID CHARACTER STRING | MODEL OF CLASSIFICATION EQUIPMENT (SHEET 12) |
| CTYPE | PORT, PERM | TYPE OF CLASSIFICATION COUNT |
| CCLASS | FHWA, OTHER | TYPE OF CLASSIFICATION SCHEME USED FOR CLASSIFICATION COUNT |
| CSCHEME | ANY VALID CHARACTER STRING | IF CCLASS=OTHER THEN THIS VALUE GIVES NAME OF SHA SCHEME |
| CSENSOR | ROADTUBE, PCABLE, PFILM, LOOPS, OTHER | TYPE OF SENSOR USED FOR A CLASSIFICATION COUNTER |
| CSENSOROTHER | ANY VALID CHARACTER STRING | IF CSENSOR=OTHER, THEN THIS STRING GIVES THE NAME OF THE SENSOR TYPE. |
| GENERALFACT | NUMBER:NAME: FACTOR:STD | GENERAL ADJUSTMENT FACTORS NUMBER BETWEEN 1 AND 4 |
| CLASSFACT | CLASS:NUMBER: NAME:FACTOR:STD, w/ CLASS BETWEEN 1 AND 20; NUMBER BETWEEN 1 AND 4 | CLASS SPECIFIC ADJUSTMENT |
D.3 Keywords - Weight Data Transmittal Sheets
| KEYWORD PARAMETER | VALID VALUES | DESCRIPTION |
|---|---|---|
| WMAKE | ANY VALID CHARACTER STRING | MAKE (MANUFACTURER) OF WIM EQUIPMENT |
| WMODEL | ANY VALID CHARACTER STRING | MODEL OF WIM EQUIPMENT |
| WTYPE | PORT, PERM | TYPE OF WIM COUNT |
| WCLASS | FHWA, 6DIGIT, OTHER | TYPE OF CLASSIFICATION SCHEME USED FOR WIM COUNT |
| WSCHEME | ANY VALID CHARACTER STRING | IF WCLASS-OTHER THEN THIS VALUE GIVES NAME OF SHA SCHEME |
| WSENSOR | PFILM, CAPPAD, BENDPLATE, HYDRAULIC, BRIDGE, OTHER COUNTER | TYPE OF SENSOR USED FOR A WIM |
| WSENSOROTHER | ANY VALID CHARACTER STRING | IF WSENSOR=OTHER, THEN THIS STRING GIVES THE NAME OF THE SENSOR TYPE |
D.4 Keywords - Volume Data Transmittal Sheets
| KEYWORD PARAMETER | VALID VALUES | DESCRIPTION |
|---|---|---|
| AXLEFACT | FACTOR:STD DEV | AXLE CORRECTION FACTOR AND STANDARD DEVIATION |
| COUNTTYPE | ONEWAY, TWOWAY, GPSLANE | TYPE OF VOLUME COUNT |
| DOWFACT | FACTOR:STD DEV | DAY-OF-WEEK FACTOR AND STANDARD DEVIATION |
| GPSDISTFACT | FACTOR | GPS LANE DISTRIBUTION FACTOR |
| GPSDISTSOURCE | ANY VALID CHARACTER STRING | GPS LANE DISTRIBUTION FACTOR SOURCE |
| OTHERFACT | FACTOR:STD DEV | OTHER FACTOR AND STANDARD DEVIATION |
| OTHERFACTNAME | ANY VALID CHARACTER STRING | NAME OF THE OTHER FACTOR |
| SEASONFACT | FACTOR:STD DEV | MONTHLY/SEASONAL FACTOR AND STANDARD DEVIATION |
| STATEID | ANY VALID NUMBER | STATE ASSIGNED ID CODE |
| VMAKE | ANY VALID CHARACTER STRING | MAKE (MANUFACTURER) OF VOLUME EQUIPMENT |
| VMODEL | ANY VALID CHARACTER STRING | MODEL OF VOLUME EQUIPMENT |
| VTYPE | PORT, PERM | TYPE OF DEVICE INSTALLATION |
| VSENSOR | ROADTUBE, PCABLE, PFILM, LOOPS, OTHER | TYPE OF SENSOR USED FOR A VOLUME COUNTER |
| VSENSOROTHER | ANY VALID CHARACTE STRING | IF VSENSOR=OTHER, THEN THIS STRING GIVES THE NAME OF THE SENSOR TYPE |
WSENSOR does not appear to have the various types of piezo sensors currently in use. A desirable enhancement would be to add the 5 types of piezo sensors to eliminate entering OTHER for them as well as a generic ceramic piezo sensor. Key words would be as follows:
QPIEZO - Quartz piezo
BFPIEZO - Bare flat piezo
BRPIEZO - Bare round piezo
CFPIEZO - Channelized flat piezo
CRPIEZO - Channelized round piezo
UCPIEZO - Unknown configuration of ceramic piezo.
The NEWSHT.DAT file format is very similar to the DEFSHT.DAT file. An entry consists of a file index and a set of keyword parameters. It is very important to note that the DEFSHT.DAT file has entries based on state and SHRP site while the NEWSHT.DAT file has entries based on the SHA file name. The software expects the entries in NEWSHT.DAT to be sorted in ascending order by file name.
A standard entry is of the form:
| [<FILENAME>!] | Begin Date | End Date | Begin Time | End Time |
|---|---|---|---|---|
| [C481123.KO1!] | 4-3-93 | 4-3-93 | 00:00 | 23:00 |
An exclamation point following the filename signifies replacement mode. Four positional parameters are defined that follow the file name on the same line. These are begin date, end date, begin time, and end time. The positional parameters are provided so that a single line of text may be entered in to the NEWSHT.DAT file for those files that the begin/end date/times are the only fields that need to be specified to complete creation of transmittal sheets. The positional parameters are optional and do not have to be specified. However, the transmittal sheets cannot be completed without this information. If any are specified, then they must be specified in the order shown. If any one parameter is specified, then all preceding parameters must also be specified. For instance, if it is desired to specify end date, then begin date must also be specified.
If the data has been collected at a location other than that in the DEFSHT.DAT file for the site, then the changes may be noted by using the relevant key words immediately following the file name line. These key word entries must be repeated for every file that has collection information which does not match the DEFSHT.DAT entries. The key words which follow on the next lines are the same as those used for DEFSHT.DAT. A list of the key words and the allowable values is includes in sections D.1-4.
E.1 Example - NEWSHEET to list incoming files
The following Texas SHA files are to be processed through the QC software. The default values for site 1123 listed in the DEFSHT.DAT file are correct and adequate for creating the transmittal sheets for these files. Consequently only the begin/end dates/times need to be specified in the NEWSHT.DAT file. These are specified using the positional parameters so that only one line per file needs to be entered into the NEWSHT.DAT file.
The transmittal sheet for C481123.K01 has been previously entered manually, but several values were entered incorrectly. Therefore, the user chooses to use replacement mode so that the transmittal sheet created by the Level 4 processor will replace the one entered by hand.
[C481123.K01!] 9-10-91 9-10-91 00:00 23:00
[C481123.KA1 ] 9-11-91 9-11-91 00:00 23:00
[W481123.K01 ] 9-10-91 9-10-91 00:00 23:00
[W481123.KA1 ] 9-11-91 9-11-91 00:00 23:00
[W481123.KB1 ] 9-12-91 9-12-91 00:00 08:00
E.2 Example- NEWSHEET Changing DEFSHT values
This example shows how to override the values in the DEFSHT.DAT file using keyword parameters in the NEWSHT.DAT file. Consider the site entry for site 16 1001 in section D. During the summer quarter, Idaho's Golden River WIM unit was run over by a truck and is no longer operational. They substitute a portable PAT DAW100 for the fall quarter until the Golden River equipment can be repaired. Consequently, the default device type listed in the DEFSHT.DAT file needs to be overridden so that the transmittal sheets for the WIM data files will indicate the correct WIM device. At the same time, comment lines are specified so that the transmittal sheets will reflect the reason for the change in equipment. Also general factors for C161001.L61 were submitted. The NEWSHT file entries are listed below.
[C161001.L11] 10-01-91 10-01-91 00:00 23:00
[C161001.L21] 10-02-91 10-02-91 00:00 23:00
[C161001.L31] 10-03-91 10-03-91 00:00 23:00
[C161001.L41] 10-04-91 10-04-91 00:00 23:00
[W161001.L11] 10-01-91 10-08-91 07:00 11:00
WCLASS = FHWA
WMAKE = PAT
WMODEL = DAW100
WSENSOR = PFILM
COMMENT0 = NORMAL GOLDEN RIVER WIM DEVICE WAS DAMAGED BY TRUCK.
COMMENT1 = USING SUBSTITUTE DAW100 DEVICE BORROWED FROM DIST 3.
[C161001.L51] 10-05-91 10-05-91 00:00 23:00
[C161001.L61] 10-06-91 10-06-91 00:00 23:00
GENERALFACT=1:SEASONAL FACTOR:1.0123:.0234
GENERALFACT=2:MACHINE ADJUST FACT:1.1443:.0899
[C161001.L71] 10-07-91 10-07-91 00:00 23:00
F. Input and Output File Conventions
F.1 File Naming - Raw Data Files
The file name will be provided by the SHA for each volume count, classification count, or weight session as it is submitted to the RSC for entry into the National Traffic Database. Since original software operated under DOS 3.3, the file name is limited to eight characters with a three-character extension. This convention has NOT changed with the new software. When the SHAs submit data files to the RSC, the file name should be noted on the data transmittal form. The format for a file name is described in the following paragraphs. The software will prevent misnamed files from loading and report the reason to the log file.
The first character of the file name will be a character referencing the type of data collected; W refers to weight data, C to classification data, and V to traffic volume data. The character H is used for HELP files, a file type not supported by the software.
The second through seventh characters of the file name will be the six-digit SHRP site ID number. The first two digits (2-3) are the State Code, and the next four digits (4-7) are the SHRP test site ID number. The eighth character of the file name has been reserved for use by the RSC to describe the data entry, editing, and summarization stage of the data file.
F.2 File Naming - Processed Data Files
The naming of a processed data file varies from that of a raw data file by the addition of a character in front of the file name. The character is either 3, 4, or 7 depending on whether volume, classification or weight data is included in the file. Characters two through eight are identical to characters one through seven of the raw data file. The extensions are identical.
F.3 File Naming - Extensions for Data Files
The three characters of the extension are an index to the starting date (Month, Day, Year) of the count, beginning with the month code as the first character of the extension. The second character of the file name extension is an index to the beginning day. The third character of the extension is the code for the year of the count. Normally, the year code would require two digits to cover the period 1954 to 2025. However, by creating two groups of the years (1954 to 1989 and 1990 to 2025) and by coding the month depending upon which year group it falls into, only one digit is required to cover a period of 72 years. This will generally be sufficient to cover the period of interest to the SHRP LTPP, 1965 to 2010. To illustrate how this works, a count made in November 1988 would be given the month code "A" because it falls in the first year group. On the other hand, November 1991 would be given the month code "M" because it falls in the second group of years.
The creation of the file name and the use of the one-digit year code are illustrated in the following examples.
Table F-1 File Naming Convention Example - Raw Data File
Example File Name: W123456.MNB
| Character(s) | File Entry | Explanation |
|---|---|---|
| 1 | W | Weight Data |
| 2-7 | 123456 | SHRP Site ID Number |
| 2-3 | 12 | State Code |
| 4-7 | 3456 | Test Site Number |
| 8 | N/A | Reserved for RSC Processing Code |
| Extension | File Entry | Explanation |
| 1 | M | Month of Count (November in the 1990-2025 period. Codes in Table F-3.) |
| 2 | N | Day of Count (24th. Codes in Table F-3.) |
| 3 | B | Year of Count (Either 1965 or 2001. Since the month code is M, which falls in the 1990-2025 period, the appropriate year is 2001. Codes in Table F-4.)) |
Table F-2 File naming convention example - Processed data file
Example File Name: 4C123456.MNB
| Character(s) | File Entry | Explanation |
|---|---|---|
| 1 | 4 | output is 4-card |
| 2 | c | Classification Data |
| 3-8 | 123456 | SHRP Site ID Number |
| 3-4 | 12 | State Code |
| 5-8 | 3456 | Test Site Number |
| Character(s) | File Entry | Explanation |
| 1 | M | Month of Count (November in the 1990-1025 period. Codes in Table F-3.) |
| 2 | N | Day of Count (24th. Codes in Table F-3.) |
| 3 | B | Year of Count (Either 1965 or 2001. Since the month code is M, which falls in the 1990-2025 period, the appropriate year is 2001. Codes in Table F-4.) |
Table F-3 Beginning Date Codes (Month and Day)
Month: January
1954-1989 Month Code: 1
1990-2025 Month Code: C
Day of Month: 1 = 1st, C = 13th, O = 25th
Month: February
1954-1989 Month Code: 2
1990-2025 Month Code: D
Day of Month: 2 = 2nd, D = 14th, P = 26th
Month: March
1954-1989 Month Code: 3
1990-2025 Month Code: E
Day of Month: 3 = 3rd, E = 15th, Q = 27th
Month: April
1954-1989 Month Code: 4
1990-2025 Month Code: F
Day of Month: 4 = 4th, F = 16th, R = 28th
Month: May
1954-1989 Month Code: 5
1990-2025 Month Code: G
Day of Month: 5 = 5th, G = 17th, S = 29th
Month: June
1954-1989 Month Code: 6
1990-2025 Month Code: H
Day of Month: 6 = 6th, H = 18th, T = 30th
Month: July
1954-1989 Month Code: 7
1990-2025 Month Code: I
Day of Month: 7 = 7th, I = 19th, U = 31st
Month: August
1954-1989 Month Code: 8
1990-2025 Month Code: J
Day of Month: 8 = 8th, J = 20th
Month: September
1954-1989 Month Code: 9
1990-2025 Month Code: K
Day of Month: 9 = 9th, K = 21st
Month: October
1954-1989 Month Code: 0
1990-2025 Month Code: L
Day of Month: 0 = 10th, L = 22nd
Month: November
1954-1989 Month Code: A
1990-2025 Month Code: M
Day of Month: A = 11th, M = 23rd
Month: December
1954-1989 Month Code: B
1990-2025 Month Code: N
Day of Month: B = 12th, N = 24th
Table F-4 Beginning Date Codes (Year)
Year
CodeMonthCode
"1 - B"Month Code
"C - N"Year
CodeMonth Code
"1 - B"Month Code
"C - N"0 1954 1990 I 1972 2008 1 1955 1991 J 1973 2009 2 1956 1992 K 1974 2010 3 1957 1993 L 1975 2011 4 1958 1994 M 1976 2012 5 1959 1995 N 1977 2013 6 1960 1996 O 1978 2014 7 1961 1997 P 1979 2015 8 1962 1998 Q 1980 2016 9 1963 1999 R 1981 2017 A 1964 2000 S 1982 2018 B 1965 2001 T 1983 2019 C 1966 2002 U 1984 2020 D 1967 2003 V 1985 2021 E 1968 2004 W 1986 2022 F 1969 2005 X 1987 2023 G 1970 2006 Y 1988 2024 H 1971 2007 Z 1989 2025
F.4 Sort Order for Input Data/a>
The following is the sort order for traffic records input to the Quality Control program: Date, Time
F.5 Format Classification Records (4-card)
Source: Traffic Monitoring Guide (TMG), 2nd edition, Federal Highway Administration, FHWA-PL-92-017, 1992, pg. 5-4-5.
Codes specific to the 4-card:
Vehicle class combination indicator = 0 - Class 2 & 3 reported separately, 1 - Class 2 & 3 reported together.
F.6 Format - Classification Records (C-card)
Source: Traffic Monitoring Guide (TMG) - 3rd Edition, Federal Highway Administration, FHWA, February 1995, pg. 6-4-2.
The C-card format allows for entries from column 20 on to have either leading zeros or leading blanks. Only one option is allowed in any given record.
F.7 Format - Weight Records (7-card face)
*Each of these data items has a default value which must be entered when the data item is not collected.
Source: TMG, 2nd edition, pg. 5-4-7.
The six digit code which may be entered for the vehicle type code as an alternative to a state classification system or the FHWA 13 bin system from the TMG is shown in Tables F.1 to F.4 taken from the TMG, 2nd edition.
Table F-5 Definition of 6-Digit Classification Scheme From FHWA Truck Weight Study
Vehicle Type Coding Chart*
Table F-6 Table A, B, C and D for 6-Digit Classification Codes
Table A - Light Trailer Modifer
0 = No trailer
Table B - Axle and Tire Modifer
0 = Axle arrangement not recorded
Table C - Total Axles
0 = Panel and pickup
Table D - Total Axles on Trailer
1 = Single-axle trailer F.8 Format - Weight Records (7-card continuation)
** Used only for truck combinations having six or more axles. Immediately follows the face record.
Source: TMG, 2nd edition, pg. 5-4-7.
F.9 Format - Station Description Record (2-Card)
This record provides header information for 2nd edition TMG classification and weight records. There is supposed be one for each direction in the data file at a minimum. It is possible to have one for each lane in each direction. The software currently only recognizes but does not use the data in the card when it comes at the top of 7-card files. The information in here is some of the information used in DEFSHT.DAT.
Source: Traffic Monitoring Guide (TMG) -2nd edition, Federal Highway Administration, FHWA-PL-92-017, 1992, pg. 5-4-1.
The following are the code ranges for station identification cards for the indicated fields for data collected by the LTPP program. Other values may be appropriate for statewide data collection systems. For the definition associated with each code see the relevant TMG page.
F.10 Format - Weight Records (W-card)
Source: TMG, 3rd edition, pg. 6-5-2.
The vehicle classification expected with this record is either the FHWA 13 bin scheme from the TMG, 3rd edition or a two-digit state classification scheme. The classifications are as follows:
1 - Motorcycles F.11 Format - Station Description Record (S-Card)
Source: Traffic Monitoring Guide (TMG) - 3rd edition, Federal Highway Administration, FHWA, February 1995, pg. 6-2-2.
The following are the additional code ranges for station identification cards for the indicated fields for data collected by the LTPP program. Other values may be appropriate for statewide data collection systems. For the definition associated with each code see the relevant TMG page.
Sample type for traffic volume - T, N
All text fields in this record are left justified.
F.12 Codes used in TMG card submissions
DIRECTION:
1 - North
FUNCTIONAL CLASS:
RURAL
URBAN
LANE OF TRAVEL OR MAINLINE LANE OF TRAVEL: F.13 Format - Weight Records (HELP-card)
A HELP file is a file in comma separated value format with all numeric fields. HELP stands for highway electronic license plate and refers to one of the earliest commercial vehicle ITS applications. All numbers are right justified within a field. Fields are comma delimited. Each record starts with a "<" and ends with a ">". All weights are in tenths of kips. All spacings are in tenths of feet. Values are multiplied to produce integers in the record.
F.14 Format - ATR Station Record (1-Card)
Source: Traffic Monitoring Guide (TMG), 2nd edition, Federal Highway Administration, FHWA-PL-92-017, 1992, pg. 3-2-3
This format is provided for information only. LTPP does not currently or in the future expect to process this record format, since the data associated with it is not useful for LTPP research needs.
F.15 Format - Volume data records (3-card)
Source: Traffic Monitoring Guide (TMG) - 2nd edition, Federal Highway Administration, FHWA-PL-92-017, 1992, pg. 3-2-4; 3rd edition, Federal Highway Administration, FHWA, February 1995, pg. 6-3-3.
This data record type contains no useful information about trucks. It is only useful in expanding sampled AVC data to full year estimates. For a full discussion of its use see the LTPP traffic analysis software documentation.
3-card specific codes:
DAY OF WEEK (3-card only): 1 = Sunday, 2 = Monday, 3 = Tuesday, 4 = Wednesday, 5 = Thursday, 6 = Friday, 7 = Saturday.
There are six different types of ORACLE tables created by this program. One is a unique table, LTPPFILETRACKER. Two are input file specific, two are year specific for a site and one is site specific. The existence of ORACLE tables makes it possible to generate statistics about data submitted and processed that previously required a significant amount of labor to generate. While the reports have not been incorporated in the software, a discussion of the possibilities is contained in section G.8.
ORACLE RTDB tables are created in the user account where processing takes place. A traffic user account should be created by the ORACLE DBA and used by all traffic processing personnel to ensure that all traffic tables are created in the same account. This will segregate the traffic tables from the other IMS tables, minimizing the impact on the IMS database. The traffic user account should be created with storage parameters that will allow the thousands of small tables currently required by this software. Be sure that database administrator is aware of their existence to insure backups are made and to avoid accidental deletions.
Columns No. of
ColumnsDescription TMG
page1 1 Vehicle classification record code (4) 5-4-1 2-3 2 State code 5-4-1 4-5 2 Functional Classification 5-4-2 6-8 3 Station Identification Number 5-4-2 9 1 Direction of Travel 5-4-2 10-11 2 Year of Data 5-4-3 12-13 2 Month of Data 5-4-6 14-15 2 Day of Month 5-4-6 16-17 2 Hour of day 5-4-6 18-19 2 Number of motorcycles (optional) 4-A-1 20-23 4 Number of passenger cars or all 2-axle, 4-tire single unit vehicles 4-A-1 24-26 3 Number of other 2-axle, 4-tire single unit vehicle 4-A-1 27-28 2 Number of buses 4-A-1 29-31 3 Number of 2-axle, 6-tire single unit trucks 4-A-1 32-33 2 Number of 3-axle single unit trucks 4-A-1 34-35 2 Number of 4 or more axle single unit trucks 4-A-1 36-37 2 Number of 4 or less axle single trailer trucks 4-A-1 38-40 3 Number of 5-axle single trailer trucks 4-A-2 41-42 2 Number of 6 or more axle single trailer trucks 4-A-2 43-44 2 Number of 5 or less axle multi- trailer trucks 4-A-2 45-46 2 Number of 6-axle multi- trailer trucks 4-A-2 47-48 2 Number of 7 or more axle multi- trailer trucks 4-A-2 49 1 Motorcycle reporting indicator 5-4-6 50 1 Vehicle class combination indicator 5-4-6 51 1 Lane of travel 5-4-6 52-80 31 Blank or optional State data 5-4-6
Motorcycle reporting indicator = 0 - motorcycles not reported, 1 - motorcycles reported.
Columns No. of
ColumnsDescription TMG Ref
Page1 1 Vehicle classification record code (C) 6-4-1 2-3 2 State code 6-2-1 4-9 6 Station Identification Number 6-2-3 10 1 Direction of Travel 6-2-3 11 1 Lane of Travel 6-2-3 12-13 2 Year of Data 6-2-3 14-15 2 Month of Data 6-3-1 16-17 2 Day of Data 6-3-1 18-19 2 Hour of Data 6-4-1 20-24 5 Total Volume 6-4-3 25-29 5 Class 1 Count 6-4-3 30-34 5 Class 2 Count 6-4-3 35-39 5 Class 3 Count 6-4-3 40-44 5 Class 4 Count 6-4-3 45-49 5 Class 5 Count 6-4-3 50-54 5 Class 6 Count 6-4-3 55-59 5 Class 7 Count 6-4-4 60-64 5 Class 8 Count 6-4-4 65-69 5 Class 9 Count 6-4-4 70-74 5 Class 10 Count 6-4-4 75-79 5 Class 11 Count 6-4-4 80-84 5 Class 12 Count 6-4-4 85-89 5 Class 13 Count 6-4-4 The record may end here if the FHWA 13 class system is being used 90-94 5 Class 14 Count 6-4-4 95-99 5 Class 15 Count 6-4-4
Columns No. of
ColumnsDescription TMG Ref
Page1 1 Truck weight record code (7) 5-4-8 2-3 2 State code 5-6-2 4-5 2 Functional Classification 5-6-3 6-8 3 Station Identification Number 5-6-3 9 1 Direction of Travel 5-6-3 10-11 2 Year of Data 5-6-4 12-13 2 Month of Data 5-4-8 14-15 2 Day of Month 5-4-8 16-17 2 Hour of day 5-4-8 18-23 6 Vehicle type code 5-4-8 24-25 2 Body type (optional)* 5-4-10 26 1 Engine type (optional)* 5-4-10 27-28 2 (open) 5-4-10 29-31 3 Registered weight (thousands of pounds) 5-4-10 32 1 Basis of registration 5-4-10 33-34 2 (open) 5-4-10 35 1 Lane of travel 5-4-10 36-40 5 Commodity code (optional)* 5-4-10 41 1 Load status code (optional)* 5-4-10 42-45 4 Total weight of truck or combination 5-4-10 46-48 3 A-axle weight (hundreds of pounds) 5-4-10 49-51 3 B-axle weight (hundreds of pounds) 5-4-10 52-54 3 C-axle weight (hundreds of pounds) 5-4-10 55-57 3 D-axle weight (hundreds of pounds) 5-4-10 58-60 3 E-axle weight (hundreds of pounds) 5-4-10 61-63 3 (A-B) axle spacing (feet and tenths) 5-4-10 64-66 3 (B-C) axle spacing (feet and tenths) 5-4-10 67-69 3 (C-D) axle spacing (feet and tenths) 5-4-10 70-72 3 (D-E) axle spacing (feet and tenths) 5-4-10 73-76 4 Total wheel base 5-4-10 77-79 3 Record serial number (same for continuation record) 5-4-10 80 1 Continuation indicator:
0 = no continuation record
1 = has a continuation record5-6-32
* See next page for table references.Vehicle Type 1st Character 2nd Character 3rd Character 4th Character 5th Character 6th Character Personal passenger vehicles Basic vehicle type = 0 Code = 9 Code = 0 Table A; light trailer modifier Code = 0 Code = 0 Buses Basic vehicle type = 1 Code = 9 Code = 0 Table B; axle & tire modifier Code = 0 Code = 0 Single unit trucks or tractors Basic vehicle type = 2 Table C; total axles Code = 0 Table A; light trailer modifier Code = 0 Code = 0 Tractor + semitrailer Basic vehicle type = 3 Total axles on power unit Table D; total axles on first trailer Code = 0 Code = 0 Code = 0 Tractor + full trailer Basic vehicle type = 4 Total axles on power unit Table D; total axles on first trailer Code = 0 Code = 0 Code = 0 Tractor + semitrailer + full trailer** Basic vehicle type = 5 Total axles on power unit Table D; total axles on first trailer Table D; total axles on second trailer Code = 0 Code = 0 Truck + full trailer + full trailer Basic vehicle type = 6 Total axles on power unit Table D; total axles on first trailer Table D; total axles on second trailer Code = 0 Code = 0 Tractor + semitrailer + 2 full trailers Basic vehicle type = 7 Total axles on power unit Table D; total axles on first trailer Table D; total axles on second trailer Table D; total axles on third trailer Code = 0 Truck + 3 full trailers Basic vehicle type = 8 Total axles on power unit Table D; total axles on first trailer Table D; total axles on second trailer Table D; total axles on third trailer Code = 0
** Semitrailers pulled by other semitrailers will be considered full trailers.
1 = Camp trailer
2 = Travel or mobile home
3 = Cargo or livestock trailer
4 = Boat trailer
5 = Towed equipment
6 = Towed auto
7 = Towed truck
8 = "Saddle mount" (Tractors or trailers with front axles on unit ahead)
Type trailer not determined
9 = Type trailer not determined
1 = Two-axle, four-tire
2 = Two-axle, six-tire
3 = Three-axle
4 = Four or more axles
1 = Heavy two-axle, four-tire
2 = Two-axle, six-tire
3 = Three-axle
4 = Four-axle
5 = Five-axle
6 = Six-axle
7 = Seven-axle
8 = Eight axles or more
2 = Two-axle trailer
3 = Three-axle trailer
4 = Four-axle trailer
5 = Five-axle trailer
6 = Six-axle trailer
7 = Two-axle trailer with axles in a spread tandem configuration
8 = Three-axle trailer with axles in a spread tandem configuration
9 = Four-axle trailer including a spread tandem configuration
Columns No. of Columns Description TMG Ref Page 1-23 23 Same as columns 1-23 of the face record 24-28 5 (open) 29-31 3 F-axle weight (hundreds of pounds) 5-4-10 32-34 3 G-axle weight (hundreds of pounds) 5-4-10 35-37 3 H-axle weight (hundreds of pounds) 5-4-10 38-40 3 I-axle weight (hundreds of pounds) 5-4-10 41-43 3 J-axle weight (hundreds of pounds) 5-4-10 44-46 3 K-axle weight (hundreds of pounds) 5-4-10 47-49 3 L-axle weight (hundreds of pounds) 5-4-10 50-52 3 M-axle weight (hundreds of pounds) 5-4-10 53-55 3 (E-F) axle spacing (feet and tenths) 5-4-10 56-58 3 (F-G) axle spacing (feet and tenths) 5-4-10 59-61 3 (G-H) axle spacing (feet and tenths) 5-4-10 62-64 3 (H-I) axle spacing (feet and tenths) 5-4-10 65-67 3 (I-J) axle spacing (feet and tenths) 5-4-10 68-70 3 (J-K) axle spacing (feet and tenths) 5-4-10 71-73 3 (K-L) axle spacing (feet and tenths) 5-4-10 74-76 3 (L-M) axle spacing (feet and tenths) 5-4-10 77-79 3 Record serial number (same as face record) 5-4-10 80 1 Continuation indicator:
2= first continuation record for a vehicle with more than 13 axles
9=last continuation record5-4-10
Column Width Alpha/
NumericDescription TMG
Ref Pg.1 1 N Station description record code (2) 5-4-1 2-3 2 N State Cod 5-4-1 4-5 2 N Functional classification 5-4-2 6-8 3 A Station identification number 5-4-2 9 1 N Direction of travel 5-4-2 10-11 2 N Year of data 5-4-3 12 1 N Posted route number category 5-4-3 13-17 5 N Posted route number 5-4-3 18-20 3 N County code 5-4-3 21-32 12 N HPMS sample number 5-4-3 33 1 N HPMS sample section subdivision number 5-4-4 34-35 2 N Year station was established 5-4-4 36 1 N Number of lanes in one direction at site 5-4-4 37 1 N Type of weighing equipment 5-4-4 38 1 N Method of classification counting 5-4-4 39 1 N Coordination with enforcement activities 5-4-5 40-45 6 N Most current AADT figure 5-4-5 46-80 35 A Location of station (distance and direction from nearest major intersecting route) 5-4-5
*Axle weights are to nearest tenth of a metric ton (100 kilograms) without a decimal point.Cols. No. of Cols. Description TMG Page 1 1 Truck weight record code (W) 6-5-1 2-3 2 State code 6-2-1 4-9 6 Station Identification Number 6-2-3
10 1 Direction of Travel 6-2-3 11 1 Lane of Travel 6-2-3 12-13 2 Year of Data 6-2-3 14-15 2 Month of Data 6-3-1 16-17 2 Day of Data 6-3-1 18-19 2 Hour of Data 20-21 2 Vehicle Class 6-5-3 22-24 3 Open 6-5-3 25-28 4 Total Weight of Vehicle 6-5-3 29-30 2 Number of Axles 6-5-3 31-33 3 A-axle weight* 34-36 3 (A-B) axle spacing** 37-39 3 B-axle weight* 40-42 3 (B-C) axle spacing** 43-45 3 C-axle weight* 46-48 3 (C-D) axle spacing** 49-51 3 D-axle weight* 52-54 3 (D-E) axle spacing** 55-57 3 E-axle weight* 58-60 3 (E-F) axle spacing ** 61-63 3 F-axle weight * 64-66 3 (F-G) axle spacing** 67-69 3 G-axle weight* 70-72 3 (G-H) axle spacing** 73-75 3 H-axle weight* 76-78 3 (H-I) axle spacing** 79-81 3 I-axle weight* 82-84 3 (I-J) axle spacing** 85-87 3 J-axle weight 88-90 3 (J-K) axle spacing** 91-93 3 K-axle weight* 94-96 3 (K-L) axle spacing** 97-99 3 L-axle weight* 100-102 3 (L-M) axle spacing** 103-105 3 M-axle weight* Additional fields if needed.
** Axle spacings are to the nearest tenth of a meter (100 millimeters) without a decimal point.
2 - Passenger cars
3 - Other 2-axle, 4-tire single unit vehicles
4 - Buses
5 - 2-axle, 6-tire single unit trucks
6 - 3-axle single unit trucks
7 - 4 or more axle single unit trucks
8 - 4 or less axle single trailer trucks
9 - 5-axle single trailer trucks
10 - 6 or more axle single trailer trucks
11 - 5 or less axle multi-trailer trucks
12 - 6-axle multi-trailer trucks
13 - 7 or more axle multi-trailer trucks
(14- unknown or state defined)
(15- unknown)
Column Field
LengthAlpha/
NumericDescription TMG
Ref Pg.1 1 A Record type (must be S) 6-2-1 2-3 2 N FIPS State Code 6-2-1 4-9 6 A Station ID 6-2-3 10 1 N Direction of Travel Code 6-2-3 11 1 N Lane of Travel 6-2-3 12-13 2 N Year of Data 6-2-3 14-15 2 N Functional Classification Code 6-2-4 16 1 N Number of Lanes in Direction Indicated 6-2-4 17 1 A Sample Type for Traffic Volume 6-2-4 18 1 N Number of Lanes Monitored for Traffic Volume 6-2-4 19 1 N Method of Traffic Volume Counting 6-2-4 20 1 A Sample Type for Vehicle Classification 6-2-5 21 1 N Number of Lanes Monitored for Vehicle Classification 6-2-5 22 1 N Method of Vehicle Classification 6-2-5 23 1 A Algorithm for Vehicle Classification 6-2-5 24-25 2 N Classification System for Vehicle Classification 6-2-5 26 1 A Sample Type for Truck Weight 6-2-6 27 1 N Number of Lanes Monitored for Truck Weight 6-2-6 28 1 N Method of Truck Weighing 6-2-6 29 1 A Calibration of Weighing System 6-2-7 30 1 N Method of Data Retrieval 6-2-7 31 1 A Type of Sensor 6-2-7 32 1 A Second Type of Sensor 6-2-8 33-34 2 N Equipment Make 6-2-8 35-49 15 A Equipment Model 6-2-9 50-51 2 N Second Equipment Make 6-2-9 52-66 15 A Second Equipment Model 6-2-9 67-72 6 N Current Directional AADT 6-2-10 73-78 6 A Matching Station ID for Previous Data 6-2-10 79-80 2 N Year Station Established 6-2-10 81-82 2 N Year Station Discontinued 6-2-10 83-85 3 N FIPS County Code 6-2-10 86 1 A HPMS Sample Type 6-2-10 87-98 12 N HPMS Sample Number or Kilometerpoints 6-2-10 99 1 N HPMS Subdivision Number 6-2-10 100 1 N Posted Route Signing 6-2-11 101-108 8 N Posted Signed Route Number 6-2-11 109 1 N Concurrent Route Signing 6-2-11 110-117 8 N Concurrent Signed Route Number 6-2-11 118-167 50 A Station Location 6-2-11
Method of traffic volume counting - 1-3
Sample type for vehicle classification - H, N
Method of vehicle classification - 1-3
Algorithm for vehicle classification - A-H, K-N, Z
Classification system for vehicle - 1-5, 13-15 and others TBD
Sample type for truck weight - B, L, T, N
Method of truck weighing - 1,2,4,5
Calibration of the weighing system - A-D, M, S-U, Z
Method of data retrieval - 1,2
Type of sensor - A-I, K-M, P-X, Z
Equipment make - 0-18, 21, 23, 24, 30-63, 99
HPMS sample type - Y, N
2 - Northeast
3 - East
4 - Southeast
5 - South
6 - Southwest
7 - West
8 - Northwest
Code/Functional Classification
01 - Principal Arterial - Interstate
02 - Principal Arterial - Other or Expressways
06 - Minor Arterial
07 - Major Collector
08 - Minor Collector
09 - Local System
Code/Functional Classification
11 = Principal Arterial - Interstate
12 = Principal Arterial - Other Freeways
14 - Principal Arterial - Other
16 = Minor Arterial
17 = Collector
19 = Local System
0 = combined lanes
1 = outside (rightmost) lane
2 = next to outside lane, ... to 9 = inside lane
Field Length Format Starts in
ColumnL = LANE 1 n 2 LD = LANE DIRECTION 2 nn 4 MO = MONTH 2 nn 7 DD = DAY 2 nn 10 YY = YEAR 2 nn 13 HH = HOUR 2 nn 16 MN = MINUTE 2 nn 19 SS = SECOND 2 nn 22 HS = HUNDREDTHS OF SECONDS 2 nn 25 VEHNUM = VEHICLE NUMBER 6 nnnnnn 28 NA = NUMBER OF AXLES 2 nn 35 CL = CLASS 2 nn 38 GROS = GROSS WEIGHT * 10 4 nnnn 41 LENG = OVERALL LENGTH *10 4 nnnn 46 SPED = SPEED * 10 4 nnnn 51 SP1 = AXLE SPACING 12 * 10 3 nnn 56 SP2 = AXLE SPACING 23 * 10 3 nnn 60 SP3 = AXLE SPACING 34 * 10 3 nnn 64 SP4 = AXLE SPACING 45 * 10 3 nnn 68 SP5 = AXLE SPACING 56 * 10 3 nnn 72 SP6 = AXLE SPACING 67 * 10 3 nnn 76 SP7 = AXLE SPACING 78 * 10 3 nnn 80 SP8 = AXLE SPACING 89 * 10 3 nnn 84 WT1 = WEIGHT OF AXLE 1 * 10 3 nnn 88 WT2 = WEIGHT OF AXLE 2 * 10 3 nnn 92 WT3 = WEIGHT OF AXLE 3 * 10 3 nnn 96 WT4 = WEIGHT OF AXLE 4 * 10 3 nnn 100 WT5 = WEIGHT OF AXLE 5 * 10 3 nnn 104 WT6 = WEIGHT OF AXLE 6 * 10 3 nnn 108 WT7 = WEIGHT OF AXLE 7 * 10 3 nnn 112 WT8 = WEIGHT OF AXLE 8 * 10 3 nnn 116 WT9 = WEIGHT OF AXLE 9 * 10 3 nnn 120
Column Field Length Alpha/ Numeric Description 1 1 N Record Type: 1 = ATR Station 2-3 2 N FIPS State Code 4-5 2 N Functional Classification Code 6-11 6 A Station Identification 12 1 N Direction of Travel 13 1 N Lane of Travel 14 1 N Posted Route Signing 15-20 6 N Posted Signed Route Number 21 1 N Concurrent Route Signing 22-27 6 N Concurrent Signed Route Number 28-30 3 N FIPS County Code 31-42 12 N HPMS Sample Number or Kilometerpoints 43 1 N HPMS Subdivision Number 44-45 2 N Year Station Established 46-47 2 N Year Station Discontinued 48 1 N Method of Data Retrieval 49-50 2 N Equipment Make 51-100 50 A Location of Station Column Field
LengthAlpha/
NumericDescription 1 1 N Record Identification: 3 = ATR data 2-3 2 N FIPS State Code (TMG pg. 5-4-1) 4-5 2 N Functional Classification 6-11 6 N Station Identification Number 12 1 N Direction of Travel (TMG 5-4-2) 13 1 N Mainline Lane of Travel 14-15 2 N Year of Data (last 2 digits) 16-17 2 N Month of Data (01-12) 18-19 2 N Day of Month of Data (01-31) 20 1 N Day of Week (1 = Sunday ...7= Saturday) 21-25 5 N Traffic Volume Counted, 00:01 - 01:00 26-30 5 N Traffic Volume Counted, 01:01 - 02:00 ... " " (hourly traffic volumes counted) 136-140 5 N Traffic Volume Counted, 23:01 - 24:00 141 1 N Footnotes (0 = No restrictions, 1 = Construction or other activity affected traffic flow)
G.1 LTPPFILETRACKER
This table is used to track the loading of files and the steps in the processing. A description of the table appears below. The information in this table is displayed in the File Tracker Module to locate the analysis data and to permit file selection for Plett-Plots. It is used in the Graph Manager to identify data which can be graphed. It stores the number of records and days of data from each file loaded. It also stores the information on the processing steps. The table description is followed by variable definitions.
SQLWKS> desc ltppfiletracker;
FILENAME = The name of the input data file where an underscore replaces the period between the eight character file name and its extension.
STATE_CODE = FIPS state code; incomplete loads/ bad data will be represented by 00.
SHRP_ID = SHRP_ID; incomplete loads/ bad data will be represented by 0000.
VERSION = Which of potentially multiple loads of this data the information in this record represents.
ARCHIVEDIN = The subdirectory where the output file is located including the name of the output file.
STARTDATE = The first date for data exists in the input file. The year is currently reported in two digit format. Invalid loading attempts result in a date of 01-Jan-2025.
ENDDATE = The last date for which data exists in the input file. The year is currently reported in two digit format. Invalid loading attempts result in a date of 01-Jan-2025.
PROCESSED = The date the file was loaded. The year is currently in reported in two digit format. This value is automatically assigned by the software. Invalid loading attempts are characterized by 01-01-2025.
RECORDQC = A 0/1 variable assigned by the software as 1 when the record level QC process is successful.
DAILYQC = A 0/1 variable assigned by the software as 1 when the Daily QC process is successfully completed.
QCREPORT = A 0/1 variable assigned by the software as 0 when the file is loaded. A value of 1 is assigned after the user checks the QC report box in the processing box and applied that change.
COMMENTS = Comments entered in the comments box of the LTPP File Tracker dialog box. The user must apply the comments in order for them to be stored in the table. A maximum of 2000 characters is allowed.
REPORTSENT = A 0/1 variable assigned by the software as 0 when the file is loaded. A value of 1 is assigned after the user checks the 'QC Report Sent' box in the processing box and applies that change.
REPORTRECV = A 0/1 variable assigned by the software as 0 when the file is loaded. A value of 1 is assigned after the user checks the 'Report Received' box in the processing box and applies that change.
PURGESAPPLIED = A 0/1 variable assigned by the software as 0 when the file is loaded. A value of 1 is assigned after the user applies a purge.
FILETYPE = A label indicating what the original file type was, 4-card, 7-card, C-card or W-card.
DAYS = The number of days of data in the file including any with errors.
RECORDS = The number of records in the file including any with errors. Continuation cards are not included in the count.
LTPPD4 tables contain a record for every day of AVC data provided for all years. There is one such file for each site. The naming convention is LTPPD4xxxxxx where xxxxxx is the STATE_CODE and SHRP_ID for the site. The table structure is as follows.
SQLWKS> desc ltppd4xxxxxx;
Note that the table does not have any fields with non-null requirements. Thus there is the potential for duplicate records based on DIRECTION, YEAR, MONTH, DAY, HOUR, and LANE particularly when the data is split across two data files. FILENAME is the name of the input file. HOUR represents the first hour of the day found in the file. All other elements except PURGE are read and summed or assigned using summary.dat file created from classification records. ERROR is the code for any error encountered in a DAY's records. The error may be record level or daily in nature. Only records with non-critical errors (EDIT_1 codes other than C or Q) are included in the summarization. There must be 24 hours in a day to create a record in the table. PURGE is a 0/1 field indicating if that day's data has been purged so that it will be omitted from the analysis. Zero is not purged. One is purged. Purges are applied at the daily level by design. Data beyond column 51 on 4-cards is found in VOLUME14-VOLUME20 as applicable.
At least one calendar day of good data must exist for this table to exist for a site.
LTPPVOL7 tables are the WIM record equivalent of the LTPPD* tables. Unlike the LTPPD* tables they are yearly rather than for the site as a whole. The table naming convention is LTPPVOL7yyyyxxxxxx where yyyy is the 4-digit year and xxxxxx is the STATE_CODE, SHRP_ID combination for the site. These tables contain a summary of the volumes by vehicle class for a given MONTH, DAY, LANE, and DIRECTION. They have no non-null fields. Since weight data may be collected in two different files for the same day, there is the potential for duplicate records. FILENAME is exactly that. CNT1- CNT20 reflect the number of vehicles in each of the 20 bins possible. Generally, for U.S. data the count values should be 1-15 to reflect use of the 13-bin FHWA system with 15 representing vehicles tagged as invalid. There is a one to one correspondence between the number in the field name and the bin number. This table does not have ERROR characteristics in it. Records with critical errors as identified by EDIT_1 codes on the output files are excluded from counts in this table. A description of the table appears below.
SQLWKS> desc ltppvol7yyyyxxxxxx;
The LTPPGVW tables store gross vehicle weight distributions for a given year at a site for each vehicle class on a monthly basis by lane. The table is described below. The table naming convention is LTPPGVWyyyyxxxxxx where yyyy is the 4 digit year and xxxxxx is the STATE_CODE, SHRP_ID combination for the site. An input file for each set of weight distributions is identified in the table If more than one file has data for a month, the last file loaded will show in FILENAME. There will be duplicate records for a month if the data is split across two or more weight files. Each bin covers a 4 kip interval with a maximum vehicle weight of 204,000 pounds. There is no provision for including PURGE or ERROR characteristics in this file. If purges are applied to a weight file, this table is not updated. Records with critical errors as identified by EDIT_1 codes on the output files are not included in these numbers.
SQLWKS> desc ltppgvwyyyyxxxxxx;
LTPPRC tables are used to stored erroneous classification records for a specific input file. A table is created even if there are no errors in the file. The naming convention is LTPPRCxxxxxx_ext_v where xxxxxx is the combination of STATE_CODE, SHRP_ID. Ext is the extension for the input file and v is the version counter for loading the data into the database. A full day's records will be stored when the error is the result of a 24 hour interval evaluation such as 1 a.m. > 1 p.m. volumes. A partial day's records will be stored when more or less than 24 hours of data are found for a file. Inspection of the error tables for consecutively labeled data files may be used in conjunction with the appropriate LTPPD* file to determine if a complete day's worth of data has been split across two files. FILENAME is null since the source file is identified in the file name. FUNC_CLASS is functional classification. Although there are no non-null fields, there should be no duplicate records in this table if the source file was correctly prepared. A duplicate for DIRECTION, DAY, HOUR and LANE may occur when clocks are turned back for daylight saving's time. All other fields but ERROR and PURGE are read directly from the summary.dat file for the classification files. ERROR uses the same codes as the LTPPD file. PURGE is 0 (keep the data) or 1 (eliminate the data) depending on whether or not it is to be used in further calculations. The table structure is shown below.
SQLWKS> desc ltpprcxxxxxx_ext_v;
The LTPPRW table serves the same function for weight files as the LTPPRC table serves for classification files, storage of erroneous records. A description of the table is shown below. The naming convention is LTPPRWxxxxxx_ext_v is nearly identical to that for LTPPRC tables. Unlike the LTPPRC tables there is no FILENAME field. All other elements are read directly from the summary.dat file except for PURGE. The list of possible errors for a weight file is different from those for a classification file. PURGE is 0/1 valued. Zero is for a record that has not been removed. One is for a record that has been removed. The PURGE information does not reflect the coding in the processed data file for critical errors with EDIT_1 codes of C. If a record has a continuation card, the information from both records is included in a single record in this table.
SQLWKS> desc ltpprwxxxxxx_ext_v;
The LTPPERRORCOUNT table is a working table used for accumulating data in the preparation of the QC cover sheet. It is empty otherwise.
SQLWKS> desc ltpperrorcount;
G.8 Codes for ERROR in ORACLE tables
The following are the reasons associated with a value of ERROR in the traffic QC software ORACLE tables.
G.9 Statistics Possible Using ORACLE Tables
The following statistics can be created for sites where all data for a given year has been processed through the new software.
H. Processing Resubmitted Raw Data
There are three basic cases under which a data resubmission occurs. In the first instance, data submitted was submitted in 1999 or later and processed only with the new software and a determination is made somewhere in the QC process that the information is in error. The second case is where, for whatever reason, a decision is made to reduce the data processing by handling the LTPP lane only. The third is the result of an in depth data review which calls into question data received and processed prior to 2000. In this instance the new software has no record of previous submissions in the current directory structure. Each case must be treated differently.
H.1 Data processed only by the NT software
A multi-step process must be used to eliminate all information which might confuse the QC process. However, not all data will be removed during this process in order to retain the data trail. A record will be retained in the ORACLE table that the data was loaded and subsequently modified substantially at the raw data file level. The steps are as follows:
Note that the record pertaining to the original loading of this data file and the error file associated with it are NOT being removed.
H.2 Going from all lanes to LTPP lane only
The software will permit loading of all lanes or only the LTPP lane. If it is decided to change already processed files from all lanes and to only the LTPP lane, the only way to clean up the traces is to treat the condition as a resubmittal of data and use the instructions of the section above.
H.3 Data not previously processed by the NT software
If one or more files processed by the old software is replaced, all files of that type or none of the remainder need to be processed through the new QC software. If a QC packet from the QC software is desired then all files of the type must be processed through the new QC software. If a QC packet from the traffic analysis software is satisfactory, then the replaced file should be processed through the QC software and all remaining files processed according to LTPP traffic analysis software instructions.
I. Data Evaluation and Error Identification
There are several steps is evaluating inputs. The first is verification that the file will load. Some of the checks at that step are identified in section I.5. The actual evaluation of data is done on the 4-card and 7-card versions of records. This means that error checking on data in c-card and w-card formats will not catch errors such as alphas in numeric fields or duplication of data within a record line in these formats. Error checking may not catch data duplication within a line for 4-card or 7-card records either. Within a record error checking is for rational rather than "correct" values. Thus there is limited logic to verify that a 6-digit truck identifier actually represents a truck vehicle. Additionally, there is no checking currently being done to verify that the number of axles and spaces is consistent with each other and with the identified vehicle class.
The logic for checking errors is such that the first error found is the error identified with the record. In loading files, several attempts may need to be made to eliminate all problems preventing file loading.
Several of the following sub-sections list the allowable ranges, the valid values, the severity of an error and the error number or flag associated with it. The allowable ranges (Min, Max) are those of the original software. The Valid Data is what the current version of the software expects for critical elements. Where there is no difference between the two ranges groups, Valid Data is blank. Severity of an error indicates whether the data from the record should be included in the summaries found in the LTPPD4*, LTPPVOL7* and LTPPGVW* tables. All critical errors are omitted from the summaries. All records with errors are included in the LTPPR* tables and the record counts for LTPPFILETRACKER. Error numbers are used in the LTPPR* tables to identify why the record was rejected. Flags are used to attach reasons to output data files. The flags and the error numbers should match.
I.1 Card 4 Range Check Parameters
The state codes identified are all of those which actually could be encountered by the LTPP program for the states and provinces.
The functional class values represent the systems on which LTPP data is collected. LTPP does not expect data from local streets.
The value of 10 and 11 is used to differentiate between the 4-card and the c-card formats (and 7-card and w-card formats) on loading. The values in the relevant columns are mutually exclusive. For 4- and 7-card the allowable value are 00-09 and 89-99 for C-and W-card the allowable values are 10-88. The C-/W-card limits will permit loading of data collected in 0, the code for all lanes. However, this value of lane will be flagged as a critical and the record omitted from processing for annual estimates. For data submitted on a two-lane roadway, where the code for lane is 0, it is strongly recommended that subject to verification of this condition that a copy of original data file be modified and loaded with lane=1. That change, if made, MUST be entered in LTPPFILETRACKER comments and the PURGE file for that site even if no purges are made.
The software makes no provision for verifying that the maximum number of days in a month represents the maximum number possible.
I.2 Card 7 Range Check Parameters
The comments made on the various data elements for 4-card checks also apply to 7-card data. It is particularly important to note the restriction on the value of lane. The range data checking allows for 3 records to describe a truck. This is a truck with 14 or more axles. However, the software does not make any provision for a truck with more than 13 axles worth of data to write out error records. These records will be handled as follows:
A valid vehicle classification can be (and is) determined without use of DEFSHT.dat. For the 6-digit case to completely process two items of information are needed: the value of each position in the classification and the number of axles calculated on the basis of the values in each position for groups 3-8 only.
090001-090900: if the 3rd, 5th and 6th digits = 0, vehicle_class = 2; otherwise vehicle_class=15.
Additionally, the total wheel base and the gross vehicle weight are checked to verify that the sum of the individual inputs is with 15 percent of the respective totals.
I.3 Continuation card 7 range check parameters
The range checks on a continuation card are the same as for a face card. The sole difference is the allowable values for the continuation field.
Each record processed through the QC process will have a two character edit code appended to it. This code indicates to the analysis software whether or not the record is to be included in summary statistics. The first character indicates the severity of the error. Table I.1 shows the possible values for the first character.
Table 5-8 Edit_1 Codes
The second character identifies the problem with the record. Table I.2 shows the possible values of the second character. Only one error can be reported per record. Error codes r-z, &, #, ^, ~, |, >, < and ? are associated with purging data.
Table 5-9 Edit_2 Codes
Second Edit:
The following rules are incorporated in the QC software with respect to accepting files for loading and processing. A failure results in a file that doesn't load. The advantage of stopping the loading process is that none of the output files or ORACLE tables will exist. The file can be edited and reloaded. The version number will increase but that has no impact on the rest of the processing.
The following individual record errors will stop loading. the line number of the failure will appear in the log.
J.1 Log File Names and Location
Log files for the TRF QC software are written to the LOGS subdirectory. The LOGS subdirectory is located as a first tier subdirectory in the user's preferred directory (PREFS). It has a subdirectory for each year that processing occurs. Within that subdirectory are stored all of the log files. The naming convention for log files is YYMMDDLX.log where X is the level of processing. 4 is for QC processing, 3 for creation of daily summaries, 2 for annual summaries by vehicle class and 1 for annual summaries combining all classes. YYMMDD refers to the day the log was created. Log files are appended, not overwritten with each successive batch of files loaded on a given day. The log file is tab delimited ASCII.
The log file reports the success or failure of loading a data file. A failed attempt to load a file will be include the reason. For each batch of files loaded the number of successfully and unsuccessfully loaded will be summarized at the end of the file list.
Note: A file that fails to load or process completely may show up in LTPP File Tracker with state XX since if was entered in LTPPFILETRACKER (See section G.1 for a description of this table.) with STATE_CODE 00. It will have a processed date of 01/01/2025. Another outcome may be the creation of the directory NoRegion in the user specified directory with state = XX, site = 001000 and year = 0.
If a record is not found in the SHRP.DAT file for a given site, the file will not load. The subdirectories will be created if the state in the file name is valid but the SHRP ID is not.
A message - "Failed to create directory path for index files" will appear if an invalid state code is used. That message will be followed by the same SHRP.DAT message.
A case of no errors captured and no file loaded (Load failed) indicates that the attempt to create directories, write index files, summary.dat files or output files failed. Verify preferences and the amount of space in the output directory before proceeding.
A case of no record in the output log of any type without the program aborting implies that more files were included in the list for loading then the software could handle. The maximum is approximately 70 depending on the path length.
Below are listed the various warning and error messages that will be printed into the raw data QC process log file:
File name inconsistent with file type - The first character of the file name and the record type in the file are inconsistent.
Input file contains no loadable data matching criteria - The loading is being done with LTPP Lane only selected and the lane or direction in the file does not match the lane and or direction for the LTPP section in the SHRP.DAT file.
Record format does not appear valid OR Record format does not appear valid for a 3-card (4-card, 7-card, C-card, W-card) - In each case the data in columns 11 and 12 does not match the expected values. For 3-, 4- and 7-cards this is 00-09, 89-99. For C-and W-cards this is 10-88.
Input data lines must begin with a (4, 7, C, W) - In each case a record begins with a character that does not match the rest in the file. This includes spaces and line feed characters which produce blank last lines.
State value does not match file content - The state in the name and the state in the first record in the file must be the same. This message will also appear when an attempt is made to load a HELP file.
Attempt to load invalid data file - The data file matches no recognized record type.
Too many station ID cards - More than eight 2-cards at the beginning of the file.
Input contains station ID card only - no loadable data - The file consists of a 2-card (possibly part of an HPMS submission).
Error encountered during database processing - Processing of the summary.dat records to create the ORACLE tables could not be completed for any one of a number of reasons.
Input data line, invalid length line # - A 4-card or C-card with a length not matching that of the first record or a 7-card with other than 80 characters was encountered. Edit or remove the line and reload the file.
3-cards currently not supported - An attempt was made to load a file with 3 cards.
Record format does not appear valid - A validation check failed on the record type somewhere after the first record in the file. See the record specific error message above for review criteria.
Failed to find FUNCLASS.DAT for metric conversion. - The file is missing from the DAT directory and the file will not load. This message is relevant to C-card and W-card files only.
Attempt to store a day of volumes not found in volume array - a value for day larger than allowed by the program has been encountered.
Error splicing summary.dat - The input file contains an invalid date, probably a month. Check for summary.tmp file.
Card file is no longer available for loading. - Data set was selected for loading but user tried to select files in more than one directory. Only files from the last directory selected will load.
Failed to Locate DEFSHT.DAT information. Load succeeded.
Failed to Locate NEWSHT.DAT information. Load succeeded. - The files will be completely processed in either case except that the index file will not be created properly. This is a non-fatal error. K. LTPP QC Program Error Descriptions
A variety of error messages can appear that are specific the use of the LTPP QC software, in addition to error messages that may be produced by ORACLE or Microsoft Windows TM. The following is a list of error messages and descriptions of the problem at hand.
Current software does not support 3-cards which provide information only on total volumes by hour. This is required only if reprocessing of pre-1999 data is required or it is determined there are sufficient sites with continuous ATR data and sampled AVC to make it worth providing additional information for the analysis software.
This is a capability lost on conversion. HELP files are thought to have been used only by the Canadian provinces. They are a truck weight record format. This is needed either if new data is received in this format or pre-1999 data must be processed.
L.3 SHRP.DAT as an ORACLE table
Much of the data in SHRP.DAT is redundant due to existence of the information in the IMS. It needs to be determined which items of information are essential to the processing software and which can be eliminated. Of those that are essential, a determination must then be made as to which are unique to the traffic software's needs and which exist in other parts of the database. Finally a table to hold all of the site constants needs to be developed.
Duplicate data:
Unique data:
This is a site specific equipment and data collection format table. It is currently maintained using a text editor. Putting it into ORACLE would make maintenance of the table easier. It could also be derived in part from Traffic Sheet 14 and Sheet 15 information which is not yet being considered for inclusion in the IMS.
Creation of this file as ASCII text requires opening and reading the first and last record of each file when transmittal sheets are not received with the data. It needs to be determined what the information in the file is used for other than putting starting and ending dates and times in the transmittal sheet files. If that is the sole purpose, then modification of the software to get this information while reading the first and last data record (not station identification card) should be considered. Since the user currently selects the files to be loaded, this file serves no purpose in that function. The information in NEWSHT can be derived from tables developed by the QC software if need for analysis.
L.6 Transmittal sheets (*.inx file) in ORACLE
The transmittal sheets are currently stored in a single binary file for the site. The records are written in the order the files are read by the QC software. However, the analysis file expects them to be in sorted data order and possible in a type order as well. This file can be eliminated from the process by the direct use of DEFSHT.DAT, SHRP.DAT and LTPPFILETRACKER>
L.7 Processed raw data files in ORACLE
Currently processed raw data files are written back out into ASCII files as 4-card or 7-card files whose data matches the raw input files as if they were originally 4-card or 7-card files. Writing these files out in an ORACLE table would make them more accessible to users and easier to query and manipulate. It would also make it possible to check for duplicates on loading data.
The file has currently been revised to report only loading activity whether or not it is successful. All statistics previously included may be generated using SQL and the various LTPPR* tables.
L.9 Consolidate GVW tables to one per site
The software currently produces one ORACLE table per year per site with GVW information. This table is used for graphing purposes. Consideration should be given to reducing the number of tables and being able to manipulate the GVW data without having to locate multiple files for a site.
L.10 Consolidate VOL7 files to one per site
The software currently produces one ORACLE table per year per site with VOL7 information. This table is used for graphing purposes. Consideration should be given to reducing the number of tables and being able to manipulate the VOL7 data without having to locate multiple files for a site.
Currently every time a file is read it generates a new ORACLE table for error storage whether or not any errors exist. This creates large numbers of files used for little but indicating that the processing has been accomplished.. It would be worth investigating the implications of reducing the error tables to three per site (1-WIM, 1-AVC, 1-VOL) or even three per site per year.
L.12 Create a duplicate checking process
Incorporate a duplicate checking process prior to the analysis software. This can be incorporated with the conversion of all files to indexed ORACLE tables.
The software currently requires data be sorted in a specific order and that all records be valid for the file type. A pre-processor would do a pre-loading clean-up. It might be just as much or even less effort to change the software function to skip records which were inconsistent with type (too long or too short) and handle the data without having it in sorted order. This can be avoided entirely by loading the inputs into an indexed ORACLE table.
Another thing that would be useful is the ability of some software tool to open read and then rename files as received from highway agencies. This would save staff enormous amounts of time and make it easier to acquire data in a timely fashion. This might be worth development independently of any QC software refinements. Alternative a module could be added that would, on encountering an invalid file name, create the output file name from file content and the use of SHRP.DAT information, specifically ID3 and ID6.
The software has limited capability to read files with 2-cards (7-card files only). It would help reduce the amount of pre-processing if 2-cards could be header records on 4-card files. Similarly, the ability to use S-cards as header lines for C-cards and W-cards would be useful. This is a medium priority activity to reduce the amount of preprocessing required. This would be useful for product development purposes.
A very, very low priority associated with processing 3-cards (volume records) would be including 1-cards (the station ID card for this record type) as possible headers for those files.
L.15 Alpha characters in SHRP_ID
The file naming convention is rigid even for LTPP. As currently coded the software only permits an alphabetic character in the first position of SHRP_ID. Having any character in that variable be alphabetical would improve product possibilities.
The software currently will not load files with extra CR/LF characters at the end of the file (with or without leading blanks). It would help if the software would ignore such lines as valid but data free records.
Add an appendix to the QC manual on clear and fuzzy cases for applying purges beyond the information in section particularly as regards the SPS data collection locations.. In addition, purge conditions for the SPS sites must be described and additional codes added on an as needed basis.
The ERROR information in the ORACLE tables currently reflects the QC process. The PURGE reason is not present. Changing either the PURGE value to a number code for PURGE reason or modifying the value of ERROR for purged data would eliminate the need to look at PURGE files.
Another possibility is to consider putting the PURGE files in ORACLE with the capability of undoing PURGES being added concurrently.
There are three types of transmittal sheets: volume, classification, and weight. They are referred to as sheets 11, 12 and 13 respectively due to their numbering in the LTPP Traffic Data Collection Guide. A transmittal sheet is submitted for every data file sent by an agency. It comes in hard copy. Data is extracted from it to create or modify the various *.dat files used by the QC software.
When data is read into the QC software an electronic version of the transmittal sheet is created. There is one per file read. All transmittal sheets for a file go into a single binary file with the name xxxxxx5.inx where xxxxxx represents STATE_CODE, SHRP_ID for the site. The file is composed of three types of records of varying lengths and composition. The single variable they all have in common is the first one, referred to as SheetNum which creates the unique key for a record within a file.
The SheetNum field in the three sheets is used for accessing data within the .inx file. It is built as follows by column:
Sheet 12 is used with classification data.
Sheet 13 is used with weight data.
Sheet 11 is included even though the QC Software currently only addresses Sheets 12 and 13.
Column Name Null? Type FILENAME VARCHAR2(32) STATE_CODE NUMBER SHRP_ID CHAR(4) VERSION VARCHAR2(4) ARCHIVEDIN VARCHAR2(512) STARTDATE DATE ENDDATE DATE PROCESSED DATE RECORDQC NUMBER DAILYQC NUMBER QCREPORT NUMBER COMMENTS VARCHAR2(2000) REPORTSENT NUMBER REPORTRECV NUMBER PURGESAPPLIED NUMBER FILETYPE VARCHAR2(32) DAYS NUMBER RECORDS NUMBER Column Name Null? Type FILENAME VARCHAR2(32) STATE_CODE NUMBER FUNC_CLASS NUMBER STATION VARCHAR2(6) DIRECTION NUMBER YEAR NUMBER MONTH NUMBER DAY NUMBER HOUR NUMBER LANE NUMBER ERROR NUMBER PURGE NUMBER VOLUME1 NUMBER VOLUME2 NUMBER VOLUME3 NUMBER VOLUME4 NUMBER VOLUME5 NUMBER VOLUME6 NUMBER VOLUME7 NUMBER VOLUME8 NUMBER VOLUME9 NUMBER VOLUME10 NUMBER VOLUME11 NUMBER VOLUME12 NUMBER VOLUME13 NUMBER VOLUME14 NUMBER VOLUME15 NUMBER VOLUME16 NUMBER VOLUME17 NUMBER VOLUME18 NUMBER VOLUME19 NUMBER VOLUME20 NUMBER Column Name Null? Type FILENAME VARCHAR2(32) MONTH NUMBER DAY NUMBER LANE NUMBER DIRECTION NUMBER PURGE NUMBER CNT1 NUMBER CNT2 NUMBER CNT3 NUMBER CNT4 NUMBER CNT5 NUMBER CNT6 NUMBER CNT7 NUMBER CNT8 NUMBER CNT9 NUMBER CNT10 NUMBER CNT11 NUMBER CNT12 NUMBER CNT13 NUMBER CNT14 NUMBER CNT15 NUMBER CNT16 NUMBER CNT17 NUMBER CNT18 NUMBER CNT19 NUMBER CNT20 NUMBER
Column Name Null? Type
FILENAME VARCHAR2(32) MONTH NUMBER LANE NUMBER DIRECTION NUMBER VEHICLE_CLASS NUMBER BIN1 NUMBER BIN2 NUMBER BIN3 NUMBER BIN4 NUMBER BIN5 NUMBER BIN6 NUMBER BIN7 NUMBER BIN8 NUMBER BIN9 NUMBER BIN10 NUMBER BIN11 NUMBER BIN12 NUMBER BIN13 NUMBER BIN14 NUMBER BIN15 NUMBER BIN16 NUMBER BIN17 NUMBER BIN18 NUMBER BIN19 NUMBER BIN20 NUMBER BIN21 NUMBER BIN22 NUMBER BIN23 NUMBER BIN24 NUMBER BIN25 NUMBER BIN26 NUMBER BIN27 NUMBER BIN28 NUMBER BIN29 NUMBER BIN30 NUMBER BIN31 NUMBER BIN32 NUMBER BIN33 NUMBER BIN34 NUMBER BIN35 NUMBER BIN36 NUMBER BIN37 NUMBER BIN38 NUMBER BIN39 NUMBER BIN40 NUMBER BIN41 NUMBER BIN42 NUMBER BIN43 NUMBER BIN44 NUMBER BIN45 NUMBER BIN46 NUMBER BIN47 NUMBER BIN48 NUMBER BIN49 NUMBER BIN50 NUMBER
Column Name Null? Type FILENAME VARCHAR2(32) STATE_CODE NUMBER FUNC_CLASS NUMBER STATION VARCHAR2(6) DIRECTION NUMBER YEAR NUMBER MONTH NUMBER DAY NUMBER HOUR NUMBER LANE NUMBER ERROR NUMBER PURGE NUMBER VOLUME1 NUMBER VOLUME2 NUMBER VOLUME3 NUMBER VOLUME4 NUMBER VOLUME5 NUMBER VOLUME6 NUMBER VOLUME7 NUMBER VOLUME8 NUMBER VOLUME9 NUMBER VOLUME10 NUMBER VOLUME11 NUMBER VOLUME12 NUMBER VOLUME13 NUMBER VOLUME14 NUMBER VOLUME15 NUMBER VOLUME16 NUMBER VOLUME17 NUMBER VOLUME18 NUMBER VOLUME19 NUMBER VOLUME20 NUMBER
Column Name Null? Type STATE_CODE NUMBER FUNC_CLASS NUMBER STATION VARCHAR2(6) DIRECTION NUMBER YEAR NUMBER MONTH NUMBER DAY NUMBER HOUR NUMBER ERROR NUMBER VEHICLE_CLASS NUMBER BTYPE NUMBER ETYPE NUMBER REGWEIGHT NUMBER BREG NUMBER LANE NUMBER COMMOD NUMBER LOAD NUMBER TOTWEIGHT NUMBER TOTWHEEL NUMBER SERIAL NUMBER PURGE NUMBER WEIGHT_A NUMBER WEIGHT_B NUMBER WEIGHT_C NUMBER WEIGHT_D NUMBER WEIGHT_E NUMBER WEIGHT_F NUMBER WEIGHT_G NUMBER WEIGHT_H NUMBER WEIGHT_I NUMBER WEIGHT_J NUMBER WEIGHT_K NUMBER WEIGHT_L NUMBER WEIGHT_M NUMBER SPACE_AB NUMBER SPACE_BC NUMBER SPACE_CD NUMBER SPACE_DE NUMBER SPACE_EF NUMBER SPACE_FG NUMBER SPACE_GH NUMBER SPACE_HI NUMBER SPACE_IJ NUMBER SPACE_JK NUMBER SPACE_KL NUMBER SPACE_LM NUMBER
Column Name Null? Type ERROR NOT NULL NUMBER LANE NOT NULL NUMBER DIRECTION NOT NULL NUMBER MONTH NOT NULL NUMBER DAY NOT NULL NUMBER
REASON CODE EDITFLAG_OK 0 BAD_CARDTYPE 1 BAD_ID6 2 BAD_ID3 3 CONSECHEADERRECS 4 BAD_DAY 5 BAD_WEEKDAY 6 BAD_STATE 7 BAD_STATION 8 BAD_FUNC 9 BAD_VEHTYPE 10 BAD_TOTWTSUB 11 BAD_TOTWHEELSUB 12 BAD_WEIGHT 13 BAD_SPACE 14 BAD_LANE 15 BAD_SERIAL 16 BAD_CONT 17 BAD_VOLUME 18 BAD_METHOD 19 BAD_ATR 20 BAD_ROUTE 21 BAD_SITE 22 BAD_EQUIP 23 BAD_COUNTMETHOD 24 BAD_ENFORCEMETHO 25 BAD_OPTCLASS 26 BAD_HOUR 27 BAD_BODYTYPE 28 BAD_ENGINETYPE 29 BAD_COMMODITY 30 BAD_MCYCLERPT 31 BAD_REGWEIGHT 32 BAD_BASISREG 33 BAD_LOADSTATUS 34 BAD_VEHCOMBO 35 BAD_MINUTE 36 BAD_SECOND 37 BAD_HUNDRETH 38 BAD_NUMAXLES 39 BAD_RECORDLEN 40 BAD_DATESEQ 41 BAD_ALLWEIGHTS 42 BAD_ALLSPACES 43 BAD_DIRECTION 44 BAD_TOTALWGT 45 BAD_TOTALSPACE 46 BAD_ROUTECAT 47 BAD_COUNTY 48 BAD_HPMS 49 BAD_AADT 50 BAD_FOOTNOTE 51 BAD_YRESTAB 52 BAD_YRDISC 53 BAD_YEAR 54 BAD_NUMAX 55 BAD_TIME 56 BAD_SPEED 57 BAD_MONTH 58 BAD_DATE 59 CONSEC_ZERO_VOLS 60 CONSEC_STATIC_VOLS 61 ONE_AM_ONE_PM 62 MISSING_HOUR_VOL 63
'input file' was replaced on 'DATE'. The AVC4 summary.dat files for yyyy for the months of mmm, mmm... were erased. The summary.dat files for yyyy for the months of mmm, mmm ... were modified. 'output file' was erased. Changes to the LTPPD* table were made using Dextmm-dd-yyyy.sql
OR
'input file' was replaced on 'DATE'. The WIM7 summary.dat files for yyyy for the months of mmm, mmm... were erased. The summary.dat files for yyyy for the months of mmm, mmm ... were modified. 'output file' was erased. Changes to the LTPPVOL7 table and LTPPGVW table where made using Vext-mm-dd-yyyy.sql and Gext-mm-dd-yyyy.sql.
Field Min Max Valid Data Field Type Severity Flag Error CARD TYPE 4 4 4 Numeric Critical A 1 STATE 1 90 1,2,4-6,8-56,
72,81-90Numeric Critical G 7 FUNC CLASS 0 99 1,2,6,7,8,11,
12,14,16,17 Numeric Non Critical I 9 STATION 0 999 alphanumeric Alpha Non Critical C 3 DIRECTION 1 8 1-8 Numeric Critical 0 44 YEAR 0 99 89-07 Numeric Critical ! 54 MONTH 1 12 Numeric Critical $ 58 DAY 1 31 Numeric Critical . 5 HOUR 0 24 0-23 Numeric Critical a 27 CLASS 1 0 99 Numeric Critical R 18 CLASS 2 0 9999 Numeric Critical R 18 CLASS 3 0 999 Numeric Critical R 18 CLASS 4 0 99 Numeric Critical R 18 CLASS 5 0 999 Numeric Critical R 18 CLASS 6 0 99 Numeric Critical R 18 CLASS 7 0 99 Numeric Critical R 18 CLASS 8 0 99 Numeric Critical R 18 CLASS 9 0 999 Numeric Critical R 18 CLASS 10 0 99 Numeric Critical R 18 CLASS 11 0 99 Numeric Critical R 18 CLASS 12 0 99 Numeric Critical R 18 CLASS 13 0 99 Numeric Critical R 18 MCYCL RPT 0 1 Numeric Non Critical e 31 VEH COMBO 0 1 Numeric Non Critical i 35 LANE 0 9 1-8 Numeric Critical O 15 CLASS 14 0 99 Alpha Critical R 18 CLASS 15 0 99 Alpha Critical R 18 CLASS 16 0 99 Alpha Critical R 18 CLASS 17 0 99 Alpha Critical R 18 CLASS 18 0 99 Alpha Critical R 18 CLASS 19 0 99 Alpha Critical R 18 CLASS 20 0 99 Alpha Critical R 18
A somewhat more rigorous check on the 6-digit classification is made than is used in both the previous versions of this software and the VTRIS software. The checks can be summarized as shown below:
090901-099999: vehicle_class = 15.
100000-150000: if the 4th, 5th and 6th digits=0, vehicle_class is two left digits; otherwise vehicle_class=15.
150001-189999: vehicle_class=15.
190000-190400: if the 3rd, 5th and 6th digits = 0, vehicle_class = 4; otherwise vehicle_class=15.
190401-199999: vehicle_class = 15.
200000-280900: if the 3rd, 5th and 6th digits = 0
If the 2nd digit = 0 or 1, vehicle_class = 3
260901-320999: vehicle_class = 15.
If the 2nd digit = 2, vehicle_class = 5
If the 2nd digit = 3, vehicle_class = 6
if 4 <= 2nd digit<= 8, vehicle_class = 7
otherwise vehicle_class = 15.
321000-349000: if the 4th, 5th and 6th digits = 0 the number of axles must be computed (numaxles) otherwise the numaxles is set to 20;
if 3 <= numaxles <5, vehicle_class = 8
349001-421999: vehicle_class = 15.
if numaxles = 5, vehicle_class = 9
if 5< numaxles <11, vehicle_class = 10.
In any other case vehicle_class = 15.
422000-449000: same as 321000-349000 except that minimum number of axles for vehicle_class 8 = 4 not 3.
449001-521099: vehicle_class = 15.
521100-549900: if the 5th and 6th digit = 0, the number of axles must be computed (numaxles) otherwise the numaxles is set to 20;
if numaxles = 5, vehicle_class = 11
549901-622199: vehicle_class = 15
if numaxles = 6, vehicle_class = 12
if 6 < numaxles < 13, vehicle_class = 13
In any other case vehicle_class = 15.
622200-649900: same as 521100-549900 except the numaxles = 5 is not a possibility.
649901-721219: vehicle_class = 15
721220-749990: if the 6th digit = 0, the number of axles must be computed (numaxles) otherwise the numaxles is set to 20;
if 7 <= numaxles <16, vehicle_class = 13
749991-822219: vehicle_class = 15
In any other case vehicle_class = 15.
822220-849990: same as 721220-749990 except the minimum number of axles is 8.
Field Min Max Valid Data Field Type Severity Flag Error CARD TYPE 7 7 Numeric Critical A 1 STATE 1 90 1,2,4-6,8-56,
72,81-90Numeric Critical G 7 FUNC CLASS 0 99 1,2,6,7,8,11
12,14,16,17 Numeric Non Critical I 9 STATION 0 999 alpha char Alpha Non Critical C 3 DIRECTION 0 9 1-8 Numeric Critical 0 44 YEAR 0 99 89-07 Numeric Critical ! 54 MONTH 1 12 Numeric Critical $ 58 DAY 1 31 Numeric Critical . 5 HOUR 0 24 0-23 Numeric Critical a 27 VEH TYPE 1 849990 see note Numeric Critical J 10 BODY TYPE 0 99 Numeric Non Critical b 28 ENGINE TYPE 0 9 Numeric Non Critical c 29 REG WEIGHT 0 999 Numeric Non Critical f 32 BASIS OF REG 0 9 Numeric Non Critical g 33 LANE 0 9 1-8 Numeric Critical O 15 COMMODITY 0 99999 Numeric Non Critical d 30 LOAD STATUS 0 9 Numeric Non Critical h 34 TOT WEIGHT 0 9999 Numeric Critical f 45 WEIGHT A 1 400 10-400 Numeric Critical M 13 WEIGHT B 1 400 10-400 Numeric Critical M 13 WEIGHT C 0 400 Numeric Critical M 13 WEIGHT D 0 400 Numeric Critical M 13 WEIGHT E 0 400 Numeric Critical M 13 SPACE A-B 0 450 0, 19-450 Numeric Critical N 14 SPACE B-C 0 450 0, 19-450 Numeric Critical N 14 SPACE C-D 0 450 0, 19-450 Numeric Critical N 14 SPACE D-E 0 450 0, 19-450 Numeric Critical N 14 WHEEL BASE 0 8900 Numeric Critical Z 46 SERIAL 0 999 1-999 Numeric Non Critical P 16 CONTIN. 0 9 0,1,(2,9) Numeric Critical Q 17
Field Min Max Valid Data Field Type Severity Flag Error CARD TYPE 7 7 Numeric Critical A 1 STATE 1 90 1,2,4-6,8-56,
72,81-90Numeric Critical G 7 FUNC CLASS 0 99 1,2,6,7,8,11,
12,14,16,17Numeric Non Critical i 9 STATION 0 999 alpha char Alpha Non Critical C 3 DIRECTION 1 8 Numeric Critical 0 44 YEAR 0 99 89-07 Numeric Critical ! 54 MONTH 1 12 Numeric Critical $ 58 DAY 1 31 Numeric Critical . 5 HOUR 0 24 Numeric Critical a 27 VEH TYPE 1 849990 see note Numeric Critical j 10 BODY TYPE 0 99 Numeric Non Critical b 28 ENGINE TYPE 0 9 Numeric Non Critical c 29 AXLE F 0 400 Numeric Critical M 13 AXLE G 0 400 Numeric Critical M 13 AXLE H 0 400 Numeric Critical M 13 AXLE I 0 400 Numeric Critical M 13 AXLE J 0 400 Numeric Critical M 13 AXLE K 0 400 Numeric Critical M 13 AXLE L 0 400 Numeric Critical M 13 AXLE M 0 400 Numeric Critical M 13 SPACE E-F 0 450 0,19-450 Numeric Critical N 14 SPACE F-G 0 450 0,19-450 Numeric Critical N 14 SPACE G-H 0 450 0,19-450 Numeric Critical N 14 SPACE H-I 0 450 0,19-450 Numeric Critical N 14 SPACE I-J 0 450 0,19-450 Numeric Critical N 14 SPACE J-K 0 450 0,19-450 Numeric Critical N 14 SPACE K-L 0 450 0,19-450 Numeric Critical N 14 SPACE L-M 0 450 0,19-450 Numeric Critical N 14 SERIAL 0 999 1-999 Numeric Non Critical P 16 CONTIN. 0 9 (0,1,)2,9 Numeric Critical Q 17
Edit Flag Name First Edit Flag Character EDITFLAG_OK _ (UNDERSCORE) NONCRITICAL_ERROR N CRITICAL_ERROR C
Flag Edit Flag Name _ EDIT FLAG OK A INVALID CARD TYPE IDENTIFIER B 6 DIGIT STATION ID C 3 DIGIT STATION ID D FAULTY CONSECUTIVE HEADER RECS E INVALID DAY SPECIFIED F INVALID WEEKDAY SPECIFIED G INVALID STATE ID H INVALID STATION ID I INVALID FUNCTIONAL CLASS J INVALID VEHICLE TYPE K INVALID TOTAL WEIGHT L INVALID TOTAL AXLE SPACING M INVALID AXLE WEIGHT N INVALID AXLE SPACING O INVALID LANE P INVALID SERIAL NUMBER Q CONTINUATION CARD R INVALID VOLUME S INVALID METHOD T INVALID ATR U INVALID ROUTE V INVALID SITE W INVALID EQUIPMENT TYPE X INVALID COUNT METHOD Y INVALID ENFORCEMENT METHOD Z INVALID OPTCLASS a INVALID HOUR b INVALID BODY TYPE c INVALID ENGINE TYPE d INVALID COMMODITY e INVALID MCYCLERPT f INVALID REG WEIGHT g INVALID BASIS REGISTRATION h INVALID LOAD STATUS i INVALID VEHICLE COMBO j INVALID MINUTE k INVALID SECOND l INVALID HUNDRETH OF SECOND m INVALID NUMBER OF AXLES n INVALID RECORD LENGTH o INVALID TIME/DATE SEQUENCE p INVALID ALL AXLE WEIGHTS q INVALID ALL AXLE SPACINGS r 8+ CONSECUTIVE ZEROS s TIME CHECK t MISSING DATA u ZERO DATA v IMPROPER DIRECTION DESIGNATION w IMPROPER LANE DESIGNATION x 7 CARD GREATER THAN 4 CARD
DAILY VOLUME BY SIGNIFICANT
DIFFERENCEy 4+ CONSEC NONZEROS z 4 CARD GREATER THAN 7 CARD
DAILY VOLUME BY SIGNIFICANT
DIFFERENCE0 INVALID DIRECTION 1 INVALID TOTAL WEIGHT 2 INVALID TOTAL SPACE 3 INVALID ROUTE CATEGORY 4 INVALID COUNTY 5 INVALID HPMS SAMPLE SECTION 6 INVALID AADT 7 INVALID FOOTNOTE 8 INVALID YEAR ESTABLSHED 9 INVALID YEAR DISCONTINUED ! INVALID YEAR * INVALID NUMBER OF AXLES (>13) @ INVALID TIME % INVALID SPEED $ INVALID MONTH . INVALID DATE , 8+ CONSECUTIVE ZERO VOLUMES ? 4+ CONSECUTIVE STATIC VOLUMES / 1 AM VOLUME > 1 PM VOLUME ) MISSING HOURLY VOLUME + ZERO DAILY VOLUME & OVER CALIBRATED # UNDER CALIBRATED ^ LARGE % OF VEHICLES > 80 KIPS ~ LARGE % OF VEHICLES < 12 KIPS | LOWER VOLUMES THAN EXPECTED -
POSSIBLE SENSOR PROBLEM> MISCLASSIFICATION ERROR < ATYPICAL PATTERN ? USER ENTERED
File "filename" ext/date do not match 1st record "date" - The date of the first record in the file does not match that of the extension. The data on the first record is printed out to assist in renaming the file.
The SHRP.DAT file could not be located during the data loading process. The Base Data Directory may be specified incorrectly in the User Preferences menu.
The DEFSHT.DAT file could not be located during the data loading process. The Base Data Directory may be specified incorrectly in the User Preferences menu.
The NEWSHT.DAT file could not be located during the data loading process. The Base Data Directory may be specified incorrectly in the User Preferences menu.
The program loaded a data file and attempted to create the archive directory and file but was unable to. The specified directory name length may be too long for Microsoft Windows, or permissions on directories within the Base Data Path may be incorrect.
A connection to the database exists, but the connection to the LTPP File Tracker has been dropped. Disconnect from the database and reconnect.
The QC software creates a lengthy directory structure under the Base Data Path in the User Preferences. During data loading, the directory failed to be created. Possible causes are directory/user permissions, or the length of the final directory name exceeded a given limit.
The software believes a given file was loaded and should exist in the LTPP File Tracker, but the entry does not exist. This error may arise if an entry is deleted from the file tracker and subsequently used in a menu that was already open. All menus containing reference to that file must be closed and the file reloaded (if desired).
Microsoft Windows failed to allocate a temporary file processing. Possible causes are that the TEMP directory doesn't exist, the number of files in the location is at a maximum limit, or the hard disk is full.
The software believes a given file was loaded and should exist in the LTPP File Tracker, but the entry does not exist. This error may arise if an entry is deleted from the file tracker and subsequently used in a menu that was already open. All menus containing reference to that file must be closed and the file reloaded (if desired).
The program could not find the LTPP File Tracker (table LTPPFILETRACKER) in the database. Permissions may be set improperly on the table, or the table may have been deleted while the software was in use.
Apply Purges operation was attempted, but the archived data file was not located. It was probably moved or deleted. Use the LTPP File Tracker to browse for the file. If it cannot be found, then the file was permanently deleted and must be reloaded into the software from the original data file.
The QC software must read and rewrite the archived data file when purges are applied. The above error is produced because the software could not delete and rewrite the file, probably due to permission problems.
An archived (previously processed) data file was loaded into the software. This operation is forbidden.
The data collection site information could not be located in the SHRP.DAT file.
During the loading operation, the specified input file name was deleted or became no longer available.
The sheet information (11, 12, or 13) failed to be produced. This can occur if there is a failure to read, write, or update the CINDEX binary files used to store sheet information pertaining to input data files. Permissions may be set improperly on the directories within the Base Data Path directory structure.
During the loading process, a card type (C, W, 4, 7) inconsistency was encountered, and the type of data can no longer be confirmed. The input data file is discarded, and the loaded process for that file discontinued.
During the loading process, a problem with the file (probably incomplete data) was encountered. The file loading process is discontinued and all data discarded.
The FUNCLASS.DAT file could not be located, which contains the functional classification codes for the specified SHRP ID. This is used only during conversion from C & W to 4 & 7 cards. The data cannot be converted without this DAT file.
The FUNCLASS.DAT file exists, but the site could not be located in the file and, therefore, the functional classification code is not found.
A comparative graph option was selected on the Graph MGR menu, and the user was prompted for an input weight file, but no complimentary data file was provided.
The program requested physical drive (hard disk, floppy, CD ROM) information from Microsoft Windows, but none was returned. The only cause could be that Windows does not currently want to cooperate.
The QC software attempted to get iconic images represented the physical drives on your computer, but failed. No probable cause.
Iconic images for directories and files on your computer were not locatable. There may be a problem with memory sharing at the current time on your computer. Try restarting the program or rebooting the computer to free system resources.
The user specified a complimentary input weight file for comparative graphing with the Graph MGR, but the input data file is not a weight data file.
The comparative graphing option was specified on the Graph MGR, and two input files were given, but one or both contain no data.
The program attempted to create an initial user profile (used for custom program settings), but it couldn't be created. User profiles are typically stored in the standard user profiles directory. Have the systems administrator validate this directory and permissions.
The program was able to create a directory for the user profile, but an operator.dat file couldn't be created in the directory.
The program was unable to load the existing operator.dat file.
The program encountered an invalid user profile entry and is using the default setting internal to the program.
The program attempted to open the daily summary ORACLE table for the specified data file, but the table could not be opened. It may have been deleted, or the table permissions may be incorrect.
The program attempted to open the record level ORACLE table for the specified data file, but the table could not be opened. It may have been deleted, or the table permissions may be incorrect.
The program attempted to apply purges to data files which are not present. Check PREFS for the expected subdirectory path for SHRP.DAT. Check the output directories for the actual existence of the files.
The range of day values entered manually has the value of the last day less than the value of the first day. The range must be specified within a month from lowest to highest day in the interval.
1 - 2 = 11, 12, 13 (depending on type of sheet)
The values for month, day and year should never have any value after the decimal, so are expected to always be 0. It possible that this capability was included to permit updating the sheet by version or multiple loads of files.
3 - 6 = nn.0 (MM.0)
7-10 = nn.0 (DD.0)
11-14 = nn.0 (YY.0)
15-20 = 000000
SheetNum[20] - alpha - Unique key described above.
ShrpId[10] - alpha - /* All others are DUP */
StateId[6] - alpha - This is presumably the station identification assigned by the state to the site.
StateCode[4] - alpha -
HwyRoute[12] - alpha -
Milepost[12] - alpha - presumably with embedded decimal point.
Location[33] - alpha -
Filename[14] - alpha
DiskId[14] - alpha - presumably the volume label for the media on which the disk was received.
BeginDate - of the form MmDdYy - This should be formatted to report a 4-digit year when converted into an ORACLE table element.
MmDdYy EndDate - of the form MmDdYy - This should be formatted to report a 4-digit year when converted into an ORACLE table element.
BeginTime - of the form HhMm -
EndTime - of the form HhMm -
TypeOfCount - alpha - coded for 2-way, 1-way or LTPP lane only.
VehClassMethod - alpha - either FHWA (13 class) or agency.
VehClassOtherStr[4] - alpha - name of agency scheme.
AvcEquip - alpha - coded either port(able) or perm(anent); No code provided for manual even though LTPP Traffic DCG indicates that is an option.
SensorType - alpha - type of sensor used for volume counter (road tube, piezo cable, piezo film, loops, other)
SensOtherStr[16]- alpha - name of sensor not included in list of expected types.
CounterType[16] - alpha -
NameModel[16] - alpha - model of volume equipment
AdjustFact GenAdjust[NUMADJUSTFACT] - alpha - a number with an embedded decimal is what should exist for non-null entries. This is a factor that applies to all classes in the count. Where the number of them that should exist is entered isn't obvious from the file description.
AdjustFact ClassAdjust[25][NUMADJUSTFACT] - alpha -
VehClass[25][4] - alpha -
MoreVehClass - alpha -
Comments[10][64] - alpha - 10 64-character comment lines, presumably with a different comment on each line.
SheetNum[20] - alpha - Unique key described above.
M.3 Sheet 11
ShrpId[10] - alpha - /* All others are DUP */
StateId[6] - alpha - This is presumably the station identification assigned by the state to the site.
StateCode[4] - alpha -
HwyRoute[11] - alpha -
Milepost[11] - alpha - presumably with embedded decimal point.
Location[31] - alpha -
Filename[13] - alpha
DiskId[13] - alpha - presumably the volume label for the media on which the disk was received.
BeginDate - of the form MmDdYy - This should be formatted to report a 4-digit year when converted into an ORACLE table element.
MmDdYy EndDate - of the form MmDdYy - This should be formatted to report a 4-digit year when converted into an ORACLE table element.
BeginTime - of the form HhMm -
EndTime - of the form HhMm -
Classmethod - alpha - either FHWA (13 class), FHWA truck weight study (6- digit) or agency.
Methodname - alpha - name of agency scheme.
ScaleType alpha - coded either port(able) or perm(anent).
ScaleTypeOtherStr[18] - alpha - for another type of static scale used which does not measure loads at highway speeds.
CounterType[18] - alpha -
NameModel[18] - alpha - model of volume equipment.
SensorType - alpha - type of sensor used for volume counter (bending plate, piezo cable, piezo film, other).
SensOtherStr[18]- alpha - name of sensor not included in list of expected types.
Comments[10][64] - alpha - 10 64-character comment lines, presumably with a different comment on each line.
SheetNum[20] - alpha - Unique key described above.
ShrpId[10] - alpha - /* All others are DUP */
StateId[6] - alpha - This is presumably the station identification assigned by the state to the site.
StateCode[4] - alpha -
HwyRoute[11] - alpha -
Milepost[11] - alpha - presumably with embedded decimal point.
Location[32] - alpha -
Filename[15] - alpha
DiskId[15] - alpha - presumably the volume label for the media on which the disk was received.
BeginDate - of the form MmDdYy - This should be formatted to report a 4-digit year when converted into an ORACLE table element.
MmDdYy EndDate - of the form MmDdYy - This should be formatted to report a 4-digit year when converted into an ORACLE table element.
BeginTime - of the form HhMm -
EndTime - of the form HhMm -
TypeOfCount - alpha - coded for 2-way, 1-way or LTPP lane only.
DevType - alpha -
SensorType - alpha - type of sensor used for volume counter (road tube, piezo cable, piezo film, loops, other)
SensOtherStr[18] - alpha - name of sensor not included in list of expected types.
NameModel[18] - alpha - model of volume equipment.
CounterType[18] - alpha - coded either port(able) or perm(anent).
AxleCorrFact[9] - alpha - a number with an embedded decimal is what should exist in non-null fields. This value indicates the number of axles per vehicle that are expected at the site to estimate daily traffic.
AxleCorrStd[9]- alpha - a number with an embedded decimal is what should exist in non-null entries. The standard deviation of AxleCorrFact.
MonthlyFact[9]- alpha - a number with an embedded decimal is what should exist in non-null entries. This value is a multiplier used to adjust the data when factoring to a full year estimate when this is the only data available.
MonthlyStd[9]- alpha - a number with an embedded decimal is what should exist in non-null entries. The standard deviation of MonthlyFact.
DayOfWeekFact[9]- alpha - a number with an embedded decimal is what should exist in non-null entries. This value is a multiplier used to adjust the data to the average day of week when factoring to a full year estimate when this is the only data available.
DayOfWeekStd[9]- alpha - a number with an embedded decimal is what should exist for non-null entries. The standard deviation of DayOfWeekFact.
OtherFact[9]- alpha - a number with an embedded decimal is what should exist in non-null entries. Any other factor applied by the agency to adjust the data in expanding a sample to a year.
OtherStd[9]- alpha - a number with an embedded decimal is what should exist in non-null entries. The standard deviation of OtherFact.
OtherFactStr[28]- alpha - a description of OtherFact.
DistFactGps[8]- alpha - a number with an embedded decimal is what should exist for non-null entries. This is the percentage of the count in the LTPP lane if more than one lane is included in the data.
DistFactSource[45]- alpha - description of how the lane distribution factor was developed.
Comments[10][64] - alpha - 10 64-character comment lines, presumably with a different comment on each line.