U.S. Department of Transportation
Federal Highway Administration
1200 New Jersey Avenue, SE
Washington, DC 20590
202-366-4000
Federal Highway Administration Research and Technology
Coordinating, Developing, and Delivering Highway Transportation Innovations
 |
| This report is an archived publication and may contain dated technical, contact, and link information |
|
Publication Number: FHWA-RD-02-085 Date: July 2006 |
Previous | Table of Contents | Next
The Ohio site consists of eight test sections located on eastbound and westbound State Route 2, near Vermilion, OH, between the Baumhart Road and Vermilion Road exits. This section of State Route 2 is an Ohio Department of Transportation (ODOT) research road constructed in 1974 with 104 test sections to evaluate the effects of various pavement design and material factors on PCC pavement performance. Extensive research was conducted at this site into various material factors affecting D-cracking. The existing pavement through the project sections is 230-mm jointed reinforced concrete pavement (JRCP) with 12.2-m joint spacing. The ADT taken in 1990 was 14,400 with 22 percent trucks. The average truck factor during the time of field testing was 1.94.
Eight different materials were evaluated at this site:
The mix designs for the materials tested at the Ohio site are given in table 4. All repairs placed at this site are 1.8 m long.
All work at the Ohio site was carried out during daytime hours. Work started about 7 a.m. each day with the closing of the work area to traffic and concrete removal operation. Concreteplacement typically started about 10 a.m., and the sections were opened to traffic generally by 5:30 p.m. One material (section) was placed per day.
Table 5 provides a summary of Ohio sections. As for the Georgia sections, fatigue damage due to early opening was defined as the damage incurred during the first 14 days of service. The same procedure was used to calculate the damage.
| Mix Component (Per yd3) | 2-to 4-hour opening | 4- to 6-hour opening | 12- to 24-hour opening | |||||
|---|---|---|---|---|---|---|---|---|
| PC 1 | RSC 1 | VES | PC 2 | RSC 2 | FS | FT I | HES | |
| Cement type | Pyrament | Rapidset | Type III | Pyrament | Rapidset | Type III | Type III | Type III |
| Cement, lb | 900 | 750 | 915 | 850 | 650 | 900 | 750 | 870 |
| Fine aggregate, lb | 1,430 | 1,390 | 1,180 | 1,450 | 1,400 | 1,000 | 1,360 | 775 |
| Coarse aggregate, lb | 1,370 | 1,290 | 1,090 | 1,400 | 1,300 | 1,420 | 1,200 | 1,645 |
| Water, lb | 240 | 302 | 409 | 246 | 325 | 360 | 369 | 357 |
| Water reducer, oz | – | – | – | – | – | – | 45 | – |
| Accelerator (DCI®), gal | – | – | 6 | – | – | – | – | 4.0 |
| Accelerator (CaCl2), gal | – | – | – | – | – | 18 | – | – |
| Set retarder, oz | – | – | – | – | – | – | – | – |
| Citric acid, lb | – | 11.25 | – | – | 7.8 | – | – | – |
| High-range water reducer, oz | – | – | 45.75 | – | – | – | – | 209 |
| Air entraining agent, oz | – | 22.5 | 73 | – | 26 | 90 | 52.5 | 69.6 |
| w/c ratio | 0.27 | 0.40 | 0.45 | 0.29 | 0.50 | 0.40 | 0.49 | 0.41 |
1 yd3 = 0.7645m3
1 lb = 0.4535 kg
1 gal = 3.78 L
1 oz = 29.57 mL
| Repair Number |
Repair Size, ft. | Age at Opening h | Strength at Openings, psi | Early Opening Damage* | |
|---|---|---|---|---|---|
| Fc' | Modulus of Rupture | ||||
| HES—10- to 26-h opening | |||||
| A-2 | 6 | 16.8 | 4,650 | 520 | 0.000 |
| A-3 | 6 | 15.8 | 4,600 | 520 | 0.000 |
| A-4 | 6 | 14.7 | 4,450 | 510 | 0.000 |
| A-5 | 6 | 14.1 | 4,350 | 500 | 0.000 |
| A-6 | 6 | 10.3 | 3,800 | 455 | 0.000 |
| A-7 | 6 | 10.2 | 3,750 | 455 | 0.000 |
| A-8 | 6 | 10.1 | 3,750 | 455 | 0.000 |
| A-9 | 6 | 9.6 | 3,700 | 450 | 0.000 |
| A-10 | 6 | 9.5 | 3,700 | 450 | 0.000 |
| FT I – 10 to 26-h opening | |||||
| B-2 | 6 | 19.0 | 4,350 | 585 | 0.000 |
| B-3 | 6 | 18.2 | 4,300 | 580 | 0.000 |
| B-4 | 6 | 18.0 | 4,300 | 575 | 0.000 |
| B-5 | 6 | 15.4 | 4,100 | 560 | 0.000 |
| B-6 | 6 | 15.3 | 4,100 | 560 | 0.000 |
| B-7 | 6 | 15.3 | 4,100 | 555 | 0.000 |
| B-8 | 6 | 12.4 | 3,900 | 530 | 0.000 |
| B-9 | 6 | 12.3 | 3,850 | 530 | 0.000 |
| B-10 | 6 | 12.3 | 3,850 | 530 | 0.000 |
| PC 1 – 1- to 6-h opening | |||||
| C-2 | 6 | 5.8 | 1,900 | 325 | 0.000 |
| C-3 | 6 | 5.2 | 1,850 | 320 | 0.000 |
| C-4 | 6 | 4.8 | 1,800 | 315 | 0.000 |
| C-5 | 6 | 4.2 | 1,750 | 305 | 0.001 |
| C-6 | 6 | 3.9 | 1,650 | 300 | 0.001 |
| C-7 | 6 | 3.3 | 1,500 | 280 | 0.002 |
| C-8 | 6 | 3.0 | 1,500 | 275 | 0.002 |
| C-9 | 6 | 2.5 | 1,300 | 255 | 0.005 |
| C-10 | 6 | 2.0 | 1,150 | 230 | 0.010 |
| RSC 1– 1- to 6-h opening | |||||
| D-2 | 6 | 5.5 | 4,100 | 480 | 0.000 |
| D-3 | 6 | 3.7 | 3,950 | 460 | 0.000 |
| D-4 | 6 | 3.6 | 3,900 | 455 | 0.000 |
| D-5 | 6 | 3.1 | 3,750 | 440 | 0.000 |
| D-6 | 6 | 3.0 | 3,700 | 435 | 0.000 |
| D-7 | 6 | 2.3 | 3,200 | 380 | 0.001 |
| D-8 | 6 | 2.3 | 3,200 | 380 | 0.001 |
| D-9 | 6 | 1.9 | 2,150 | 245 | 0.004 |
| D-10 | 6 | 1.8 | 2,150 | 245 | 0.004 |
| VES—3- to 8-h opening | |||||
| E-2 | 6 | 6.5 | 3,100 | 375 | 0.000 |
| E-3 | 6 | 6.0 | 3,050 | 370 | 0.000 |
| E-4 | 6 | 5.0 | 2,550 | 340 | 0.000 |
| E-5 | 6 | 4.3 | 2,050 | 310 | 0.001 |
| E-6 | 6 | 4.3 | 2,050 | 310 | 0.001 |
| E-7 | 6 | 3.8 | 1,300 | 260 | 0.002 |
| E-8 | 6 | 3.8 | 1,300 | 260 | 0.002 |
| E-9 | 6 | 3.3 | 1,000 | 240 | 0.004 |
| E-10 | 6 | 3.3 | 1,000 | 240 | 0.004 |
| PC 2—3- to 8-h opening | |||||
| F-2 | 6 | 6.6 | 1,500 | 290 | 0.001 |
| F-3 | 6 | 5.9 | 1,400 | 275 | 0.002 |
| F-4 | 6 | 5.7 | 1,400 | 270 | 0.003 |
| F-5 | 6 | 4.9 | 1,350 | 260 | 0.004 |
| F-6 | 6 | 4.8 | 1,350 | 255 | 0.005 |
| F-7 | 6 | 4.3 | 1,300 | 250 | 0.010 |
| F-8 | 6 | 4.1 | 1,250 | 250 | 0.011 |
| F-9 | 6 | 3.7 | 1,200 | 235 | 0.011 |
| F-10 | 6 | 3.5 | 1,150 | 220 | 0.011 |
| RSC 2—3- to 8-h opening | |||||
| G-2 | 6 | 5.5 | 3,950 | 535 | 0.000 |
| G-3 | 6 | 4.3 | 3,350 | 500 | 0.000 |
| G-4 | 6 | 3.9 | 3,150 | 465 | 0.000 |
| G-5 | 6 | 3.8 | 3,150 | 465 | 0.000 |
| G-6 | 6 | 3.3 | 2,600 | 420 | 0.000 |
| G-7 | 6 | 3.2 | 2,600 | 420 | 0.000 |
| G-8 | 6 | 2.8 | 2,150 | 375 | 0.000 |
| G-9 | 6 | 2.6 | 1,950 | 350 | 0.000 |
| G-10 | 6 | 2.4 | 1,850 | 310 | 0.001 |
| FS—3- to 8-h opening | |||||
| H-2 | 6 | 6.8 | 5,250 | 540 | 0.000 |
| H-3 | 6 | 7.8 | 5,500 | 565 | 0.000 |
| H-4 | 6 | 6.5 | 5,150 | 535 | 0.000 |
| H-5 | 6 | 6.3 | 5,100 | 530 | 0.000 |
| H-6 | 6 | 4.1 | 4,550 | 470 | 0.000 |
| H-7 | 6 | 3.9 | 4,450 | 465 | 0.000 |
| H-8 | 6 | 2.3 | 1,100 | 135 | 0.150 |
| H-9 | 6 | 2.2 | 1,100 | 135 | 0.150 |
| H-10 | 6 | 2.0 | 1,100 | 135 | 0.150 |
*Miner’s fatigue
1 m = 3.28 ft
1 MPa = 145.04 psi
The performance of Ohio sections was plagued by the longitudinal cracking that developed in the majority of repairs shortly after construction. The cracks appeared within weeks of construction. Three sections also developed transverse cracks and corner breaks, but those distresses are secondary cracking that is unlikely to have occurred had the longitudinal cracking not occurred. Transverse fatigue cracking is not an issue for short (1.8-m) repairs.
The distress data for Ohio sections are summarized in table B2 (appendix B). Faulting performance of Ohio sections is summarized in table 6; the detailed joint performance data are given in table B3. As with the Georgia sections, all Ohio sections gave excellent joint performance except for RSC 1, which developed excessive faulting.
| Section | Faulting, in1 | Average LTE | ||||
|---|---|---|---|---|---|---|
| 1994 | 1995 | 1996 | 1997 | 1998 | ||
| HES | 0.03 | 0.02 | 0.02 | 0.02 | 0.02 | 74% |
| FT I | 0.04 | 0.02 | 0.03 | 0.03 | 0.05 | 64% |
| PC 1 | 0.01 | 0.01 | 0.01 | 0.01 | 0.01 | 74% |
| RSC 1 | 0.14 | 0.18 | 0.17 | n/a2 | n/a2 | 77% |
| VES | 0.02 | 0.01 | 0.01 | 0.01 | 0.02 | 79% |
| PC 2 | 0.02 | 0.03 | 0.02 | 0.02 | 0.01 | 82% |
| RSC 2 | 0.02 | 0.02 | 0.02 | 0.02 | 0.02 | 80% |
| FS | 0.04 | 0.02 | 0.02 | 0.02 | 0.03 | 75% |
| 1Absolute average. | 1 in = 25.4 mm |
| 2Overlaid after 1996 survey. | |
The unusually poor joint performance RSC 1 section is inexplicable. The possible causes of excessive faulting in doweled full-depth repairs include the following:
This section did not have an unusually high temperature gradient at the time of concrete hardening, and the compressive strength at opening was relatively high. Improper installation is a possibility, but not likely because this is the only section with this problem. The RSC 1 section was overlaid after the 1996 survey.
As mentioned in appendix A, the VES and FS sections started to show map cracking in 1997 (figure 7). The suspected cause of the map cracking is delayed ettringite formation (DEF). DEF is possible if the concrete temperature during hydration exceeds about 70 °C. The peak temperature in the VES section was just above this threshold temperature, and that in the FS section was significantly higher (80.6 °C). Core testing confirmed DEF in these sections.
Continued development of D-cracking in the surrounding concrete was also a problem at this site. As a part the pavement rehabilitation program, edgedrains were installed after the completion of all repair work in 1992. However, the edgedrains were not effective in mitigating D-cracking in the original pavement at this site, although the RPPR study showed a significant benefit of edgedrains provided at the time of initial construction (Smith et al., 1995). As mentioned earlier, the project site in Ohio contains 104 test sections, many of which were evaluated in the RPPR study. The result of a field survey conducted under the RPPR study showed that the sections originally provided with edgedrains exhibited significantly less spalling due to D-cracking at this site. However, the retrofitted edgedrains installed in 1992 did not appear effective in mitigating D-cracking. By 1998, some repairs started showing signs of D-cracking on the original pavement side of the repair joints. This may be an indication that accumulated internal damage over the years does play a significant role in the development of D-cracking, as commonly believed.
Figure 7. Map cracking observed in FS section in 1997.
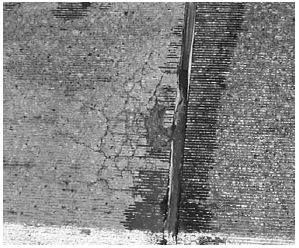
By far the most significant distress in the Ohio test sections is the early development of longitudinal cracking in nearly all repairs. Typical longitudinal cracking at this site is illustrated in figure 8. These cracks typically occurred in about the outer one-third of the slab. The rate of development of longitudinal cracking in Ohio sections is shown in figure 9. By the 2-month follow-up survey conducted under SHRP C-206, 100 percent of the FS section and 90 percent of the RSC 1 section had developed longitudinal cracking. By the time of first survey under this project in 1994, five of the eight sections had developed additional longitudinal cracking. Under SHRP C-206, the following were identified as possible causes of the cracking problem:
Figure 8. Illustration of typical longitudinal cracking in Ohio sections.

Figure 9. Development of longitudinal cracking in Ohio sections.
Of the three potential causes considered, the last (excessive compressive force) is unlikely, because the repair concrete was set during the hottest part of the day. By the time the repairs were opened to traffic (typically 5:30 p.m.), the surrounding concrete was well into the daily cooling cycle. Excessive built-in curling, in combination with a highly nonlinear negative temperature gradient, can cause top-down cracking (overnight, in extreme cases); however, a high rate of cracking also occurred in sections that had relatively low temperature gradients at the time of concrete hardening. On the other hand, the RSC 2 section, which had a very high temperature gradient at the time of concrete hardening, had a relatively low level of cracking (none at the time of the 2-month evaluation). Temperature conditions at the time of concrete hardening and peak temperatures reached during hydration are summarized in table 7.
| Section | Top | Middle | Bottom | Average | Top - Bottom | Peak | Average Including Peak |
|---|---|---|---|---|---|---|---|
| HES | 90.0 | 100.0 | 90.0 | 93.3 | 0.0 | 145.0 | 106.3 |
| FT I | 90.0 | 98.0 | 85.0 | 91.0 | 5.0 | 130.0 | 100.8 |
| PC 1 | 104.0 | 107.0 | 92.0 | 101.0 | 12.0 | 108.0 | 102.8 |
| RSC 1 | 110.0 | 118.0 | 98.0 | 108.7 | 12.0 | 127.0 | 113.3 |
| VES | 100.0 | 103.0 | 97.0 | 100.0 | 3.0 | 157.0 | 114.3 |
| PC 2 | 105.0 | 104.0 | 92.0 | 100.3 | 13.0 | 108.0 | 102.3 |
| RSC 2 | 109.0 | 108.0 | 89.0 | 102.0 | 20.0 | 129.0 | 108.8 |
| FS | 132.0 | 125.0 | 100.0 | 119.0 | 32.0 | 177.0 | 133.5 |
°C = (°F-32)/1.8
Of the temperature parameters shown in table 7, the one most closely correlated with longitudinal cracking is the average temperature including the peak temperature reached during hydration. This is a simple average of top, middle, and bottom temperature at the time of concrete hardening and the peak temperature. Another factor that appears to have been significant is the overnight temperature during early ages of concrete. The concrete temperatures at the time of concrete hardening and the peak temperature reached during hydration for the Georgia sections are not significantly different from those of the Ohio sections, but none of the sections in Georgia developed longitudinal cracking, including 1.8-m (6-ft) repairs. The temperature data for the Georgia sections are shown in table 8.
| Section | Top | Middle | Bottom | Average | Top - Bottom | Peak | Average Including Peak |
|---|---|---|---|---|---|---|---|
| VES | 98.0 | 110.0 | 98.0 | 102.0 | 0.0 | 138.0 | 111.0 |
| FT I | 100.0 | 110.0 | 104.0 | 104.7 | -4.0 | 123.0 | 109.3 |
| GADOT | 96.0 | 98.0 | 98.0 | 97.3 | -2.0 | 140.0 | 108.0 |
°C = (°F-32)/1.8
The main difference in temperature conditions at the two sites is the overnight low temperature during early ages of the concrete. At the Ohio site, the overnight temperatures dropped below 10 °C during construction of the test sections. The overnight temperature at the Georgia site was above 21 °C at all times. The difference between the average slab temperature at early ages, including the peak temperature, and the overnight low temperature appears to have been the most critical factor affecting the potential for longitudinal cracking. The difference between the average curing temperature and overnight low temperature is summarized in table 9. The correlation between this parameter and longitudinal cracking in Ohio sections is shown in figures 10, 11, and 12 for the correlation at 2 months, 2 years, and 6 years of age. Figure 10 shows excellent correlation between this parameter and longitudinal cracking. If the cracking is caused by dowel restraint (of the horizontal movement in the transverse direction), this should be an effect that mostly influences the early-life behavior. Various factors would alleviate this effect at later ages, including creep and higher material strength. This is consistent with the trends shown in figures 10, 11, and 12. The best correlation is exhibited in figure 10 at 2 months of age, and the correlation becomes progressively worse for later ages.
| Section | Average Temp. During Curing, °F | Overnight Low | Difference |
|---|---|---|---|
| Ohio sections | |||
| HES | 106.3 | 50 | 56.3 |
| FT I | 100.8 | 50 | 50.8 |
| PC 1 | 102.8 | 50 | 52.8 |
| RSC 1 | 113.3 | 50 | 63.3 |
| VES | 114.3 | 50 | 64.3 |
| PC 2 | 102.3 | 50 | 52.3 |
| RSC 2 | 108.8 | 50 | 58.8 |
| FS | 133.5 | 50 | 83.5 |
| Georgia sections | |||
| VES | 111.0 | 70 | 41.0 |
| FT I | 109.3 | 70 | 39.3 |
| GA DOT | 108.0 | 70 | 38.0 |
°C = (°F-32)/1.8
Figure 10. Correlation between the difference of average curing and overnight low temperatures and longitudinal cracking in Ohio sections at 2 months.
°C = (°F-32)/1.8
Figure 11. Correlation between the difference of average curing and overnight low temperatures and longitudinal cracking in Ohio sections at 2 years.
°C = (°F-32)/1.8
Figure 12. Correlation between the difference of average curing and overnight low temperatures and longitudinal cracking in Ohio sections at 6 years.
°C = (°F-32)/1.8
The results shown in table 9 and figures 10 through 12 strongly suggest that the climatic conditions during construction played a major role in early development of longitudinal cracking in the Ohio sections. Figure 10 shows that if the difference between average curing temperature and overnight low temperature is less than about 10 °C (50 °F), the risk of developing longitudinal cracking due to dowel restraint is relatively low. That difference was less than 5 °C (41 °F) for all the Georgia sections, and none of the Georgia sections developed longitudinal cracking.
The risk of early age cracking can be evaluated using FHWA’s software HIPERPAV (McCullough and Rasmussan 1999; Forster 1998). The software takes key environmental, structural design, mix design, and construction inputs and generates a graph showing the development of PCC strength and stress over the first 72 hours after placement. If the stress exceeds the strength at any time, a high potential for uncontrolled cracking is indicated. For such cases, adjustments can be made to mixes, curing practice, or time of PCC placement to reduce the potential for cracking. Where a significant difference between the average curing temperature and overnight low temperature is possible (i.e., greater than 10 °C (50 °F)), the use of HIPERPAV is recommended.

