U.S. Department of Transportation
Federal Highway Administration
1200 New Jersey Avenue, SE
Washington, DC 20590
202-366-4000
Federal Highway Administration Research and Technology
Coordinating, Developing, and Delivering Highway Transportation Innovations
 |
| This report is an archived publication and may contain dated technical, contact, and link information |
|
Publication Number: FHWA-RD-02-086 Date: August 2006 |
Previous | Table of Contents | Next
This site consists of two medium-length (68 m (225 ft)) three-span parallel bridges carrying U.S. 52 over Twelve Mile Creek just west of the town of New Richmond, OH. The bridges consist of concrete decks on continuous structural steel I-beams and cross-frames. The two end spans are 22 m (71 ft) long, while the center span is 25 m (82 ft) long. The bridges were originally constructed in 1965, and in 1991 were reported to be in "satisfactory" condition, with delaminations and patches over approximately 20 percent of the surface. The overlays were placed as part of a larger project to extend U.S. 52 to meet I–275 in Cincinnati. The eastbound deck shown in figure 9, and the westbound travel lane shown in figure 10, were overlaid with LMC-III concrete, while the westbound passing lane shown in figure 11 was overlaid with a SFC overlay. The original information provided to the researchers incorrectly indicated that the westbound travel lane was overlaid with SFC.
The U.S. 52 test site was inspected on:
Figure 9. Photograph showing the eastbound deck of U.S. 52 over Raymond Run in Columbus, OH. The overlay is latex-modified.
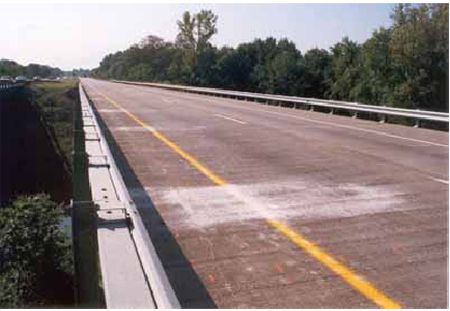
Figure 10. Photograph of westbound travel lane of U.S. 52 over Raymond Run in Columbus, OH. The overlay is latex-modified.
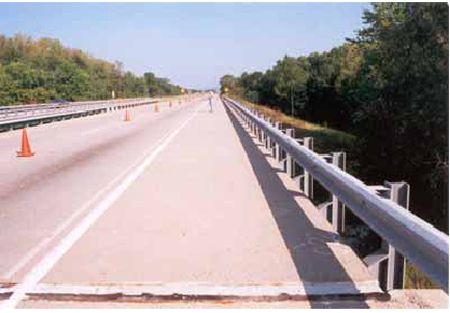
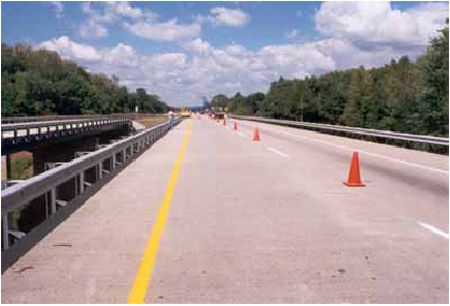
Figure 11. Photograph showing westbound passing lane of U.S. 52 over Raymond Run in Columbus, OH. The overlay is silica fume concrete.
Eastbound Lanes and Westbound Travel Lane—The materials selected for the LMC-III mix consisted of: a Type III cement; an angular to rounded natural sand consisting of a mixture of siliceous and calcareous minerals having a specific gravity of 2.68, absorption of 1.16 percent, and fineness modulus of 2.67; and a partially crushed limestone coarse aggregate having a maximum top-size of 12 mm (0.5 inch) with a specific gravity of 2.63 and an absorption of 2.09 percent. The latex used was DPS Modifier A, a styrene-butadiene latex emulsion. The specifications on the fresh concrete required a slump between 100 to 150 mm (4 and 6 inches) and an air content not to exceed 6 percent.
Westbound Passing Lane—A Type I cement was used in the SFC mix. Aggregates were from the same sources used for the LMC-III mix at this site. Admixtures included: (1) Densified Microsilica (compacted powder form); (2) Amex-210, a benzyl-sulfonate based air-entraining agent; (3) Hy- Kon 2000R, a Type D water-reducer/retarder; and (4) Hy-Con Super, a Type F high-range water reducer. The specifications on the fresh properties of the concrete include a slump of 100 to 200 mm (4 to 8 inches) and an air content range of 6 to10 percent. The mixture proportions and plastic concrete characteristics for both overlays, as reported in the C-206 report, are shown in table 16.
| Material | LMC-III | SFC |
|---|---|---|
| Cement (lb/yd3) | 658 (Type III) | 700 (Type I) |
| Fine agg. (lb/yd3) | 1703 | 1480 |
| Coarse agg. (lb/yd3) | 1333 | 1297 |
| Water (lb/yd3) | 238 | 285 |
| Latex modifier (gal/yd3) | 24.5 | – |
| Silica fume (lb/yd3) | – | 70 |
| Water reducer (oz/yd3) | – | 14 |
| HRWRA (oz/yd3) | – | 175 |
| AEA (oz/yd3) | – | 28 |
| W/C ratio | 0.36 | 0.37 |
| Air content (percent) | 5.2 | 9.5 |
| Slump (inches) | 5.5 | 6.5 |
| Temperature (°F) | 72 | 74 |
| Unit weight (lb/ft3) | 145.4 | 139.4 |
| Placement date | 4/23/92 | 4/23/92 |
| Weather conditions | Clear | Clear |
| 1 lb/yd3 = .347 kg/m3 1 gal/yd3 = 5 l/m3 1 oz/yd3 = .037 kg/m3 |
1 inch = 25.4 mm (°F - 32/1.8) = °C 1 lb/ft3 = 16 kg/m3 |
The LMC-III overlay was placed using two mobile concrete mixers. The deck was wetted 1 hour prior to placement of the overlay and a cement-sand grout was scrubbed into the deck immediately prior to placement of the overlay. The surface was textured with steel tines and covered with wet burlap and polyethylene sheeting and kept wet for 72 hours. The SFC overlay was placed later the same day. A cement-sand grout was scrubbed into the deck immediately prior to placement of the overlay. The overlay was moist-cured for 72 hours after placement in a similar manner to the LMC-III overlay. Both sections were opened to traffic on April 29, 1992.
The underside of the two bridges were inspected during the setup of the lane closure. The three span structures are supported by continuous steel girders. Both structures had been widened previously because the outermost girder (supporting the right shoulder and curb) is supported on single slender columns placed next to the original piers. The original portion of the deck underside had transverse cracks on 2.5-m (8-ft) centers, with the cracks occasionally showing some efflorescence. The outside widened portion of the deck had underside transverse cracks on 1.2-m (4-ft) centers, with the cracks near the abutments showing some efflorescence staining. Mud and silt staining on the girders, along with conversations with ODOT personnel, revealed that the structure had been under water during heavy regional floods of 1995-1996.
Eastbound Travel and Passing Lanes—Both the travel and passing lanes on this structure have the latex-modified concrete overlay. Significant change was not seen in the condition of the overlay on this structure over the time of the inspections. The predominant feature of the visual inspection was short transverse cracks filled and covered with an acrylic-like material or an opaque white resinous material. Also there were some small transverse cracks that were unsealed. Most transverse cracks were along the edges of the deck structure. Areas of concentrated longitudinal cracks were seen, with more cracking on the two end spans than on the center span. The travel lanes were more affected than the shoulders. The cracks were short and of various widths. They appeared to be caused by plastic shrinkage.
Westbound Travel Lane—This lane also has the latex-modified concrete overlay. There is some plastic cracking throughout the lane. There are several transverse cracks up to 1.2 m (4 feet) long extending from the barrier side of the lane. Overall, the latex modified overlay was in visually good condition.
Westbound Passing Lane—This lane has the silica fume concrete overlay. Cracking in this lane is less than in the other three lanes. There are some scattered plastic cracks and some short transverse cracks extending from the edge on the shoulder side of the lane. An area of rough, open finish was noted in the last (leave) third of the bridge.
Chain drag and hammer survey techniques were used to locate and delineate areas of delamination of the overlay concrete from the original concrete deck. Delaminations were found mostly at crack locations. The number and total area of delaminations on the U.S. 52 bridge are shown in tables 17, 18, and 19. The eastbound travel lane LMC had no delaminations. The next best lane was the westbound travel lane LMC with three delaminated areas in 1998 totaling 0.37 m2 (4 ft2). The eastbound passing lane had only three areas totaling 0.84 m2 (9 ft2) in 1988.
The section with the most delaminations is the westbound passing lane SFC with seven areas and a total area of 2.16 m2 (23.2 ft2). All of the delaminations on this lane were associated with cracks within the delamination area. The percent delaminated area is shown in the tables. The total surface area of the passing lanes are 249 m2 (2,680 ft2) and for the travel lanes and shoulders are 456 m2 (4,900 ft2). It appears that the silica fume concrete overlay is performing slightly worse than the latex modified overlay but the silica fume overlay only has delaminations over only 0.87 percent of the surface which is very low. Generally both overlays are performing well with minimal delaminations.
| Year | Number of Areas | Total Area (m2) | Percent of Total Area |
|---|---|---|---|
| 1994 | 0 | 0 | 0 |
| 1995 | 0 | 0 | 0 |
| 1996 | 3 | 0.84 | 0.34 |
| 1997 | 3 | 0.84 | 0.34 |
| 1998 | 3 | 0.84 | 0.34 |
| Year | Number of Areas | Total Area (m2) | Percent of Total Area |
|---|---|---|---|
| 1994 | 0 | 0 | 0 |
| 1995 | 0 | 0 | 0 |
| 1996 | 1 | 0.14 | 0.03 |
| 1997 | 1 | 0.14 | 0.03 |
| 1998 | 3 | 0.37 | 0.08 |
| Year | Number of Areas | Total Area (m2) | Percent of Total Area |
|---|---|---|---|
| 1994 | 0 | 0 | 0 |
| 1995 | Not tested | Not tested | Not tested |
| 1996 | 3 | 0.60 | 0.24 |
| 1997 | 3 | 0.60 | 0.24 |
| 1998 | 7 | 2.16 | 0.87 |
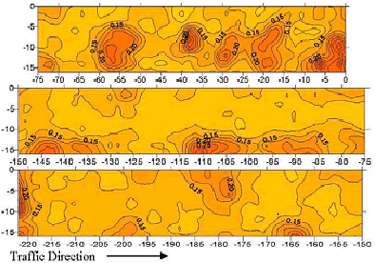
The half-cell potential surveys were performed using a grid marked on 0.6-m (2-ft) centers. The travel lanes were numbered starting with Row 1 at the leave end of the bridge, with the "A" grid line near the stripe separating the travel and passing lanes and the "J"line 0.6 m (2 ft) from the shoulder barrier rail. The longitudinal rows of points were numbered from 1 to 114 from the leave side to the approach side. Rows G, H, I, and J on the shoulder were not surveyed as they were reinforced with epoxy-coated reinforcing steel during the widening and all locations initially produced erratic half-cell potentials all more positive than –0.100 V. The readings for the eastbound travel lane LMC in 1994 range from approximately –0.008 V to –0.386 V. Table 20 shows that over 98 percent of the readings were less negative than –0.250 V.
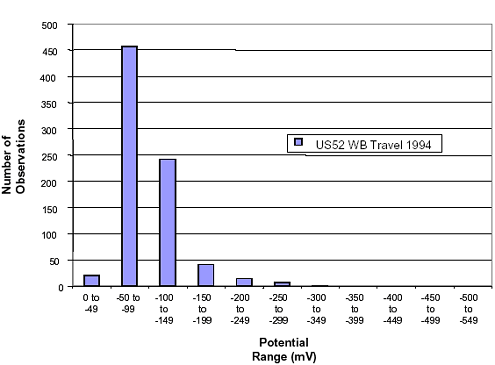
The readings for the eastbound travel lane in 1997, shown in table 21, range from –0.089 V to –0.412 V. Over 97 percent of the readings are below –0.250 V. A histogram for the eastbound travel lane in 1994 and 1997 is shown in figure 12. The half-cell readings for the westbound travel lane LMC in 1994 are shown in table 22 and in a histogram in figure 13. The readings ranged from –0.001 V to –0.307 V, and table 22 indicates 99 percent are below 0.25 V. This is similar to the eastbound LMC data and indicates a small probability of scattered corrosion occurring in the westbound travel lane.
| Potential Range (mV) | Number of Observations | Cumulative Percentage |
|---|---|---|
| 0 to –49 | 5 | 0.7 |
| –50 to –99 | 100 | 15.6 |
| –100 to –149 | 385 | 72.9 |
| –150 to –199 | 123 | 91.2 |
| –200 to –249 | 48 | 98.4 |
| –250 to –299 | 8 | 99.6 |
| –300 to –349 | 1 | 99.7 |
| –350 to –399 | 2 | 100.0 |
| –400 to –449 | 0 | 100.0 |
| –450 to –499 | 0 | 100.0 |
| –500 to –549 | 0 | 100.0 |
| Potential Range (mV) | Number of Observations | Cumulative Percentage |
|---|---|---|
| 0 to –49 | 0 | 0.0 |
| –50 to –99 | 5 | 0.8 |
| –100 to –149 | 269 | 40.8 |
| –150 to –199 | 298 | 85.2 |
| –200 to –249 | 81 | 97.3 |
| –250 to –299 | 15 | 99.6 |
| –300 to –349 | 1 | 99.7 |
| –350 to –399 | 1 | 99.8 |
| –400 to –449 | 1 | 100.0 |
| –450 to –499 | 0 | 100.0 |
| –500 to –549 | 0 | 100.0 |
| Potential Range (mV) | Number of Observations | Cumulative Percentage |
|---|---|---|
| 0 to –49 | 20 | 2.6 |
| –50 to –99 | 457 | 61.0 |
| –100 to –149 | 242 | 91.9 |
| –150 to –199 | 41 | 97.2 |
| –200 to –249 | 14 | 99.0 |
| –250 to –299 | 7 | 99.9 |
| –300 to –349 | 1 | 100.0 |
| –350 to –399 | 0 | 100.0 |
| –400 to –449 | 0 | 100.0 |
| –450 to –499 | 0 | 100.0 |
| –500 to –549 | 0 | 100.0 |
Figure 12. Histogram of half-cell potential readings for U.S. 52 eastbound travel lane LMC in 1994 and 1997.
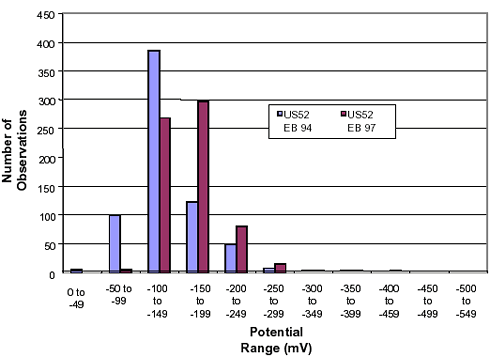
Figure 13. Histogram of half-cell potentials for U.S. 52 westbound travel lane LMC in 1994.
The westbound passing lane SFC was studied in detail in 1997 after it was discovered that it is the only lane with the silica fume overlay. It was not studied in 1994. The corrosion potential readings shown in table 23 range from –0.065 V to –0.360 V and almost 97 percent of the readings are less than –0.250 V. A histogram of the readings for westbound passing lane SFC is shown in figure 14. The SFC data is similar to the LMC data and indicates a low probability of corrosion.
| Potential Range (mV) | Number of Observations | Cumulative Percentage |
|---|---|---|
| 0 to –49 | 0 | 0.0 |
| –50 to –99 | 34 | 3.8 |
| –100 to –149 | 590 | 69.7 |
| –150 to –199 | 171 | 88.8 |
| –200 to –249 | 71 | 96.8 |
| –250 to –299 | 21 | 99.1 |
| –300 to –349 | 7 | 99.9 |
| –350 to –399 | 1 | 100.0 |
| –400 to –449 | 0 | 100.0 |
| –450 to –499 | 0 | 100.0 |
| –500 to –549 | 0 | 100.0 |
Figure 14. Histogram of half-cell potentials for U.S. 52 westbound passing lane SFC in 1997.
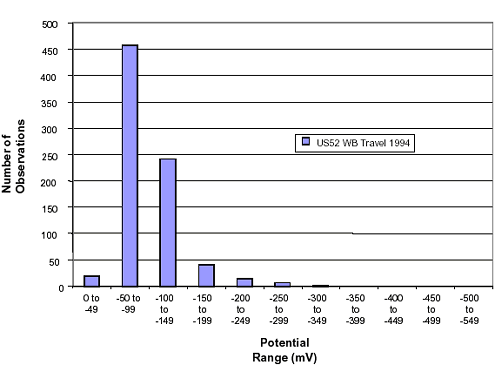
Figure 15. Equipotential map of half-cell potentials for eastbound travel lane U.S. 52 in 1997 (latex-modified concrete).
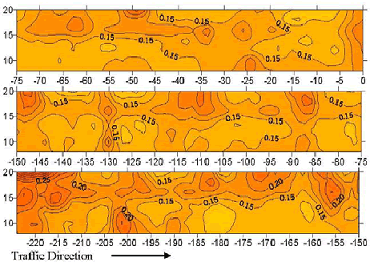
Figure 16. Equipotential map of half-cell potentials for westbound passing lane of U.S. 52 in 1997 (silica fume concrete).
Polarization resistance tests were performed at five locations on the eastbound bridge and four locations on the westbound bridge in 1994. All nine locations were located in the travel lanes. At the time it was thought the westbound travel lane had a silica fume concrete overlay and the eastbound travel lane had a latex-modified concrete overlay but it was discovered both travel lanes had a latex-modified overlay. The test locations on the eastbound travel lane were chosen from two low-potential areas (–0.109 V and –0.115 V), one moderate-potential area (–0.130 V), and two high-potential areas (–0.224 V and –0.200 V). Simulated 3LP tests were also performed at each of the test locations. The PR testing was slightly more successful than the 3LP testing, with four of the five locations being tested successfully. Only three of the five locations were successfully tested using the 3LP technique. One test spot could not be successfully tested using either technique. The results of the testing are summarized in table 24. The corrosion rate measurements were generally low.
| Grid Location | Equilibrium Potential (mV)* | PR Testing | 3LP Testing | ||
|---|---|---|---|---|---|
| Rp (ohm) | Icorr (mA/cm2) | Rp (ohm) | Icorr (mA/cm2) | ||
| B110 | –0.224 | – | – | – | – |
| B19 | –0.109 | 339 | 0.064 | 200 | 0.108 |
| C10 | –0.115 | 429 | 0.050 | 417 | 0.052 |
| C20 | –0.130 | 232 | 0.093 | 517 | 0.042 |
| D110 | –0.200 | 449 | 0.048 | – | – |
*Measured using a Cu/CuSO4 reference electrode.
The test locations on the westbound travel lane were chosen from two medium-potential areas and two low-potential areas. Simulated 3LP tests were also performed at each of the test locations. The PR and 3LP testing was generally successful on the westbound structure, with all four locations being successfully tested using both techniques. The results of the testing are summarized in table 25.
| Grid Location | Equilibrium Potential (mV)* | PR Testing | 3LP Testing | ||
|---|---|---|---|---|---|
| Rp (ohm) | Icorr (mA/cm2) | Rp (ohm) | Icorr (mA/cm2) | ||
| B100 | –0.135 | 395 | 0.055 | 174 | 0.125 |
| C110 | –0.146 | 330 | 0.065 | 275 | 0.076 |
| F10 | –0.064 | 705 | 0.031 | 253 | 0.085 |
| F27 | –0.099 | 286 | 0.076 | 225 | 0.097 |
*Measured using a Cu/CuSO4 reference electrode.
All of the corrosion rates were similar and low. This confirms the general indication given by the half-cell potential measurements. The agreement between the corrosion rates estimated using the two techniques was generally good, with all of the estimates within a factor of 2 or 3. In 1997, linear polarization measurements were performed on the eastbound travel lane LMC-III and the westbound passing lane SFC. Tests were made at locations with high, medium, and low corrosion potentials. The testing was performed using a James Instruments GECOR 6 Polarization Resistance Tester. The results of the testing for both the eastbound travel and the westbound passing lanes are shown in table 26. The corrosion rates were moderate and are higher in 1997 than in 1994 LMC. There is no appreciable difference in the corrosion rates between the two types of overlay.
| Direction | Grid Location | Half-Cell Potential (mV) | Measured Corrosion Rate (μA/cm2) | Notes |
|---|---|---|---|---|
| Eastbound Travel LMC | B10 | –129 | 0.137 | Low potential, wheel path |
| D98 | –139 | 0.135 | Low potential, wheel path | |
| C68 | –185 | 0.160 | Centerline | |
| C108 | –183 | 0.173 | Centerline | |
| B110 | –199 | 0.232 | Centerline, cracks | |
| D34 | –264 | 0.232 | – | |
| Westbound Passing SFC | F38 | –202 | 0.160 | – |
| C60 | –133 | 0.078 | Shoulder, not confined | |
| D38 | –315 | 0.114 | Delam in base concrete, not confined | |
| D102 | –97 | 0.179 | Low potential | |
| H110 | –337 | 0.132 | At edge of delam | |
| H110 | –378 | 0.145 | Over delam | |
| E120 | –97 | 0.175 | Centerline | |
| G180 | –139 | 0.086 | Wheelpath |
Concrete cores were taken through the overlays in 1994 and 1997. They were inspected to determine the overlay thickness and the cover over the uppermost reinforcing bars. The overlay thickness on the eastbound and westbound travel lanes, which are both latex-modified concrete, ranges from 25 to 50 mm (1 to 2 inches). The clear cover above the reinforcing steel ranges from 76 to 102 mm (3 to 4 inches). In 1994, three of the cores removed from the westbound travel lane and three cores removed from the eastbound travel lane were tested to determine their bond strength in direct shear.
The results of the testing are shown in table 27. All of these cores have the latex-modified concrete overlay and there is little difference between the two spans. This is to be expected as both failed primarily in the substrate concrete, which was nominally the same in both locations. The failure of the cores primarily in the substrate concrete indicates that the surface preparation and application was excellent for the latex-modified overlay, as improper installation or poor surface preparation will typically result in failures at the bond line.
In 1997, three cores from the eastbound travel lane LMC-III and three cores from the westbound passing lane SFC were tested in shear. The results are shown in table 28. The bond strengths of the cores from the westbound passing lane SFC are less than that of the cores from the eastbound travel lane LMC, but there is significant scatter among the data. Failures occurred mainly in the substrate concrete. If the test result from the core taken in the shoulder of the eastbound lane or the core taken from the center line of the westbound lane is excluded, there is little difference between the two sections.
| Overlay Type | Core ID | Bond Strength MPa (psi) | Failure Location (percent of failure area) | ||
|---|---|---|---|---|---|
| Overlay | Bond Line | Substrate | |||
| Eastbound | 1 | 4.1(596) | 5 | 0 | 95 |
| Travel | 2 | 2.8 (407) | 10 | 0 | 90 |
| LMC | 5 | 3.6 (517) | 10 | 0 | 90 |
| Westbound | 1 | 4.9 (716) | 0 | 0 | 100 |
| Travel | 2 | 4.0 (580) | 10 | 0 | 90 |
| SFC | 3 | 3.4 (486) | 10 | 0 | 90 |
| Location and Overlay Type | Core ID | Exposure Condition | Bond Strength MPa (psi) |
|---|---|---|---|
| Eastbound Travel LMC | 3 | Wheel path | 4.7 (680) |
| 5 | Centerline | 5.9 (850) | |
| 7 | Shoulder | 7.2 (1040) | |
| Average | 5.9 (857) | ||
| Westbound Passing SFC | 3 | Shoulder | 4.9 (710) |
| 8 | Centerline | 3.2 (470) | |
| 9 | Wheel path | 5.0 (720) | |
| Average | 4.4 (633) | ||
In 1994, following the visual examination of the cores, chloride analyses were performed on six cores from the eastbound travel lane and seven cores from the westbound travel lane. Concrete slices were taken from the 12- to 25-mm (0.5- to 1-inch) depth surface region and from the 95- to 120-mm (3.75- to 4.75- inches) depth where the reinforcing bars are typically located. All of the slices were pulverized and analyzed to determine their acid-soluble chloride content. In addition to the acid-soluble chloride analyses, water-soluble chloride analyses were performed on selected samples. The test results for 1994 are shown in table 29. In 1998, chloride analyses were performed on two cores from the eastbound passing lane LMC, one core from the eastbound travel lane LMC, one core from the westbound travel lane LMC and two cores from the westbound passing lane SFC. The acid-soluble chloride contents were measured at 4 depths up to the 95-to 120-mm (3.75-to 4-inch) depth. The results are shown in table 30.
All of the locations had low to moderate chloride concentrations at the level of the reinforcing bars. The approximate threshold for chloride-induced corrosion of black reinforcing steel is approximately 0.025 percent by concrete weight, so most of the locations in the deck appear to have only marginally sufficient chloride to support corrosion. This agrees with the indication of little corrosion given by the half-cell potential and corrosion rate readings. The relatively high chloride contents at the bond line area (28 to 38 mm (1.125 to 1.5 inches)) indicate that chloride contamination of the surface of the original deck remained when the overlays were placed. Chloride ingress into the overlay concrete has occurred with time both from the surface and from the chlorides that were present in the surface region of the substrate concrete.
| Location and Overlay Type | Sample Number | Acid-Soluble Chloride Content, percent by concrete weight | Water-Soluble Chloride Content, percent by concrete weight | ||
|---|---|---|---|---|---|
| 0.5 to 1 inch | 3.75 to 4 inches | 0.5 to 1 inch | 3.75 to 4 inches | ||
| Eastbound Latex Modified | 1 | – | 0.033 | – | – |
| 2 | 0.011 | 0.036 | – | – | |
| 3 | 0.027 | 0.047 | 0.010 | 0.017 | |
| 4 | – | 0.018 | – | – | |
| 5 | 0.017 | 0.018 | – | – | |
| 6 | – | 0.024 | – | < 0.007 | |
| Westbound Latex Modified | 1 | – | 0.008 | – | – |
| 2 | – | 0.039 | – | – | |
| 4 | 0.048 | 0.025 | – | – | |
| 5 | 0.022 | 0.046 | < 0.007 | 0.018 | |
| 6 | – | 0.017 | – | < 0.007 | |
| 7 | 0.025 | 0.018 | – | – | |
| Location and Overlay Type | Acid-Soluble Chloride Content, percent by weight of concrete | |||
|---|---|---|---|---|
| 0.25 to 0.5 inch | 0.625 to 1 inch | 1.125 to 1.5 inches | 3.75 to 4 inches | |
| Eastbound Passing #1 LMC | 0.179 | 0.104 | 0.151 | 0.048 |
| Eastbound Passing #2 LMC | 0.152 | 0.139 | 0.197 | 0.090 |
| Eastbound Travel LMC | 0.109 | 0.063 | 0.089 | 0.022 |
| Westbound Travel LMC | 0.067 | 0.050 | 0.133 | 0.035 |
| Westbound Passing #1 SFC | 0.119 | 0.049 | 0.248 | 0.052 |
| Westbound Passing #2 SFC | 0.091 | 0.097 | 0.289 | 0.053 |
The SFC and LMC-III overlays were placed in April 1992. Overall, the overlays were in good condition in 1998. Each overlay has developed some delamination but the percent delaminated area is very low and less than 1 percent. Some plastic cracking is present, predominantly in the LMC-III overlays. The bond remains strong in both sections.
Half-cell potential data and corrosion rate measurements indicate a low probability of widespread corrosion. Table 31 shows the percent of potentials more positive than –250 mV, indicating the areas with a low probability of corrosion. The chloride content at the level of the reinforcing in moderately low. Some chloride ingress into the overlays was noted, however, their performance is considered very good.
| Year | NB (SFC) | SB (LMC-III) |
|---|---|---|
| 1994 | - | 98.8 |
| 1997 | 96.8 | 97.3 |

