U.S. Department of Transportation
Federal Highway Administration
1200 New Jersey Avenue, SE
Washington, DC 20590
202-366-4000
Federal Highway Administration Research and Technology
Coordinating, Developing, and Delivering Highway Transportation Innovations
 |
| This report is an archived publication and may contain dated technical, contact, and link information |
|
Publication Number: FHWA-RD-02-086 Date: August 2006 |
Previous | Table of Contents | Next
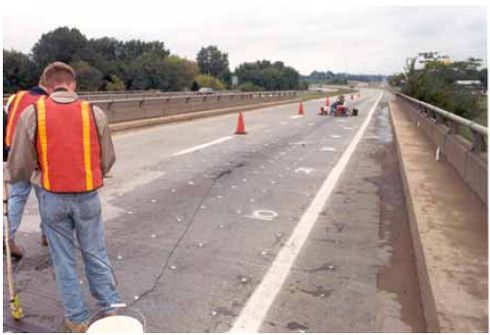
This test site consists of twin three-span (48 m (159 ft)) parallel bridges located on U.S. 41 over Kentucky State Highway at milepost 12 on the Henderson City bypass route. The three spans are each 16 m (53 ft) long. The spans are of composite deck/girder construction. The bridges were constructed in 1959, and a low-slump concrete overlay was placed on the decks in the mid-1970's. In 1992, an inspection by State forces indicated that the overlays were mapcracked and exhibiting considerable wear. The deck had also been patched numerous times and the patches were noted to be deteriorating. Because of the deck condition, the bridges were scheduled for overlay. A LMC-III overlay was applied to the northbound lanes, figure 23, and a SFC overlay was applied to the southbound lanes, figure 24.
Figure 23. Photograph of northbound test section of U.S. 41 (latex-modified concrete overlay).
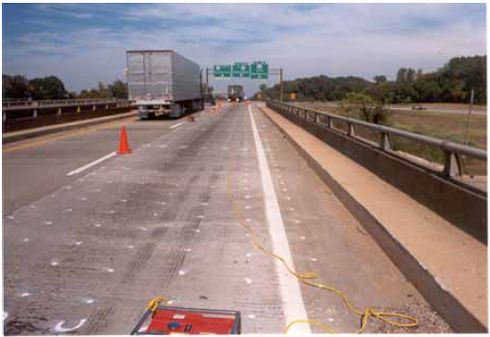
Figure 24. Photograph of southbound test section of U.S. 41 (silica fume concrete overlay).
The concrete materials and proportions, as reported in the C-206 report, are as follows: materials selected for the LMC-III mix consisted of a Type III cement; an angular to rounded siliceous natural sand having specific gravity of 2.61 and an absorption of 1.00 percent; and a crushed limestone coarse aggregate having a maximum top size of 12 mm (0.5 inch) with a specific gravity of 2.71 and an absorption of 0.7 percent. The latex used was DPS Modifier A, a styrene-butadiene latex emulsion.
A Type I cement was used in the SFC mix. Aggregates were from the same sources used for the LMC-III mix at this site. Admixtures included: (1) MB-SF silica fume (compacted powder form); (2) Micro-Air, a synthetic air-entraining agent; and (3) Rheobuild-1000, a Type F high-range water reducing admixture. The mixture proportions and plastic concrete characteristics, as reported in the C-206 report, are shown in table 46.
| Material | LMC-III | SFC |
|---|---|---|
| Cement (lb/yd3) | 658 (Type III) | 658 (Type I) |
| Fine Aggregate (lb/yd3) | 1610 | 1366 |
| Coarse Aggregate (lb/yd3) | 1260 | 1536 |
| Water (lb/yd3) | 260 | 236 |
| Latex Modifier (gal/yd3) | 24.5 | - |
| Silica Fume (lb/yd3) | - | 50 |
| HRWRA (oz/yd3) | - | 98 |
| AEA (oz/yd3) | - | 8 |
| W/C ratio | 0.39 | 0.33 |
| Air content (percent) | 6.0 | 5.6 |
| Slump (inches) | 6.5 | 3.8 |
| Temperature (°F) | 77 | 75 |
| Unit Weight (lb/ft3) | 138.0 | 140.8 |
| Placement Date | 8/13/92 | 7/8/92 |
| Placement Time | 19:35 | 21:15 |
| Weather Conditions | Clear | Clear |
| 1 lb/yd3 = .347 kg/m31 1 inch = 25.4 mm 1 gal/yd3 = 5 l/m |
1 oz/yd3 = .037 kg/m3 (°F - 32/1.8) = °C 1 lb/ft3 = 16 kg/m3 |
The SFC was placed on the southbound structure on the night of July 8, 1992. The night placement was in compliance with State specifications. The SFC concrete was delivered in transit-mix trucks. The bonding grout was noted to be applied unevenly, and in some cases the mortar was brushed out of the concrete in lieu of a grout. Mr. Robbie Hecker of the Kentucky Transportation Cabinet told the contractor that on the first span, the bonding grout was spread too far ahead of the paver during placement. This resulted in its possible drying before the overlay concrete was placed. The placement of the second span proceeded normally. The concrete placed on the third span had a high slump of 190 to 200 mm (7.5 to 8.0 inches). This resulted in possible segregation, bleeding, and finishing problems with the concrete. After the overlay was placed, the surface was textured with a stiff-broom finish. The concrete was cured by covering with wet burlap and polyethylene immediately following the finishing operation. Soaker hoses were used to maintain the deck in a saturated condition for the full 72-hour curing period. The SFC overlay was opened to traffic on July 20, 1992, 12 days after casting.
The LMC-III overlay was not placed on the northbound structure until August 13, 1992. The concrete was delivered using mobile concrete mixers. Similarly to the SFC overlay site, there was a nonuniform application of the bonding grout brushed out of the concrete. The surface was finished in the same manner as the SFC deck. The curing was also the same as for the SFC overlay, except that the moist curing was carried out for only 24 hours. The section was opened to traffic on August 18, five days after placement.
The underside of the two bridges was inspected each year while the traffic control was being set up. The underside of the deck was in good condition except for rust, spalls, and leakage at the joints. The substructure was showing signs of deterioration, especially at the bent caps. The bent caps were cracked, spalled, and corrosion stained. Many of the cracks were part of full map patterns with associated efflorescence. Horizontal cracks were also noted in the pier caps. The bearing blocks in the abutments were cracked and spalled.
Horizontal cracks in the bridge beams were seen in the exterior beams of both bridges near the abutments. The structures have six integrally cast concrete beams, with joints between the three simple spans. The beams do not sit on bearing pads, instead tie to integral diaphragms that are keyed into the pier caps. The piers of both structures were in moderate to poor condition, with large cracks, spalls, corrosion products, and efflorescence stains present. Some horizontal cracking, staining, and efflorescence was seen in the south abutment of the northbound structure.
The underside of the deck of the northbound structure was mainly crack-free although some fine transverse cracking could be seen on the underside of the deck near the southern abutment where closer examination was possible. The underside of the deck of the southbound structure was in similar condition.
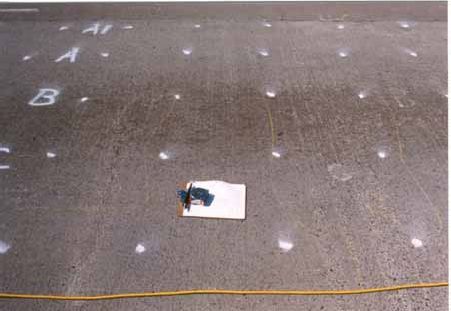
Inspection of the deck surface of the northbound LMC structure indicated the performance of the three spans was quite different, with Spans 1 and 3 exhibiting heavy transverse and longitudinal cracking and Span 2 exhibiting hardly any cracking. Figure 25 shows typical cracking on the northbound deck. Over the last two years of the study the cracking became worse. Several cracks had lengthened or were becoming interconnected with other cracks. The surface of all three spans in the driving lane was heavily abraded compared to that of the passing lane.
Figure 25. Photograph showing typical cracking found in the northbound deck of the U.S. 41 test section LMC.
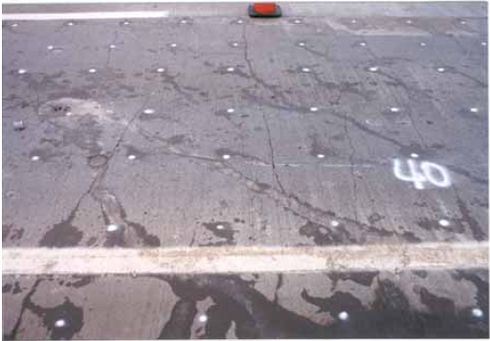
Inspection of the deck of the southbound SFC structure revealed the three spans also performing differently. Span 1 was different than Spans 2 and 3 due to its many large and raveled cracks. Many of the cracks increased in length or joined nearby cracks over the five years of the study. In Spans 2 and 3, many of the newer cracks were longitudinal but a few transverse cracks also developed. Span 3 was more heavily cracked than Span 2. In the last year of the study, many of the cracks in the two spans that earlier were only visible after a rainstorm, were now plainly visible when the deck was dry. Figure 26 shows some typical cracking associated with the southbound test section.
The delamination surveys were performed using a chain drag. The integrally cast beams made defining the edges of the delaminated areas difficult as the sound of the chains varied over the beams. Hammer tapping with a dry sand was also used to define the edges of the delaminated areas. The results of the delamination survey for all 5 years are shown in tables 47 and 48. The number and area of delaminations in each span is given because there are considerable differences between the different spans of each test section.
The southbound test section SFC is performing well. No delaminations were found in any of the spans in 1994 or 1995 and the center span had no delaminations found in any year of the study. The total delaminated area of all three areas is 6.59 m2 (71 ft2), 3.72 percent of the total area. The northbound LMC test section performed much worse than the southbound SFC section. All three spans of the northbound structure had delaminations in the first year of the study (1994). The center span is performing the best with only 4.46 m2 (48 ft2) square meters or 7.55 percent of the area delaminated. The two end spans are performing much worse with 16.40 m2 (176 ft2) (27.8 percent) and 11.47 m2 (123 ft2) (19.4 percent) of the surface area delaminated.
Figure 26. Photograph showing typical cracking associated with the southbound test section of U.S. 41 SFC.
| Year | Span Number | Number of Areas | Total Area (m2) | Percent of Total Area |
|---|---|---|---|---|
| 1994 | All | 0 | 0.00 | 0.00 |
| 1995 | All | 0 | 0.00 | 0.00 |
| 1996 | 1 2 3 |
7 0 2 |
0.70 0.00 0.14 |
1.18 0.00 0.24 |
| Total | 9 | 0.84 | 0.47 | |
| 1997 | 1 2 3 |
18 0 8 |
1.67 0.00 0.60 |
2.82 0.00 1.02 |
| Total | 26 | 2.27 | 1.28 | |
| 1998 | 1 2 3 |
30 0 9 |
4.92 0.00 1.67 |
8.32 0.00 2.82 |
| Total | 39 | 6.59 | 3.72 |
| Year | Span Number | Number of Areas | Total Area (m2) | Percent of Total Area |
|---|---|---|---|---|
| 1994 | 1 2 3 |
2 1 3 |
0.37 0.18 1.02 |
0.63 0.30 1.72 |
| Total | 6 | 1.57 | 0.88 | |
| 1995 | 1 2 3 |
14 5 19 |
2.60 0.46 2.50 |
4.40 0.78 4.23 |
| Total | 38 | 5.56 | 3.14 | |
| 1996 | 1 2 3 |
21 8 28 |
4.78 0.88 3.90 |
8.09 1.49 6.60 |
| Total | 57 | 9.56 | 5.39 | |
| 1997 | 1 2 3 |
27 11 31 |
10.36 1.53 5.57 |
17.53 2.59 9.42 |
| Total | 69 | 17.46 | 9.85 | |
| 1998 | 1 2 3 |
19 14 32 |
16.40 4.46 11.47 |
27.75 7.55 19.41 |
| Total | 65 | 32.33 | 18.24 |
The number of delaminations increased each year on the southbound structure from 0 in 1994 to 39 in 1998. On the northbound structure, the number of delaminations increased from 6 in 1994 to 69 in 1997 then decreased to 65 in 1998. This decrease was because several delaminated areas merged together to form larger delaminations.
A 0.6-m (2-ft) grid was marked out beginning at the approach end of the bridges. The longitudinal rows of points were numbered from 1 to 26 from the approach side to the leave side. The transverse rows were lettered A to F, beginning approximately at the paint stripe separating the travel lane from the passing lane. Each span was numbered independently. The half-cell potentials were measured at every point of the 0.6 m (2 ft) grid spacing over both entire bridges.
A summary of the half-cell potential measurements for the southbound travel lane SFC of the U.S. 41 test section in 1994 is shown in table 49. Span 1 had the most negative (corrosive) halfcell potentials of the three spans. The most negative measurement was –389 mV and the least negative was –71 mV. The average half-cell measurement for Span 1 was –201 mV compared to –28 mV for Span 2 and –84 mV for Span 3. Span 2 had 54 half-cell readings out of 189 that were positive. The most positive reading was +74 mV. For tabulation, the positive half-cell measurements were classified as 0 mV. Overall, the southbound SFC test section was in good condition in 1994. For Span 1, 76 percent of the half-cell readings were less negative than –250 mV. This compares to 100 percent for Span 2 and 98.4 percent for Span 3. Overall, 91 percent of the measurements were less negative than –250 mV. A histogram of the distribution of half-cell measurements for the three spans in 1994 is shown in figure 27. Span 1 has clearly shifted more negative (corrosive) compared to the other two spans.
| Potential Range (mV) | Number of Observations | Cumulative Percentage | |||
|---|---|---|---|---|---|
| Span 1 | Span 2 | Span 3 | Total | ||
| 0 to –49* | 0 | 140 | 53 | 193 | 34.0 |
| –50 to –99 | 9 | 39 | 81 | 129 | 56.8 |
| –100 to –149 | 32 | 5 | 35 | 72 | 61.6 |
| –150 to –199 | 67 | 4 | 13 | 84 | 84.3 |
| –200 to –249 | 35 | 1 | 4 | 40 | 91.4 |
| –250 to –299 | 27 | 0 | 3 | 30 | 96.6 |
| –300 to –349 | 15 | 0 | 0 | 15 | 99.3 |
| –350 to –399 | 4 | 0 | 0 | 4 | 100.0 |
| –400 to –449 | 0 | 0 | 0 | 0 | 100.0 |
| –450 to –499 | 0 | 0 | 0 | 0 | 100.0 |
| –500 to –549 | 0 | 0 | 0 | 0 | 100.0 |
| –550 to –599 | 0 | 0 | 0 | 0 | 100.0 |
| –600 to –649 | 0 | 0 | 0 | 0 | 100.0 |
| –650 to –699 | 0 | 0 | 0 | 0 | 100.0 |
* Note. Any positive reading is counted as 0 for tabulation.
Figure 27. Histogram of half-cell potential readings for U.S. 41 southbound in 1994 SFC.
A summary of the half-cell measurements for the southbound structure in 1997 is shown in table 50. The half-cell measurements were more negative for all three spans in 1997 than in 1994. Span 1 had an average reading of 258 mV with a maximum negative reading of −435 mV and a minimum negative reading of -134 mV. Span 2 had an average of -108 mV with a maximum of −305 mV and a minimum of −19 mV. Span 3 had an average reading of −142 mV with a maximum of −383 mV and a minimum of −16 mV. The average half-cell reading for Span 1 was above the 250 mV threshold for corrosion to occur. A histogram comparing the distribution of half-cell readings for the southbound section in 1997 is shown in figure 28. A histogram comparing the distribution of half-cell measurements for the entire southbound test section in 1994 and 1997 is shown in figure 29. The curve for 1997 is shifted significantly to the right which indicates a probability of increased corrosion activity, especially in Span 1.
A summary of the half-cell potential readings for the northbound LMC spans in 1994 is shown in table 51. Span 3 has higher magnitude half-cell readings than the other two spans. The average half-cell potential reading for Span 3 was -281 mV, compared to −235 mV for Span 1, and −171 mV for Span 2. The average for Span 3 was over the threshold limit of 250 mV needed for corrosion. The maximum half-cell potential for Span 3 is −499 mV, for Span 1 is −425 mV, and for Span 2 is −320 mV. All three spans had half-cell potentials indicative of corrosion occurring in the deck. A histogram of the distribution of half-cell potentials for the northbound LMC spans in 1994 is shown in figure 30. Span 3 had the most negative potentials (most corrosive).
A summary of the half-cell potentials for the northbound LMC spans in 1997 is shown in table 52. Span 3 again has higher negative half-cell potentials than the other two spans. The average half-cell potential for Span 3 is −299 mV, compared to −249 mV for Span 1, and −193 mV for Span 2. The average potential for Span 3 is over the threshold limit of 250 mV and the average for Span 1 is right at the threshold limit. The maximum half-cell potential for Span 3 is −652 mV, for Span 1 is −496 mV, and for Span 2 is −473 mV.
| Potential Range (mV) | Number of Observations | Cumulative Percentage | |||
|---|---|---|---|---|---|
| Span 1 | Span 2 | Span 3 | Total | ||
| 0 to –49* | 0 | 8 | 3 | 11 | 1.9 |
| –50 to –99 | 0 | 101 | 39 | 140 | 26.6 |
| –100 to –149 | 4 | 53 | 82 | 139 | 51.4 |
| –150 to –199 | 45 | 15 | 41 | 101 | 69.0 |
| –200 to –249 | 43 | 5 | 8 | 56 | 78.8 |
| –250 to –299 | 47 | 6 | 6 | 59 | 89.2 |
| –300 to –349 | 25 | 1 | 6 | 32 | 94.9 |
| –350 to –399 | 18 | 0 | 4 | 22 | 98.8 |
| –400 to –449 | 7 | 0 | 0 | 7 | 100.0 |
| –450 to –499 | 0 | 0 | 0 | 0 | 100.0 |
| –500 to –549 | 0 | 0 | 0 | 0 | 100.0 |
| –550 to –599 | 0 | 0 | 0 | 0 | 100.0 |
| –600 to –649 | 0 | 0 | 0 | 0 | 100.0 |
| –650 to –699 | 0 | 0 | 0 | 0 | 100.0 |
* Note. Any positive reading is counted as 0 for tabulation.
Figure 28. Histogram of half-cell potential readings for U.S. 41 southbound in 1997 SFC.
Figure 29. Histogram of half-cell potential readings for U.S. 41 southbound SFC in 1994 and 1997.
| Potential Range (mV) | Number of Observations | Cumulative Percentage | |||
|---|---|---|---|---|---|
| Span 1 | Span 2 | Span 3 | Total | ||
| 0 to –49* | 0 | 0 | 0 | 0 | 0 |
| –50 to –99 | 0 | 6 | 0 | 6 | 1.0 |
| –100 to –149 | 7 | 55 | 0 | 62 | 12.0 |
| –150 to –199 | 54 | 78 | 12 | 144 | 37.4 |
| –200 to –249 | 62 | 43 | 63 | 168 | 67.0 |
| –250 to –299 | 37 | 5 | 57 | 99 | 84.5 |
| –300 to –349 | 17 | 2 | 21 | 40 | 91.5 |
| –350 to –399 | 11 | 0 | 19 | 30 | 96.8 |
| –400 to –449 | 1 | 0 | 11 | 12 | 98.9 |
| –450 to –499 | 0 | 0 | 6 | 6 | 100.0 |
| –500 to –549 | 0 | 0 | 0 | 0 | 100.0 |
| –550 to –599 | 0 | 0 | 0 | 0 | 100.0 |
| –600 to –649 | 0 | 0 | 0 | 0 | 100.0 |
| –650 to –699 | 0 | 0 | 0 | 0 | 100.0 |
*Note. Any positive reading is counted as 0 for tabulation.
Figure 30. Histogram of half-cell potential readings for U.S. 41 northbound LMC in 1994.
| Potential Range (mV) | Number of Observations | Cumulative Percentage | |||
|---|---|---|---|---|---|
| Span 1 | Span 2 | Span 3 | Total | ||
| 0 to –49* | 0 | 0 | 0 | 0 | 0 |
| –50 to –99 | 0 | 5 | 0 | 5 | 0.9 |
| –100 to –149 | 18 | 33 | 0 | 51 | 9.9 |
| –150 to –199 | 44 | 71 | 18 | 13 | 33.3 |
| –200 to –249 | 49 | 64 | 47 | 160 | 61.6 |
| –250 to –299 | 33 | 9 | 47 | 89 | 77.2 |
| –300 to –349 | 14 | 4 | 38 | 56 | 87.1 |
| –350 to –399 | 20 | 1 | 10 | 31 | 92.6 |
| –400 to –449 | 5 | 1 | 14 | 20 | 96.1 |
| –450 to –499 | 6 | 1 | 8 | 15 | 98.8 |
| –500 to –549 | 0 | 0 | 5 | 5 | 99.6 |
| –550 to –599 | 0 | 0 | 1 | 1 | 99.8 |
| –600 to –649 | 0 | 0 | 0 | 0 | 99.8 |
| –650 to –699 | 0 | 0 | 1 | 1 | 100.0 |
* Note. Any positive reading is counted as 0 for tabulation.
All three spans have a considerable number of half-cell readings above the −250 mV threshold for corrosion. A histogram of the half-cell potential readings for the northbound spans in 1997 is shown in figure 31. A histogram of the half-cell potential readings for the entire northbound structure in 1994 and 1997 is shown in figure 32. The distribution appears similar but the curve for 1997 is shifted to the right, indicating a probability of increased corrosion.
A cumulative frequency diagram for both test sections of U.S. 41 is shown in figure 33. The figure shows the shift to the right for both test sections. The shift in the curve for the southbound SFC spans is much greater than that for the northbound spans LMC. However, the northbound spans LMC had more negative values both initially and at the end of the study than the southbound SFC spans. An equipotential map of the half-cell readings for the southbound spans SFC of U.S. 41 is shown in figure 34. The figure for Span 1 indicates there is corrosion occurring along the edge between the travel and passing lane and at the two ends of the span. The figures for Span 2 and Span 3 indicate corrosion is occurring in isolated areas and also at the ends of the spans. An equipotential map for the half-cell readings for the northbound spans LMC is shown in figure 35. The maps for Span 1 and Span 3 indicate corrosion occurring over much of both spans and especially along the edge between the travel and passing lanes. The map for Span 2 indicates isolated areas of corrosion but most areas are at the ends of the span.
Figure 31. Histogram of half-cell potential readings for U.S. 41 northbound LMC in 1997.
Figure 32. Histogram of half-cell potential readings for U.S. 41 northbound spans in 1994 and 1997.
Figure 33. Cumulative frequency diagram for U.S. 41 (NB and SB) for years 1994 and 1997.
Figure 34. Equipotential maps of half-cell potentials for the three spans of the southbound test section of U.S. 41 in 1997 SFC.
Figure 35. Equipotential maps of half-cell potentials for the three spans of the northbound test section of U.S. 41 in 1997 LMC.
In 1994, the PR tests were performed using an EG&G PARC model 273A potentiostat under computer control. The PR scans were performed using IR compensation at each step to determine and correct for the potential drop due to the concrete resistance. The PR scans started at a potential 10 mV below the equilibrium "rest" potential of the area under test and continued to a potential 10 mV above the equilibrium potential. Following the testing, the polarization resistances were determined by fitting a line to the recorded potential versus current plots. Using the polarization resistances, the corrosion rates were estimated by assuming Tafel slopes of 0.12, assuming that the upper bars were size No. 4, and assuming that the upper half of the reinforcing bar directly under the counter electrode was polarized during the testing. Simulated 3LP tests were also performed at each of the test locations.
Following the half-cell potential testing, PR tests were performed at six locations on the southbound SFC spans. Two test locations were located on each span. The test locations on Span 2 had relatively low potentials while the locations on Spans 1 and 3 had moderate potentials. The PR and 3LP testing was generally more successful on the southbound SFC structure than on the northbound LMC structure. The results of the testing are summarized in table 53. On the southbound SFC structure, the corrosion rate measurements were not in general agreement with the half-cell potential measurements. The highest corrosion rates did not necessarily correspond to the most negative potentials. The agreement between the corrosion rates estimated using the two techniques was encouraging, as all of the estimates were within a factor of 2 or 3, which would generally be considered good using these techniques. Polarization resistance tests were also performed at six locations on the northbound LMC bridge. Two test locations were selected from each span. Only two of the six locations were successfully tested using the 3LP technique. The results of the testing are summarized in table 54.
| Grid Location | Equilibrium | PR Testing | 3LP Testing | ||
|---|---|---|---|---|---|
| Potential (mV)* | Rp (ohm) | Icorr (mA/cm2) | Rp(ohm) | Icorr(mA/cm2) | |
| Span 1, B4 | –272 | 397 | 0.054 | 2571 | 0.008 |
| Span 1, F4 | –167 | 594 | 0.037 | 2449 | 0.009 |
| Span 2, E5 | –46 | 375 | 0.057 | 1587 | 0.013 |
| Span 2, D4 | –74 | - | - | 297 | 0.073 |
| Span 3, D11 | –130 | 732 | 0.03 | 489 | 0.044 |
| Span 3, E11 | –146 | 200 | 0.108 | 243 | 0.089 |
* Measured using a Cu/CuSO4 reference electrode.
| Grid Location | Equilibrium Potential (mV)* | PR Testing | 3LP Testing | ||
|---|---|---|---|---|---|
| Rp (ohm) | Icorr(mA/cm2) | Rp (ohm) | Icorr(mA/cm2) | ||
| Span 1, C22 | –251 | 475 | 0.046 | - | - |
| Span 1, E22 | –160 | 247 | 0.087 | 127 | 0.170 |
| Span 2, C30 | –320 | 26 | 0.834 | - | - |
| Span 2, A30 | –205 | - | - | - | - |
| Span 3, D48 | –315 | 400 | 0.054 | 145 | 0.150 |
| Span 3, B48 | –343 | 449 | 0.048 | - | - |
* Measured using a Cu/CuSO4 reference electrode.
The corrosion rate measurements were not in general agreement with the half-cell potential measurements, as the most negative potentials were associated with some of the lowest corrosion rates. The location with the least-negative potential, point A30, could not be successfully measured using either the polarization resistance or the 3LP technique. The very high corrosion rate observed at point C30 does not agree with the observed condition of the bridge.
In 1997, linear polarization measurements were performed at six locations on each structure. On each structure three locations were selected on Span 1, one was chosen on Span 2 and two were chosen on Span 3. More locations were chosen on Span 1 of each bridge because the half-cell potentials were generally higher. The testing was performed using a James Instruments GECOR 6 Polarization Resistance Tester. The results of the testing for both the southbound travel lane SFC and the northbound travel lane LMC-III are shown in table 55. There is considerable scatter in the corrosion rate measurements for both sections in 1997 but the corrosion rate measurements within a span generally coincide with the half-cell potentials within that span. Corrosion rates varied from low to moderately high on the SFC overlay and from low to moderately low on the LMC-III overlay.
| Direction | Span | Grid Location | Half-Cell Potential (mV) | Measured Corrosion Rate (µA/cm2) | Notes |
|---|---|---|---|---|---|
| Southbound Travel SFC | 1 | A40 | –348 | 0.147 | More negative potential |
| 1 | EF40 | –218 | 0.930 | Not confined, moderate potential | |
| 1 | C20 | –161 | 2.368 | Not confined | |
| 2 | C50 | –134 | 0.056 | Moderate potential | |
| 3 | A10 | –154 | 0.042 | Moderate potential | |
| 3 | EF10 | –193 | 0.069 | Moderate potential | |
| Northbound Travel LMC-III | 1 | E17 | –362 | 0.079 | Relatively high potential |
| 1 | BC9 | –197 | 0.022 | Two locations at same grid point, | |
| 1 | BC9 | –197 | 0.022 | Different concrete | |
| 2 | G50 | –291 | 0.146 | Moderately high potential | |
| 3 | DE20 | –162 | 0.004 | Low potential | |
| 3 | G29 | –293 | 0.039 | High potential |
The cores were inspected to determine the overlay thickness and the cover over the uppermost reinforcing bars. The thickness of the silica fume concrete overlay on the southbound structure ranged from 25 to 100 mm (1 to 4 inches) and the depth to the top mat of reinforcing steel ranged from 65 to 90 mm (2.5 to 3.5 inches). The thickness of the latex-modified concrete overlay on the northbound structure ranged from 0.75 to 3.25 inches (19 to 83 mm) and the depth to steel ranged from 65 to 95 mm (2.5 to 3.75 inches). In 1994, three cores from each structure were tested for bond strength. The results are shown in table 56. The test results for northbound cores LMC are higher than the cores from the southbound structure SFC. The cores from the northbound LMC structure have a higher percentage of the failure occurring in the base concrete. Generally the bond strength of all the cores is quite high. This indicates both overlays were well bonded to the base concrete in 1994.
| Overlay Type | Core ID | Bond Strength MPa (psi) | Failure Location (Percent of Failure Area) | ||
|---|---|---|---|---|---|
| Overlay | Bond Line | Substrate | |||
| Southbound Travel SFC | 2 | 3.9 (574) | 50 | 0 | 50 |
| 4 | 2.6(384) | 25 | 25 | 50 | |
| 5 | 3.9 (565) | 40 | 10 | 50 | |
| Northbound Travel LMC | 3 | 4.9 (716) | 40 | 0 | 60 |
| 5 | 4.5 (649) | 0 | 5 | 95 | |
| 7 | 4.4 (645) | 20 | 0 | 80 | |
In 1997, four cores from the southbound travel lane and three cores from the northbound travel lane were tested in shear. The results are shown in table 57. The average bond strength of the cores from the northbound travel lane LMC is slightly higher than that of the cores from the southbound travel lane SFC but the bond strength of all the cores is very good. This indicates that away from delaminations both overlays were still well bonded to the base concrete in 1997.
| Location and Overlay Type | Core ID | Exposure Condition | Bond Strength MPa (psi) |
|---|---|---|---|
| Southbound Travel SFC | 4 | Wheel path | 3.0 (430) |
| 5 | Wheel path | 3.6 (530) | |
| 6 | Wheel path | 4.0 (580) | |
| 7 | Wheel path | 4.7 (680) | |
| Average | 3.8 (555) | ||
| Northbound Travel LMC-III | 2 | Wheel path | 5.2 (750) |
| 3 | Centerline | 4.5 (650) | |
| 10 | Wheel path | 3.4 (490) | |
| Average | 4.3 (630) | ||
Following the visual examination of the cores, chloride analyses were performed on six cores taken from each overlay in 1994. The samples were taken from the 12- to 25-mm (0.5- to 1-inch) depth surface region and from the 70- to 89-mm (2.75- to 3.5-inch) depth where the reinforcing bars would have been located. All of the slices were then pulverized and analyzed to determine their acid-soluble chloride content. In addition to the acid-soluble chloride analyses, watersoluble chloride analyses were performed on selected samples. The results of the testing are shown in table 58. The levels of chloride in the overlays are generally very low and the levels in the northbound LMC overlay may be slightly higher than in the southbound SFC overlay.
| Overlay Location and Type | Sample Number | Acid-Soluble Chloride Content, percent by concrete weight | Water-Soluble Chloride Content, percent by concrete weight | ||
|---|---|---|---|---|---|
| 0.5 to 1 inch | 2.75 to 3.5 inches | 0.5 to 1 inch | 2.75 to 3.5 inches | ||
| Southbound Silica Fume | S1 | < 0.007 | 0.025 | < 0.007 | 0.013 |
| S5 | 0.007 | < 0.007 | - | - | |
| S6 | - | < 0.007 | - | < 0.007 | |
| S7 | < 0.007 | <0.007 | - | - | |
| S8 | 0.014 | 0.012 | - | - | |
| S9 | - | < 0.007 | - | - | |
| Northbound LMC-III | N4 | - | 0.061 | - | - |
| N5 | - | 0.045 | - | - | |
| N6 | 0.039 | 0.008 | - | - | |
| N7 | < 0.007 | 0.037 | - | - | |
| N8 | 0.010 | 0.017 | - | - | |
| N9 | - | 0.017 | - | 0.011 | |
All of the locations had low chloride concentrations at the level of the reinforcing bars, except for samples N 4 and N 5. The approximate threshold for chloride-induced corrosion of black reinforcing steel is approximately 0.025 percent by concrete weight, so most of the locations in the deck do not appear to have sufficient chloride to support corrosion.
In 1998, chloride water-soluble chloride contents were measured in five locations in the southbound SFC overlay and six locations in the northbound LMC overlay. The results are shown in table 59. The chloride levels down to a 25-mm (1-inch) depth in 1998 are elevated in the northbound LMC structure where many of the locations now have chloride levels above the 0.025 percent threshold. The acid-soluble chloride content was also measured on one core from each structure. The results are shown in table 60. The chloride level generally decreases with depth.
| Location and Overlay Type | Water-Soluble Chloride Content, percent by weight of concrete | |||
|---|---|---|---|---|
| 0.25 to 0.5 inch | 0.625 to 1 inch | 1.125 to 1.5 inches | 2.75 to 3.25 inches | |
| Southbound SFC | 0.005 | 0.004 | < 0.004 | 0.009 |
| - | < 0.004 | - | - | |
| - | 0.004 | - | - | |
| 0.118 | 0.017 | 0.018 | 0.020 | |
| - | 0.012 | - | - | |
| Northbound LMC | 0.139 | 0.096 | 0.060 | 0.044 |
| - | 0.031 | - | - | |
| 0.116 | 0.059 | 0.030 | 0.024 | |
| - | 0.077 | - | - | |
| 0.041 | 0.012 | < 0.007 | 0.011 | |
| - | < 0.007 | - | - | |
| Location and Overlay Type | Acid-Soluble Chloride Content, percent by weight of concrete | |||
|---|---|---|---|---|
| 0.25 to 0.5 inch | 0.625 to 1 inch | 1.125 to 1.5 inches | 3.75 to 4 inches | |
| Southbound SFC | 0.048 | 0.010 | 0.035 | < 0.007 |
| Northbound LMC | 0.070 | 0.010 | < 0.007 | < 0.007 |
The SFC and LMC-III overlays were placed in July and August 1992, respectively. Concern on the application of the bonding agent on Span 1 of the SFC and on the LMC-III overlays was expressed by State inspectors. Span 1 of the SFC overlay developed many large cracks. Spans 1 and 3 of the LMC-III overlay exhibited heavy transverse and longitudinal cracks while Span 2 had little cracking. Cracking generally increased with time. Delamination of the various spans within each test section, varied, with more delamination occurring in the end spans and less occurring in the center spans. The center span of the SFC overlay had no delaminations during the 5-year study. The average percent surface area that was delaminated was 3.7 percent for the SFC overlay and 18.2 percent for the LMC overlay.
Half-cell potentials also varied with span. Span 1 of the SFC overlay and Span 3 of the LMC overlay had more negative potentials than the other spans. However, the potentials were typically low to moderate. Table 61 summarizes the potential data.
| Year | NB (SFC) | SB (LMC-III) |
|---|---|---|
| 1994 | 91.4 | 67.0 |
| 1997 | 78.8 | 61.6 |
The potentials shifted slightly more negative (corrosive) over the 5-year study. Local anodic areas were identified especially near joints and between lanes. Corrosion rates varied from low to moderate on both structures. Bond strengths away from delaminated areas remained high throughout the study. Chlorides have ingressed into the surface of the LMC-III overlay and into the SFC overlay to a lesser degree. The chloride at the level of reinforcing remains generally low.

