U.S. Department of Transportation
Federal Highway Administration
1200 New Jersey Avenue, SE
Washington, DC 20590
202-366-4000
Federal Highway Administration Research and Technology
Coordinating, Developing, and Delivering Highway Transportation Innovations
 |
| This report is an archived publication and may contain dated technical, contact, and link information |
|
Publication Number: FHWA-HRT-04-046 Date: October 2004 |
Previous | Table of Contents | Next
In accordance with contract provisions, once the specifications development flowchart was developed (see chapter 3), members of the research team met with the panel to seek its approval of the process and to identify topics for detailed analyses. The meeting took place on March 1, 1999, at the Turner-Fairbank Highway Research Center (TFHRC) in McLean, VA. The minutes of that meeting are included in appendix E.
Two major goals were planned for the meeting. The first goal was to present the preliminary specifications development flowchart to the panel members, discuss their comments and input, and obtain approval from the panel to proceed with a final process flowchart. The second goal was to determine the specific topics that the panel wanted to include for detailed analyses in the project. The minutes in appendix E indicate the process that was followed during the meeting.
With regard to the first goal, the researchers obtained input from the panel members and it was agreed that some modifications would be made to the initial flowchart. These changes were included in the final flowcharts shown in chapter 3. Concerning the second goal, there was discussion on a number of potential topics; however, there was not sufficient time for the panel to select the most desirable items for further study. It was therefore agreed that the principal investigator would distribute a survey form to the panel members to solicit their rankings of the various topics to be analyzed during the project.
The principal investigator distributed a survey form to the panel members to determine a priority ranking for the various topics that were candidates for detailed analyses. The survey form that was distributed is shown in figure 5.
Of the 20 survey forms distributed (19 State representatives plus the COTR), 18 were returned. Two ranking methods were used. The first asked the respondents to group the topics into three categories-highest priority, next highest priority, and lowest priority. In summarizing these results, 5 points, 3 points, and 1 point were assigned to the topics in each category, respectively. The second ranking method asked the respondents to rank the topics in decreasing order from highest to lowest priority. In summarizing these results, 10 points were assigned to the highest priority topic, with the points decreasing to 9, 8, 7, ... 3, 2, 1. Zero points were assigned to any topics that were not on the list of the top 10.
FAX TO: [contact] FROM: _______________________ Optimal Acceptance Procedures for Statistical SpecificationsComplete the tables below using two different ranking methods. Keep in mind that all items in the flowcharts will be addressed in the manual and the report. Some will just be addressed in general conceptual terms, while others will need to include detailed analyses to support recommendations. First: Rank the 4 highest priority numbered items in the table shown, along with the 4 items with second highest priority, and, finally, the 4 items with lowest priority. You may include write-in items in your priority rankings.
| ||||||||||||||||||||||
|
Second: Rank the 10 highest priority numbered items in decreasing order from most important, 1, to less important, 10. You may include write-in items in your priority rankings.
Third: Cross out any of the bulleted items that you do not feel need to be included. Fourth: Fax your ratings (and pages with crossed-out bullets) to Jim Burati at 864-656-2670. |
Figure 5. Survey sent to panel members.
List of Possible Topics for Further Analysis
|
Figure 5. Survey sent to panel members (continued).
A summary of the survey responses is provided in table 4 for the first ranking method and in table 5 for the second ranking method. The same results are shown in graphical form, from highest to lowest priority, in figures 6 and 7 for the first and second ranking methods, respectively.
Table 4. Survey results for the first ranking method.
| Agency | 1 | 2 | 3 | 4 | 5 | 6 | 7 | 8 | 9 | 10 | 11 | 12 |
|---|---|---|---|---|---|---|---|---|---|---|---|---|
| FHWA | 1 | 3 | 1 | 3 | 1 | 3 | 5 | 5 | 5 | 3 | 1 | 5* |
| CT | 3 | 1 | 3 | 5 | 1 | 3 | 5 | 5 | 1 | 5 | 3 | |
| ID | 5 | 1 | 3 | 3 | 3 | 1 | 5 | 5 | 1 | 5 | 3 | |
| IL | 5 | 3 | 5 | 3 | 3 | 5 | 1 | 1 | 1 | 5 | 3 | |
| KS | 5 | 5 | 3 | 5 | 3 | 5 | 1 | 1 | 1 | 3 | 1 | 3? |
| LA | 5 | 1 | 1 | 1 | 3 | 3 | 5 | 5 | 5 | 3 | 3 | |
| MN | 5 | 1 | 1 | 3 | 5 | 5 | 3 | 5 | 1 | 3 | 3 | |
| NV | 3 | 5 | 3 | 1 | 3 | 3 | 5 | 5 | 1 | 5 | 1 | |
| NJ | 3 | 3 | 1 | 3 | 1 | 3 | 5 | 5 | 1 | 5 | 1 | 5+ |
| NY | 3 | 3 | 1 | 1 | 3 | 1 | 5 | 5 | 3 | 5 | 5 | |
| ON | 5 | 1 | 3 | 1 | 1 | 3 | 5 | 5 | 3 | 5 | 3 | |
| OR | 5 | 5 | 3 | 1 | 1 | 3 | 5 | 3 | 1 | 5 | 3 | |
| PA | 5 | 5 | 3 | 5 | 3 | 1 | 3 | 3 | 1 | 5 | 1 | |
| SC | 5 | 3 | 1 | 1 | 1 | 3 | 5 | 5 | 3 | 5 | 3 | |
| TX | 5 | 5 | 3 | 3 | 3 | 5 | 1 | 0 | 5 | 3 | 0 | |
| VA | 0 | 0 | 0 | 0 | 0 | 0 | 5 | 5 | 0 | 5 | 0 | |
| WA | 5 | 3 | 3 | 3 | 1 | 5 | 5 | 3 | 1 | 5 | 1 | |
| WI | 5 | 3 | 1 | 3 | 5 | 3 | 5 | 1 | 1 | 5 | 3 | |
| Total | 73 | 51 | 39 | 45 | 41 | 55 | 74 | 67 | 35 | 80 | 38 | 13 |
* Procedures for determining acceptable alpha and beta risks
? Listed an item 12 in the ranking, but did not identify it
+ Establishment of the relationship between quality/performance/value
Table 5. Survey results for the second ranking method.
| Agency | 1 | 2 | 3 | 4 | 5 | 6 | 7 | 8 | 9 | 10 | 11 | 12 |
|---|---|---|---|---|---|---|---|---|---|---|---|---|
| FHWA | 2 | 5 | 0 | 6 | 0 | 3 | 9 | 7 | 8 | 4 | 1 | 10* |
| CT | 6 | 2 | 3 | 10 | 0 | 5 | 8 | 7 | 1 | 9 | 4 | |
| ID | 10 | 2 | 5 | 4 | 3 | 1 | 8 | 7 | 0 | 9 | 6 | |
| IL | 9 | 5 | 7 | 4 | 3 | 10 | 2 | 2 | 0 | 8 | 6 | |
| KS | 10 | 9 | 5 | 7 | 4 | 8 | 2 | 1 | 0 | 6 | 0 | 3? |
| LA | 10 | 2 | 1 | 0 | 6 | 3 | 8 | 9 | 7 | 5 | 4 | |
| MN | 9 | 2 | 1 | 3 | 7 | 10 | 5 | 8 | 0 | 6 | 4 | |
| NV | 5 | 8 | 6 | 0 | 3 | 4 | 10 | 9 | 2 | 7 | 1 | |
| NJ | 5 | 3 | 0 | 4 | 0 | 6 | 9 | 8 | 1 | 7 | 2 | 10+ |
| NY | 6 | 5 | 1 | 2 | 4 | 0 | 9 | 10 | 3 | 7 | 8 | |
| ON | 10 | 0 | 3 | 2 | 1 | 6 | 8 | 7 | 5 | 9 | 4 | |
| OR | 10 | 7 | 3 | 2 | 1 | 4 | 9 | 6 | 0 | 8 | 5 | |
| PA | 10 | 9 | 5 | 8 | 4 | 2 | 6 | 3 | 1 | 7 | 0 | |
| SC | 10 | 4 | 2 | 0 | 1 | 3 | 7 | 8 | 5 | 9 | 6 | |
| TX | 9 | 10 | 5 | 3 | 4 | 8 | 2 | 0 | 7 | 6 | 0 | |
| VA | 0 | 0 | 0 | 0 | 0 | 0 | 9 | 9 | 0 | 9 | 0 | |
| WA | 7.5 | 5 | 5 | 5 | 2.5 | 7.5 | 9.5 | 2.5 | 1 | 9.5 | 0 | |
| WI | 10 | 5 | 1 | 6 | 9 | 4 | 7 | 2 | 0 | 8 | 3 | |
| Total | 138.5 | 83 | 53 | 66 | 52.5 | 84.5 | 127.5 | 105.5 | 41 | 133.5 | 54 | 23 |
* Procedures for determining acceptable alpha and beta risks
? Listed an item 12 in the ranking, but did not identify it
+ Establishment of the relationship between quality/performance/value
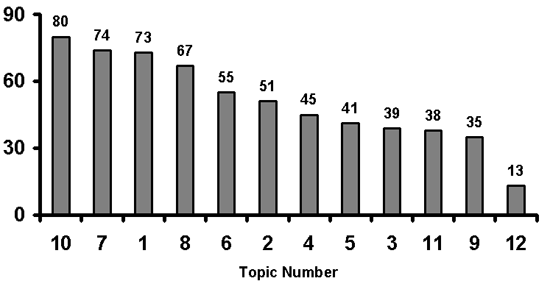
Figure 6. Graphical presentation of survey results for the first ranking method.
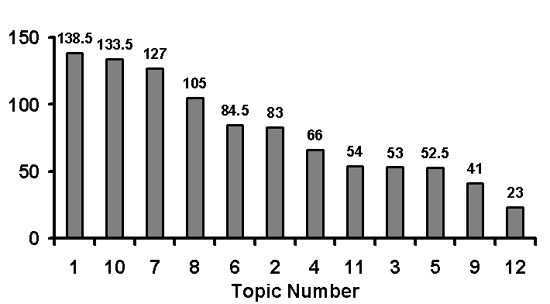
Figure 7. Graphical presentation of survey results for the second ranking method.
Table 6 shows the rankings from the two different methods and the overall ranking, which is the average of the rankings from the two ranking methods.
Table 6. Overall rankings of the survey topics.
| Topic: Analysis of ... | First Ranking Method | Second Ranking Method | Overall Ranking | |
|---|---|---|---|---|
| 10 | Procedures for verifying or validating contractor's and agency's test results | 1 | 2 | 1 |
| 1 | PWL approach | 3 | 1 | 2 |
| 7 | Methods for determining lot pay factors for individual acceptance properties | 2 | 3 | 3 |
| 8 | Methods for determining composite pay factors when multiple properties are used | 4 | 4 | 4 |
| 6 | Moving average approach | 5 | 5 | 5 |
| 2 | AAD approach | 6 | 6 | 6 |
| 4 | CI approach | 7 | 7 | 7 |
| 3 | Sample mean approach | 9 | 9 | 8 (tie) |
| 5 | Sample variability approach | 8 | 10 | 8 (tie) |
| 11 | Various "bells and whistles" | 10 | 8 | 8 (tie) |
| 9 | Use of Bayesian procedures | 11 | 11 | 11 |
As would be expected, the two ranking methods had very similar results. The clear winners were the topics related to verifying or validating the contractor's results, the percent within limits (PWL) approach, and the determination of payment factors. There was a considerable dropoff between this group and the moving average, average absolute deviation (AAD), and conformal index (CI) approaches.
Two additional topics were proposed (each by one responder). These were "procedures for determining acceptable α and β risks" and "establishment of the relationship between quality, performance, and value." Each of these additional proposed topics would require considerable effort and, indeed, would constitute major research projects in their own right. It was not possible to tackle these topics with the time and resources that were allocated for the current project.
Table 6 identifies the priority topics that, in the opinion of the panel, required detailed analyses during the current project. The priority items selected by the panel can be reiterated as:
These are essentially the same topics that were identified from the process flowcharts in chapter 3. Those topics were:
The only difference is that the panel members were interested primarily in the PWL quality measure, while the flowcharts indicate that a quality measure must be selected but do not imply that it must be PWL. Therefore, it was decided to conduct initial analyses on several potential quality measures, but to concentrate the detailed analyses on the PWL measure as long as the initial analyses indicated that it was the recommended quality measure.
Each of the bulleted items listed above is presented in depth in subsequent chapters.

