U.S. Department of Transportation
Federal Highway Administration
1200 New Jersey Avenue, SE
Washington, DC 20590
202-366-4000
Federal Highway Administration Research and Technology
Coordinating, Developing, and Delivering Highway Transportation Innovations
 |
| This report is an archived publication and may contain dated technical, contact, and link information |
|
Publication Number: FHWA-HRT-04-046 Date: October 2004 |
Previous | Table of Contents | Next
Decisions concerning payment relationships are extremely important since experience has shown that payment relationships in an acceptance plan are the most important factor from a contractor's perspective. The contractor submits a bid with a certain expectation of the amount of payment for the product. Achieving this amount of payment is critical in maintaining a viable business.
By the 1980s, many agencies had included payment reductions as part of the acceptance plans in their QA specifications. The intent was to penalize contractors for material or construction that did not fully comply with the specification requirements, but which was not of sufficiently poor quality to justify removal and replacement. Many agencies have now realized the need to also include incentive provisions (i.e., bonuses) to reward contractors for superior quality. These incentives and disincentive payment schedules were often based on engineering judgment, and similar test results could yield very different payment factors from one agency to another.
Relating quality and performance to payment is the most desirable form of payment relationship, because the relationship supports and defends the decision. This is true because negative payment adjustments are typically viewed with skepticism by the contracting industry. However, when the payment schedule can be shown to be related to quality and, preferably, to performance, it is viewed to be more credible than when it is established arbitrarily.
Two different approaches for developing performance models were considered during the current project. The first approach, which has been developed over many years through FHWA and National Cooperative Highway Research Program (NCHRP) support, is what has been called performance-related specifications (PRS). These efforts have led to the development of PRS guide specifications and to computer programs that use theoretical and/or empirical models to predict pavement performance based on test results from the newly placed pavement. The software program PaveSpec, now in version 3.0, has been developed for PCC pavements and has been available to the general highway industry for a number of years. More recently, HMASpec has been developed for HMAC pavements.
The second approach that was considered is based on concepts similar to those of the PRS mentioned above. However, this approach is more general in that it can be applied to any set of quality characteristics for which a general relationship to pavement life can be developed or approximated. The second approach also considers only initial construction costs and major reconstruction or rehabilitation activities, and does not try to include routine or localized maintenance and repair costs into the payment determination.
Each of these is discussed briefly in the following sections. Much of the material on PRS is taken from unpublished manuscripts prepared by P.A. Kopac, T.M. Mitchell, and T.P. Teng of FHWA.
An extensive research effort has been conducted to develop what are generally known as PRS. PRS attempt to use acceptance and payment plans that incorporate payment provisions based on pavement performance models. Current PRS are based on mathematical models that attempt to quantify pavement performance relationships among a number of important quality characteristics. The intent of these models is to provide a clearer understanding and better estimate of a pavement's performance than can be obtained by even the best intuitive engineering judgment. These performance models are then used to determine the payment adjustments in the acceptance plan.
The most elaborate PRS incorporate models to predict both pavement performance and maintenance costs. The performance prediction models use the pavement's design and materials information to predict when and to what extent the pavement will exhibit various types of distress, such as fatigue cracking or joint spalling. The maintenance cost models use predicted stress development to estimate post-construction life-cycle costs (LCC), which include the predicted costs of maintenance and rehabilitation that will be encountered throughout the projected life of the pavement.
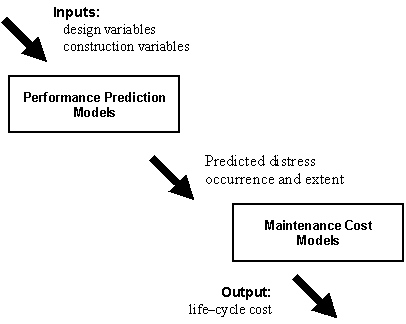
Figure 96. Flowchart of the PRS process (after Kopac, Mitchell, and Teng).
As shown in figure 96, the inputs to the performance model include design variables such as traffic loading, climatic factors, drainage, and roadbed soil factors, and materials quality characteristics such as asphalt content, concrete strength, and pavement smoothness. These, in turn, are converted by the model into predicted occurrence and the extent of the various types of distress. This then becomes the input to the maintenance cost models whose output is ultimately a predicted LCC for the pavement.
The target values for the quality characteristics are input to the models to determine the as-designed LCC. The actual measured values for the pavement's quality characteristics are then used as input to produce the estimated as-constructed LCC. The difference between the as-designed and as-constructed LCC values is then used as the basis for any incentive or disincentive payment.
Computer simulation routines are used with PRS to consider variability when determining payment adjustments. Mean and standard deviation values for the as-designed quality characteristics are entered into the simulation program along with other pavement design information. The values for as-designed mean and standard deviation can be determined from the design or based on agency policy or past experience. Hundreds, or preferably thousands, of iterations of the model are then performed.
For each iteration, the simulation routine selects from a normal distribution, defined by the as-designed mean and standard deviation values, for each designated quality characteristic. These simulated values are then input into the PRS models to arrive at an estimate for the as-constructed LCC for each iteration. The average of the many simulated LCC estimates is then used as the as-designed LCC.
The same process is then used with the mean and standard deviation from the acceptance sample test results to develop an estimated as-constructed LCC for each constructed lot. Payment factors are then based on the following equation:
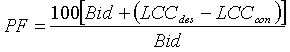 (30)
(30)
where: PF = payment factor as a percentage of the bid price
Bid = contractor's bid price
LCCdes = as-designed LCC
LCCcon = as-constructed LCC
Up to now, most PRS have been developed for individual projects. In that way, project-specific values for inputs, such as design, traffic, climate, etc., can be used. This project-by-project approach obviously provides the best estimate for pavement performance. An alternative would be to develop generic PRS for similar types or groups of projects, such as those within a given geographic or climatic region, or those with similar average daily traffic. While this would eliminate the need for developing a different PRS for each project, the predicted performance would not be as good an estimate as would a project-specific PRS.
To fully benefit from PRS, the performance models must be accurate and properly applied. The current models were developed based on generic national norms. Each agency that wishes to use the current PRS models must decide whether or not its local conditions deviate sufficiently from those norms to require revised performance models for its pavements.
PRS offer great promise to radically change the way in which payment plans are developed and payment factors are determined. However, they are, to a great extent, still in the pilot project stage and have not yet been widely adopted or employed by highway agencies. There are some potential roadblocks to their widespread adoption and implementation. One of these is that they can be perceived as being much more complex than any traditional specification with which an agency is familiar. This perception may be justified in light of the fact that 126 different inputs are possible when using PaveSpec 3.0. This may lead some agencies to be slow to adopt PRS.
While these perceptions of complexity may be overcome, another serious potential drawback is that PRS may require a significant amount of additional testing compared to current QA specifications. Regardless of how sophisticated the internal mathematical or empirical models in a PRS process are, the limiting factor for the accuracy and validity of the LCC prediction will still be the quality of the as-constructed information that is input. No matter how many iterations are simulated within a PRS model, the predictions will not be accurate if the as-constructed mean and standard deviation are not correct.
The large variability in the estimates, based on typical sample sizes = 3-5, has been shown in numerous places in preceding chapters. No matter how sophisticated and precise the models within the PRS, the limiting factor will be the size of the sample that the agency will take to determine the as-constructed means and standard deviations. If, because of personnel shortages, highway agencies are passing acceptance testing responsibilities to the contractors, it seems unlikely that agencies will be willing to increase the amount of acceptance testing that is performed.
For a number of reasons, it was decided that this is not the right time to recommend PRS in a QA specifications development manual that is recommended for current use by all highway agencies around the country. Some of these reasons include:
It is believed that PRS are probably the specifications of the future (whether this is the immediate future or sometime later is still open for debate). While the promise of PRS was recognized, it was decided that a simpler approach for incorporating LCCs into payment determinations would be best for inclusion in the QA manual under development. The approach that was selected for the QA manual is presented in the next section.
The concepts incorporated into the PRS discussed above are sound. The method that was selected for the QA manual is based on similar LCC concepts, but is easier to implement and should be easier to modify for a specific agency than is the PRS approach described above. The method considers only major repairs (such as resurfacing) and does not attempt to include routine or localized repair costs when calculating the LCC. The general approach can be applied to any agency, provided that there is some model or method for predicting pavement life before an overlay is required. Any existing model, including sophisticated PRS models, can be used to develop the predicted lives.
Ordinarily, a pavement is designed to sustain a specified number of load applications before major repairs (such as resurfacing) are required. If, because of construction deficiencies, the pavement is not capable of withstanding the design load, it will fail prematurely. The need to repair this pavement at an earlier date results in an additional expense that must be borne by the agency since it usually occurs long after any contractual obligations have expired. Therefore, one possible purpose for an adjusted payment schedule might be to withhold sufficient payment at the time of construction to cover the extra costs anticipated in the future as a result of work that is of deficient quality.
Pavements are usually designed to withstand a required number of equivalent single-axle loads (ESALs). For those quality characteristics used in the design procedure, the as-built values can be compared to the design values to estimate the fraction of the design load that the pavement is capable of sustaining. As an approximate estimate, this fraction can be multiplied by the design life to obtain the expected life of the pavement. If greater precision is desired, a traffic growth rate can be assumed, the effect of which is to extend slightly the expected life (since fewer of the allowable loads will occur in the early part of a pavement's life).
To estimate the cost to the agency of premature pavement failure, it is necessary to determine the net present value of the various actions made necessary by early failure. For example, suppose that experience has shown that a new pavement typically lasts about 20 years and an overlay about 10 years. If the initial surface were to fail 1 or 2 years prematurely, it is not likely that an agency would do a minor repair to extend the life of the pavement to the originally expected value of 20 years. A much more practical decision would be to reschedule the overlay that was planned for the 20th year and do it 1 or 2 years sooner. However, if the overlay that was planned for the 20th year is rescheduled to an earlier date and overlays typically last 10 years, then all future overlays must be moved to an earlier time as well.
The procedure involves the calculation of a series of debits and credits and turns out to be relatively easy. Moving the overlay that was planned for the 20th year to the 18th year, for example, would result in a debit in net present value terms because it represents a cost in the 18th year that was not planned. However, there will also be a credit for no longer having to do an overlay in the 20th year. Since the overlay that was planned for the 20th year is now later in the future, the credit for this action is discounted to a greater degree, resulting in a net debit for the rescheduling of the overlay that was planned for the 20th year. This is illustrated in figure 97.
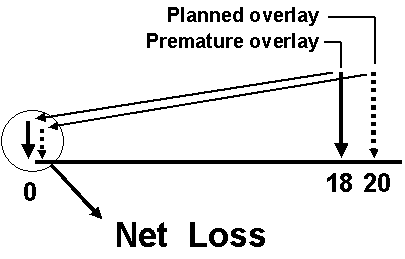
Figure 97. Illustration of the net impact of rescheduling an overlay 2 years earlier than originally planned.
While it is true that the net debits from the rescheduling of overlays farther in the future are discounted to a greater extent, and soon become insignificant, ignoring them altogether would substantially underestimate the true cost of pavement failure. Alternatively, selecting a specific analysis period would require an assumption about the residual value of a partially depleted overlay (information that is not readily available). Fortunately, this is an easy problem to solve mathematically to yield equation 31, the derivation of which is presented in the QA manual:(1)
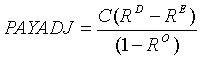 (31)
(31)
where: PAYADJ = appropriate payment adjustment for new pavement or overlay (same units of cost as C)
C = present total cost of resurfacing
D = design life of pavement or initial overlay
E = expected life of pavement or overlay (independent variable)
O = expected life of successive overlays
R = (1 + INF)/(1 + INT)
INF = long-term annual inflation rate in decimal form
INT = long-term annual interest rate in decimal form
To apply the LCC basis for payment schedules in a manner that is both fair to all parties and legally defensible, it is necessary to have at least an approximate performance relationship. The purpose of the performance relationship is to predict from the quality characteristics measured at the jobsite what the expected service life of the construction item will be. This is the independent variable to be entered into the LCC equation presented in the previous section.
As noted in previous sections, efforts are proceeding on the development and implementation of extremely sophisticated computerized procedures to develop performance relationships and appropriate payment schedules. However, the successful completion, validation, and widespread adoption of these procedures are still some time away. Even when completed, the data requirements and the level of complexity of these procedures may deter their widespread use by practitioners seeking more practical methods that are easier to understand and apply.
Therefore, there is a need for an alternative approach for those agencies that choose to develop their own procedures, in their own way, that are tailored to their own specific circumstances. Perhaps more importantly, this alternative method needs to be sufficiently straightforward and scientifically sound so that agency engineers could not only understand it and use it with confidence, but could also modify it when necessary and be able to present it convincingly to the contractors whose work it will govern.
The derivation of such an alternative approach for developing simplified performance models is presented in depth in the QA manual along with a number of examples.(1) This derivation resulted in equation 32, which is a simple exponential model that is applicable to a wide variety of quality characteristics:
![]() (32)
(32)
where: EXPLIF = expected life, in years
A = constant to be determined
Bk = coefficients to be determined for each of the k quality characteristics
PDi = percent defective of individual quality characteristics
k = number of quality characteristics
e = base of natural logarithms
This model has certain important advantages. It tends to produce an "S" shape that is believed to be an appropriate form for many performance relationships. Also, because this particular model produces a maximum of A and a minimum as close to zero as desired (but not below zero), it can easily be made to fit most real-world situations. Finally, it requires relatively straightforward data and simple mathematics to accommodate as many acceptance characteristics as are likely to be necessary.
For example, consider a resurfacing project for which historical data have shown the typical expected life to be about 10 years. A typical value for the AQL is PD = 10, while RQL values tend to vary more widely, depending on what quality level the agency believes justifies removal and replacement at the contractor's expense. For the purposes of this example, suppose that the agency has decided to use RQL values of PD = 65, 75, and 85 because it is believed that these levels correspond to approximately a 50-percent loss in pavement life (or an expected life of 5 years). These assumptions lead to the completed data matrix shown in table 55.
Table 55. Completed data matrix for the example of an exponential model.
| PDVOIDS | PDTHICK | PDSMOOTH | EXPLIF (years) |
|---|---|---|---|
| 10 (AQL) | 10 (AQL) | 10 (AQL) | 10 (AQL) |
| 65 (RQL) | 10 (AQL) | 10 (AQL) | 5 (poor voids) |
| 10 (AQL) | 75 (RQL) | 10 (AQL) | 5 (poor thickness) |
| 10 (AQL) | 10 (AQL) | 85 (RQL) | 5 (poor smoothness) |
All that remains is to use the information in the data matrix to solve for the unknown coefficients in equation 32 (the exponential performance equation for EXPLIF). To accomplish this, it is first necessary to take logarithms of both sides, producing equation 33:
![]() (33)
(33)
where: EXPLIF = expected life, in years
PDVOIDS = air voids percent defective
PDTHICK = thickness percent defective
PDSMOOTH = smoothness percent defective
A, B1, B2, B3 = unknown coefficients
ln = natural logarithm operator
The values from each row in table 55 can be inserted into equation 33 to develop four equations that can be used to solve for the four unknown coefficients, leading to the following performance model:
![]() (34)
(34)
This model would then be used to develop the expected-life value to be used in equation 31 to determine the payment adjustment, which could be either positive or negative depending on the expected-life estimate.
The concepts used in the development of equation 34 have widespread application. The only requirement is that the agency creates a data table such as table 55. Any method with which the agency is comfortable can be used to develop the values for estimated pavement life that result from the various levels of the quality measure. For example, if a performance model is available and the highway agency has confidence in the predictive capability of the model, then it could be used to develop the estimated expected life of the pavement.
As noted in chapter 10, specifications based on multiple quality characteristics frequently use payment equations that include a separate term for each of the quality characteristics so that the resultant payment adjustment is a function of the combined effects of all of the quality measures. An alternate method to accomplish the same purpose is to base the payment equation on a single quality measure that is a composite of the individual quality measures. This latter approach, because it keys the various decisionmaking steps to a single performance indicator, simplifies the procedure and offers several practical advantages.
The benefit of the composite quality measure is shown in a simple example that uses two acceptance quality characteristics-air voids and thickness. Suppose that the expected-life model in equation 35 has been developed for these two characteristics:
![]() (35)
(35)
Since the quality measure in equation 35 is PD, which ranges from a minimum of zero to a maximum of 100, it will be convenient to develop a composite quality measure (PD*) that spans that same range. As derived, the value of EXPLIF in equation 35 ranges from 2.71 to 22.9. By algebraic operations, equation 35 can be modified to span the range from 0 to 100, thereby yielding equation 36:
![]() (36)
(36)
where: PD* = composite quality measure, in units of percent defective
PDVOIDS = air voids percent defective
PDTHICK = thickness percent defective
PD* progresses smoothly from 0 to 100 percent as the individual quality measures (PDVOIDS and PDTHICK) vary throughout the same range. Table 56 presents a few selected examples of this:
Table 56. Examples of computed PD* values for selected individual PD values.
| PDVOIDS | PDTHICK | EXPLIF (years) | PD* |
|---|---|---|---|
| 0 | 0 | 22.9 | 0.0 |
| 10 | 10 | 20.0 | 14.3 |
| 50 | 50 | 10.4 | 61.9 |
| 25 | 75 | 10.5 | 61.4 |
| 100 | 100 | 2.7 | 100.0 |
As shown in table 56, the case in which PDVOIDS and PDTHICK are both equal to 50 produces essentially the same level of expected life as the case in which PDVOIDS = 25 and PDTHICK = 75. This result flows directly from the manner in which the EXPLIF equation was derived and is realistic because an increase in the quality of one measure might be expected to offset a decrease in the quality of the other. Appropriately, both cases produce virtually the same value of PD* in the last column of the table, indicating that PD* is well suited as a measure on which a QA specification can be based.
This property of the composite quality measure, which properly accounts for the combined effects of multiple quality characteristics, also makes it possible to develop an RQL provision that is far superior to the alternative of defining separate RQL provisions for the individual quality measures. For the example in table 57, it is assumed that the agency has defined for air voids and thickness separate RQL provisions of PDVOIDS ≥ 75 and PDTHICK ≥ 90. Clearly, case 3 in table 57 is, by far, the worst case, yet it is not recognized as an RQL condition when using individual RQL provisions, while the other two cases are considered as such.
Table 57. Illustration of the problem with separate RQL provisions.
| Case | Quality Level | Reject? | PD* | |
|---|---|---|---|---|
| Air Voids | Thickness | |||
| 1 | PD = 75 (RQL) | PD = 0 (excellent) | Yes | 60.5 |
| 2 | PD = 0 (excellent) | PD = 90 (RQL) | Yes | 60.2 |
| 3 | PD = 74 (almost RQL) | PD = 89 (almost RQL) | No | 87.9 |
To demonstrate the effectiveness of an RQL provision based on the composite quality measure, equation 36 was used to compute the corresponding values for PD* that appear in the last column of table 57. In this example, a PD*of 60 or more would be regarded as rejectable and, as shown in the last column, case 3 is properly recognized as being well into the rejectable region.
All of the topics covered in this section are covered in much greater detail and with more examples in the QA manual.(1) This information is included in this report merely to show the relative simplicity of this method and to highlight some of its benefits.

