U.S. Department of Transportation
Federal Highway Administration
1200 New Jersey Avenue, SE
Washington, DC 20590
202-366-4000
Federal Highway Administration Research and Technology
Coordinating, Developing, and Delivering Highway Transportation Innovations
 |
| This report is an archived publication and may contain dated technical, contact, and link information |
|
Publication Number: FHWA-04-122 Date: February 2005 |
Previous | Table of Contents | Next
Early-age behavior may impact the long-term performance of concrete pavements leading to a number of distresses. These guidelines discuss the impact that early-age behavior may have on JPCP faulting and cracking, CRCP punchouts, and the impact on spalling distress, which is common to both JPCP and CRCP. While JPCP faulting and cracking are modeled in HIPERPAV II, a spalling model was not included in the long-term prediction module because of the complexity required to account for all possible factors that affect spalling distress. Likewise, since CRCP long-term performance was out of the scope of the HIPERPAV II project, no punchout models were included in HIPERPAV II. It is important, however, that users of these guidelines understand the factors influencing spalling and punchout distresses and the design and construction factors that should be considered to minimize their occurrence.
Faulting of pavements is the most predominant factor contributing to pavement roughness. Faulting is the difference in elevation of adjoining slabs at the joint. In JPCP without dowels at the joints, faulting is caused by the buildup of loose material. The location of the buildup is most commonly under the approach edge of the slab, hypothetically due to the erosion of subbase material from under the leave edge of the slab. The magnitude of faulting is affected significantly by heavy traffic loads, the type of subbase material, and climatic conditions that the pavement is subjected to over the course of its lifetime.
This section outlines how early-age parameters at the time of pavement construction influence the long-term faulting performance of JPCP without dowels. The damage progression, initiating at early age, is described in the flowchart in figure 21. The early-age input (step 1) controls the concrete's material properties (step 2) and the pavement's early-age response (step 3). Material characterization describes the change of PCC properties, such as strength and stiffness. Early-age response describes the stresses, strains, and deflections that form within the pavement. With time and daily cyclic temperature changes, the pavement's behavior (step 4) is apparent. Pavement behavior covers visible phenomena such as joint opening and curling and warping. Steps 1-4 outline the sequence of early-age processes that occur before distress formation. After the pavement is subjected to traffic loading and changing climatic conditions, the pavement behavior may lead to distress. The long-term inputs that are influential in causing faulting are listed in step 5. Repeated loading of the pavement will eventually cause the distress to form (step 6). After the distress first forms, repeated loading cycles will increase the severity of the distress. How this distress changes with time (long-term pavement performance) is provided in step 7. These seven steps, from early age to long term, are described here in greater detail.
The early-age inputs that govern faulting in nondoweled JPCP are listed in step 1 of figure 21. Faulting is caused by slab deflection at the joint. Load transfer through aggregate interlock is lost as the joint opens, and the pavement deflects downward due to continued mechanical and environmental loading. During the design stage, preventive measures should be taken to limit slab deflection. This is possible by constructing shoulder support or by widening the lanes. Widened lanes reduce the stresses at the slab edge.(26) Proper pavement curing also can help reduce the severity of built-in curling (see section 2.4.2), which is affected by temperature and moisture. Built-in curling may contribute to faulting of the pavement even before traffic loads are applied.
To prevent excessive opening of the joints, joint design should be carefully evaluated. Short joint spacings usually translate to narrower joint openings, and larger joint spacings translate to wider joint openings. If the joint spacing is large, more material is available for contraction during temperature drops. The slab-subbase friction resists this movement, which affects the joint opening. To prevent the loss of aggregate interlock, a good bond between the aggregate and concrete is necessary if suitable load transfer is to be provided for a significant period of time.
The strength and stiffness of PCC is determined primarily by the mix design, material properties, construction curing practices, and climatic conditions at the time of placement. PCC mix design also determines the effectiveness of the aggregate interlock at the joint. Larger aggregates have been found to be more effective in transferring load, and therefore lead to decreased faulting.(26) PCC material properties also influence the early-age responses of the pavement, namely the stresses, strains, and deflections that develop.
Figure 21. Flowchart outlining impact of early-age input on long-term faulting performance of JPCP without dowels.
For JPCP to fault, loading one of the adjoining slabs results in deflection greater than the adjacent slab. It commonly is assumed that faulting initiates at a slab corner, because deflection is typically the greatest there. The difference in slab deflections is the result of a loss of load transfer at the joint due to large joint openings. Since it is necessary to maintain good load transfer at the joint, the size of the joint opening should be minimized. Joint opening is controlled by the stresses and strains in the pavement. Therefore, the internal stresses in the pavement must be controlled for optimal joint opening and reduced faulting in the long term.
As mentioned previously, the size of the joint opening determines how efficient the aggregate interlock is in transferring load across the joint. Experimental studies have shown that a joint opening of 0.6 mm or greater can translate to total loss of load transfer by aggregate interlock.(14) This was discussed in greater detail in section 2.2. Slab deflection is the other component required if a pavement is to develop faulting. Curling or warping is another form of slab deflection. Figure 22 illustrates how a deformed pavement shape promotes the ingress of water into the pavement subbase and subgrade layers. Pumping is more severe when the pavement is curled up or has built-in curling.(27)
Figure 22. Deflected pavement shape.
As the size of the joint opening increases and curling and warping become more apparent, faulting commonly will develop over time. This section identifies the long-term inputs that control the rate of faulting. Opening of the joint promotes water infiltration into the pavement's underlying layers. Water softens the subbase and subgrade, and increases the stresses and deflections in the pavement. Faulting is a common distress associated with poor drainage. However, if a pavement's drainage capacity is improved, faulting can be reduced effectively, especially for nondoweled JPCP.(28)
Heavy traffic loads and climatic factors such as precipitation significantly contribute to the amount of faulting at a pavement joint. The repeated loading of pavement joints causes erosion of the subbase from under the leave edge of the slab and its buildup under the approach slab. Figures 23-25 depict faulting in pavements with erodable base material. As the wheel load deflects the approach side of the concrete pavement, material is pushed toward the leave side (figure 23). This frictional erosion and pore water pressure generates loose fine materials. Coarse-grained soils are able to withstand the effects of traffic better than fine-grained ones. Then, as the wheel passes to the leave slab, the water is pushed back to the approach side, and the fines are deposited (figure 24). A void forms on the leave side (figure 25), and faulting is apparent. The degree of faulting increases on sections with longer slabs.(26) The slabs also can rotate as a result of this mechanism.(14) Faulting sometimes can be reduced if shorter slabs are used.
Figure 23. Schematic of faulting progression in JPCP without
dowels,
wheel on leave edge of slab (exaggerated to show mechanism).
Figure 24. Schematic of faulting progression in JPCP
without dowels,
wheel on approach edge of slab.

Figure 25. Schematic of faulting progression in JPCP without dowels,
resultant behavior at the JPCP joint that causes faulting.
The amount of faulting commonly correlates with the properties of the subbase materials. Subbase materials that are able to resist a shear stress of 25-50 pascals (Pa) do not erode for the life of the pavement. Weaker subbase materials will typically experience high erosion.(29) Pavements constructed with cement-stabilized subbase materials, such as lean concrete bases, typically experience less faulting, and their corner deflections generally are reduced.(26)
Freeze-thaw cycles also influence the magnitude of faulting. When the pavement system freezes during the winter months, the pavement system is stiff. However, during the winter thaw, the pavement is highly susceptible to traffic loadings. At this time, the subbase is saturated, causing a marked decrease in its strength. Pumping and erosion of the subbase accelerates. Faulting damage can increase significantly during this period.(15)
The three major factors that cause faulting are repeated heavy traffic loads at the joint, differential deflection at the joint, and thermal and moisture gradients in the slab and subbase that cause curling of the pavement and subbase erosion.(30) Water in the pavement subbase and subgrade layers increases the amount of pumping, and thereby increases the degree of faulting. Figure 26 shows evidence of faulting at a typical contraction joint. Faulting is determined in the field by measuring the difference in adjoining slab elevations 0.3 m from the pavement edge.(15)
Figure 26. Photograph of faulting in JPCP.
Faulting increases with time as the pavement is subjected to more traffic loads and climatic fluctuations. As figure 27 illustrates, faulting initially grows linearly up to a point, and then grows nonlinearly as loading continues.(31) Faulting is commonly found to be objectionable when it exceeds 3.3 mm.(26)
Figure 27. Schematic of time growth of faulting for JPCP without dowels.
The climatic conditions at the pavement's location greatly influence the magnitude of faulting. Analysis of the Long-Term Pavement Performance database revealed that faulting is lowest in the dry-no freeze region, as compared to dry freeze, wet-no freeze, and wet freeze regions.(32) This result demonstrates the importance of water to the faulting mechanism. Temperature fluctuations also influence faulting. Daily expansion and contraction cycles have been found to cause up to 0.5 mm of faulting per year.(27)
Faulting of pavements was discussed in section 4.1 for JPCP without dowels at the joints. This section discusses faulting of JPCP with dowels. Dowels at the joints effectively reduce JPCP faulting.(33)They commonly are used today on most high-volume roadways.(26)
In reference to figure 28, this section will describe the early-age inputs (step 1), material property development (step 2), and the pavement's early-age response (step 3). Dowel-concrete bearing stress significantly influences faulting.(15) These responses are included in the pavement behavior (step 4), which includes joint opening, dowel looseness, and curling and warping of the pavement. Over time, as the pavement is subjected to traffic loading and changing climatic conditions (step 5), faulting can develop (step 6). Finally, the long-term faulting performance of JPCP with dowels is discussed (step 7).
Figure
28. Flowchart outlining the influence of
early-age properties
on long-term faulting performance of JPCP with dowels.
Early-age inputs impact the long-term faulting performance of doweled JPCP. The parameters with the greatest influence are listed here. Because the dowels and the concrete interact, the concrete mix should be tailored for strength and durability. Likewise, the dowels should be designed for reduced faulting. Larger dowel bars (28.7 to 38 mm in diameter) are more effective in reducing faulting than smaller 25.4-mm diameter bars.(26) Similarly, decreasing the joint spacing often reduces faulting. Climatic conditions are important, since they determine the built-in curling at set.
Design features are also an important consideration. Shoulder support and widened lanes can minimize slab deflection, especially at the corners. It is assumed that, since loaded corner deflections are often the largest, faulting commences here. (30) Faulting is caused by the mismatch of adjoining slab deflections. Tied shoulders have been shown to reduce faulting by 50 percent.(35) Likewise, construction methods used in placing these dowels are critical to their performance, as these methods may contribute to dowel misalignment. Circular steel dowel bars are used to transfer vertical shear and horizontal bending moments between adjacent slabs. To successfully transfer load, the bars must be properly aligned along their longitudinal axis and must be lubricated over half their length before placement.(36) Dowel bar coatings are commonly used to prevent corrosion. Preventing dowel deterioration also translates to reduced dowel lockup.(37)
Development of the concrete's tensile and compressive strength and stiffness significantly influences the behavior of doweled JPCP. Strength and stiffness determine the magnitude of pavement stresses, strains, and deflections. They relate step 2 in figure 28 directly to the pavement's early-age response in step 3. The concrete also must interact with the dowels immediately after construction by resisting the dowel bearing stress. This early-age interaction means that care should be taken when curing the concrete to maximize its early-age strength. The concrete can be damaged if the stress exceeds its early-age strength.
Faulting is directly related to the bearing stress at the dowel-concrete interface. If the dowel bearing stress can be kept below the crushing strength of the concrete, faulting can be maintained at an acceptable level.(15) The early-age behavior of the concrete at set determines the magnitude of bearing stress. Ideally, the pavement should cure without any curling or warping, as shown in figure 29. The dowel is straight and does not exert any stresses on the surrounding concrete.
Figure 29. Schematic of ideal JPCP at set (dowel bar straight).
However, as the pavement undergoes daily temperature and moisture changes, the pavement will curl up and down. The dowel resists this movement and, as a result, subjects the concrete to a bearing stress. If the slabs curl upward, as shown in figure 30, the dowel will bend negatively (downward) to resist slab deformation. The concrete above the dowel is put into compression. The opposite happens when the slab curls down; the dowels bend positively (upward) to resist deformation. The stiffer dowels are more able to resist deformation, yet the resultant stresses in the dowel and at the dowel-concrete bearing location are higher. Fiberglass dowels have lower stiffness than steel dowels. The longitudinal stiffness of fiber dowels is approximately 55 gigapascals (GPa), compared to 207 GPa for steel dowels. The bearing stress for fiber dowels at the dowel-concrete interface is also lower than for steel.(36) At early ages, the concrete has not yet reached its full compressive strength, so a higher bearing stress is more prone to causing damage. Early-age damage to the concrete will greatly reduce the pavement's long-term performance.
Figure 30. Schematic of curled JPCP connected by a dowel in bending (enlarged to show mechanism).
The stresses, strains, and deflections that develop in the pavement at an early age influence joint opening and pavement curling and warping. The repeated temperature cycles may loosen the dowel-concrete interface, and therefore reduce the load transfer efficiency. Traffic loadings aggravate this condition, as is discussed in the next section.
Long-term inputs affect the doweled and nondoweled pavements similarly (section 4.1). Faulting increases as traffic and precipitation increase. Good drainage and a stabilized subbase can reduce faulting. Climatic conditions also influence faulting of the doweled pavements, but not as significantly.(35)
Over time, the number of thermal and moisture cycles a pavement experiences accumulates. The joints open and close as the pavement expands, contracts, curls, and warps.(30) Similarly, the dowel continues to subject the concrete to compressive stresses. High bearing stresses are commonly found at the dowel-concrete interface due to this cyclic loading. Traffic loading also increases the bearing stresses, as shown in figure 31. In this figure, the dowel-induced stresses are on the upper half of the pavement's approach slab and on the lower half of its leave slab. This can cause crushing of the concrete in adjoining pavements over time.(36) This loss of concrete forms voids at the dowel-concrete interface and reduces load transfer efficiency.
Figure 31. Schematic of wheel load on JPCP with dowels (dowel enlarged to show bearing stresses).
Faulting in doweled JPCP is caused, in part, by dowel loosening and enlargement of the dowel socket. The reasons for doweled pavement faulting are similar to those for nondoweled pavements. They include heavy traffic loading, differential deflection at the joint, and thermal and moisture gradients that cause slab curling and subbase erosion. In the case of doweled pavements, these three mechanisms loosen the dowel, reducing the load transfer efficiency and causing concrete crushing at the dowel-concrete interface. A photograph of faulting distress was shown in figure 26.
The relationship of faulting versus traffic is shown in figure 32 for JPCP with dowels at the joints.(35) Initially, faulting increases rapidly. Then, with time and increased traffic, the faulting levels off. Dowels can significantly reduce faulting, when compared to JPCP without dowels. See section 4.1 for more details on faulting of JPCP without dowels.
Faulting of doweled pavements can also lead to other distresses, such as spalling and transverse cracking. If the dowel bearing stresses are too severe, concrete above the dowels can break off to form a spall. This is discussed in more detail in sections 4.5 and 4.6. Transverse cracking is also possible if the doweled joints are improperly constructed. Dowel misalignment can cause a transverse crack to form near the joint. For more details on this distress, see section 4.3.
Figure 32. Schematic of time and traffic growth of faulting for JPCP with doweled joints.
Transverse cracking of JPCP can develop at early ages immediately after construction, or it can form years later due to fatigue. However, the mechanisms that cause these cracks to form are different. At early ages, transverse cracks form because of restrained volume changes. Concrete tends to expand and contract due to changing climatic conditions. When these internal deformations are restrained by external slab-subbase restraint and self-weight, early-age transverse cracking is possible.(2) Because young concrete has not yet reached its full mature strength, it is more susceptible to tensile damage. More detail on this type of cracking is provided in section.
When transverse cracks form after years of pavement use, the most common cause of cracking is fatigue. Over time, the cumulative number of traffic loadings increase, as do the number of seasonal climatic cycles. Stresses are generated in the concrete, and eventually a transverse crack can form. Transverse cracks can either propagate from the top of the pavement down (top-down cracking), or they can propagate from the bottom of the pavement up (bottom-up cracking). The difference between these two cracking mechanisms is discussed in the following sections.
This section examines how early-age inputs influence transverse cracking in JPCP over the long term. A flowchart connecting early-age input to the long-term performance of JPCP is shown in figure 33. The six fields presented in that figure are discussed in greater detail in the following sections.
Early-age inputs that have a significant influence on transverse crack formation are listed in step 1 of figure 33. The concrete mix design will determine the strength and fracture properties of the concrete at early ages and in the long term. The coarse and fine aggregate percentages also can influence the amount of transverse cracking to the level aggregate gradation affects drying shrinkage.(35) Pavement design also controls the stresses generated in the pavement. Widened pavements can significantly decrease the pavement edge stresses that cause transverse cracking. Joints alleviate tensile stresses that occur in the pavement at early ages. Shorter joints decrease frictional stresses at the slab-subbase interface and decrease the severity of transverse cracking in the long term. Slab thickness also has a significant influence on transverse cracking.(38) Thicker slabs are better able to resist deformation, and they are better able to carry mechanical and environmental loading.(26)
Climatic conditions at the time of pavement construction have a marked influence on long-term pavement performance. The temperature gradient at the time of set determines the amount the pavement curls up or down, and the moisture gradient controls the amount of warping. This built-in curling is discussed in section 2.4.2. Climatic conditions influence the set time and thermal gradient at set, and therefore significantly influence the magnitude of stresses generated over the long term. Finally, construction methods are critical in controlling transverse cracking. Time of joint sawing is important to control, since the joints are designed to alleviate internal pavement stresses and control where the cracks form. Both of these construction methods can improve the pavement's long-term performance.
Figure 33. Flowchart outlining impact of early-age input on long-term transverse cracking performance of JPCP.
The strength and fracture properties of concrete have a significant impact on transverse cracking. The stiffness of the concrete determines the magnitude of induced stresses and deflections. The strength and fracture properties control when the concrete cracks.
Fatigue of concrete has been shown to be a function of the stress-to-strength ratio.(39) A high-strength concrete will commonly have a greater fatigue life than a low-strength concrete. However, high-strength concrete also can have higher stress concentrations at flaws or microcracks, making it brittle. Pavements constructed of concrete with high flexural strength typically fracture more easily.(35)For this reason, it is recommended that concrete strength be kept within a midrange from 4.5 to 4.8 megapascals (MPa).
The pavement's critical stresses can either occur at the bottom of the pavement (bottom-up cracking) or at the top of the pavement (top-down cracking). The mode of failure depends, in part, on the pavement's "built-in" temperature gradient. The term "built-in" is in quotes because it is not really a fixed property. However, for simplicity, it is commonly assumed to be the temperature gradient at final set. To better explain some of the more fundamental concepts, it will be defined in this manner for the discussion to follow. However, this gradient truly is not fixed, but will instead change with time as the stresses in the slab relax.
As figure 34 illustrates, when there is a positive temperature gradient at set, the pavement sets with its top surface hotter than its bottom one. Typically, this happens when the pavement is constructed in the morning or afternoon. Eventually, when the slab cools, it will curl up.
Figure
34. Schematic of JPCP with a positive
temperature gradient at set.
Figure 35 illustrates that if a pavement has a negative temperature gradient at the time of set, the slab surface will be cooler than the slab bottom. This scenario is possible for night paving. If the pavement's surface is hotter than the bottom during subsequent seasonal temperature changes, the pavement may curl downward.
Figure 35. Schematic of JPCP with a negative temperature gradient at set.
Upward curling is less restrained than downward curling because only the corners of the slab lift. Downward curling requires that the slab joints bear down on the subbase (see figure 36). This downward curling requires more force than the upward curling.(22) Drying shrinkage most commonly increases the tensile stresses at the pavement surface due to an increase in the degree of upward slab curling.(39) For the first 72 hours after construction, the pavement's expansion and contraction stresses are partially restrained by the slab-subbase friction. If the internal stresses are greater than the strength of the concrete, transverse cracks may form. If the joints are sawed at the optimal time, early-age uncontrolled transverse cracking can be prevented. If dowels are used at the pavement joint and are significantly misaligned, transverse cracks can form at the joint. Care must be taken to construct and maintain the pavement properly to prevent dowel bar corrosion. Dowel bar corrosion may lead to a locked transverse joint, which may cause additional transverse cracks to form.(40) Even if no transverse cracks form in the pavement at early ages, they may still form in the long term due to fatigue. The upward and downward built-in set conditions increase the likelihood of midslab crack formation due to subsequent mechanical and environmental loading. This is discussed in section 4.3.5 .
Repeated tensile stresses in the pavements initially can damage the concrete at the microscopic level. Eventually, microcracks form that act as stress concentrators. After these microcracks have lengthened and connected, a macroscopic crack will form.
Curling and warping stresses subject the pavement to tensile damage, and help generate transverse cracks. As mentioned in section 2.4.2, built-in downward curling at set due to negative thermal temperature gradients increases the tensile stresses at midslab. The combination of thermal gradients and traffic loading assist in transverse crack formation.
Figure
36. Schematic of curled-down JPCP. Note the pavement lifts
off the subbase at
midslab, and its edges bear on the subbase.
Even though the pavement may resist transverse crack formation at early ages, cracks may still form in the long term due to fatigue. Fatigue loading causes any flaws in the concrete to lengthen. Repeated loads cause the microscopic flaws to blunt and resharpen until they form into a visible crack.(41) Fatigue depends primarily on the ratio of induced stresses to the concrete's strength. Miner's damage law typically is used to calculate the amount of damage a pavement sustains over its lifetime.
The two most significant factors affecting long-term fatigue are the combined effects of traffic and environmental loading.(26) Traffic loads increase the stresses to which the pavements are subjected. They contribute considerably to bottom-up and top-down transverse crack formation. As figure 37 demonstrates, for bottom-up cracking, the critical stresses that cause transverse cracking are at the pavement's midslab edges.(15)
Figure 37. Plan view of JPCP slab showing location of critical edge stresses that cause transverse cracking at midslab.
Figure 38 demonstrates how wheel loading during the service life causes the pavement to deflect downward, putting the bottom of the pavement in tension. Traditionally, transverse cracking is assumed to initiate at the bottom of the pavement.
Figure 38. Schematic of curled-up JPCP.
Similarly, wheel loading can put the bottom of the slab in tension when it is curled down. The interior of the slab may not have contact with the subbase when it is curled down.(15) This loss of support increases the likelihood of midslab transverse cracking.
Environmental loading changes subbase support. The subbase sometimes erodes, settles, pumps, or heaves, all of which negatively impact pavement performance.(38) The development of these subbase phenomena is often directly related to precipitation amounts. Figure 38 demonstrates that, for a curled-up pavement, the water softens the subbase, therefore increasing midslab deflection and, consequently, the tensile stresses at the bottom. For this scenario, the potential of bottom-up cracking is increased. For a curled-down pavement, loss of subbase support, coupled with traffic loading close to the joint, put the surface of the curled-down pavement in tension, increasing the potential for top-down cracking. This can be seen in figure 39.
Figure 39. Schematic of top-down JPCP transverse cracking due to severe erosion of subbase.
Seasonal freeze-thaw cycles further aggravate the effect of water. Freezing can stiffen the subbase and the subgrade during the winter months. During the subsequent thaw cycle, the pavement is most susceptible to damage. The subbase soils cannot sustain the loading, so they erode and pump at a faster rate. This increases the pavement damage.(17) As shown in figure 39, severe erosion of the subbase under the pavement makes transverse cracking due to top-down cracking possible, because the loss of support puts the pavement surface in tension.
While erodable subbases often are not desirable, the use of cement-treated or lean concrete bases also can lead to problems. Pavements built on these bases can also have significant amounts of transverse cracking. Since these impermeable subbases lack flexibility, water can trap beneath the slab and the subbase to form voids. Fines that buildup under the slab create areas of high stress, and transverse cracking can result.(38) Lean concrete bases also cause the pavements to develop large curling and warping stresses, increasing transverse cracking potential.(33)
Pavement system drainage is one of the most significant factors governing long-term pavement performance. Pavements in extreme climates (wet and freezing) sometimes perform badly.(33) The presence of water in the pavement system and subbase and subgrade layers leads to premature pavement damage. Coarser subgrades typically have better drainage than fine grained ones, resulting in better performance when they are used.(39)
Seasonal temperature changes are another environmental factor that can lead to pavement damage. Temperature changes can induce large thermal changes in the pavements. For example, pavements constructed in hot and dry climates have been found to have more transverse cracks than those constructed in milder climates.(33)
Figure 40 shows a transverse crack that formed due to fatigue. As mentioned in the above sections, transverse cracks are the result of early-age factors such as concrete strength and fracture properties, pavement geometry, and climatic conditions. Early-age conditions due to these factors result in curling and warping shapes and bending stresses that, when combined subsequently with traffic loads, climate, and level of subgrade support, cumulatively damage the pavement structure. According to the level of bending stresses and concrete fatigue characteristics, the pavement may eventually crack.
Figure 40. Photograph of transverse crack. Transverse crack and joints enhanced for clarity.
Figure 41 shows how the percent of cracked slabs in a pavement versus time follows an S-shaped curve.(38) Initially, pavement fatigue is low, so transverse cracks are not likely to form. However, after the pavement has sustained a critical number of loads, the number of cracked slabs increases significantly. Over time, the number of transverse cracks commonly levels off. The critical level of cracked slabs in JPCP associated with pavement failure is commonly reported as 10 percent.(26)
Figure 41. Schematic of long-term performance of JPCP: Percent cracked slabs vs. time.
The formation of transverse cracks can increase other pavement distresses. Because water can infiltrate the cracks and weaken the subbase below, the pavement deflection will increase. As a result, increased faulting is possible.(35) The concrete also may deteriorate at this joint, resulting in increased spalling.
This section highlights the influence of early-age inputs on the long-term performance of JPCP with respect to corner breaks. Corner breaks are more likely to form in the long term if certain early-age phenomena occur. These phenomena depend on design and construction parameters.
For example, the probability that corner breaks will form increases if the pavement has built-in upward curling. Built-in upward curling was discussed in detail in section 2.4.2. In simple terms, it is the result of a positive temperature gradient (the temperature at the slab surface is greater than at the bottom). This typically occurs when the pavement is placed during the summer in the morning or afternoon. A decrease in the temperature gradient through the pavement causes the slab to curl up. Drying shrinkage at the surface of the pavement enhances the slab's curled-up shape.
Over time, the deformed shape accelerates the deterioration of the pavement. Subbase support is more likely to erode from under the pavement, as water infiltrates at a faster rate. Load transfer at the joint will also decrease. Heavy traffic loadings and seasonal temperature changes will induce high tensile stresses on the pavement surface, increasing the potential for development of corner breaks.
A flowchart indicating the early-age mechanisms influencing corner cracking distress of JPCP is shown in figure 42.
Material, design, and construction procedures all influence the long-term corner cracking performance of JPCP. The mix design controls the strength and stiffness development of the concrete, as well as its fracture properties. The pavement design also affects the magnitude of stresses in the pavement. For example, skewed joints have been found to increase the number of corner breaks.(26) Thick slabs are able to sustain mechanical and environmental loadings better than thin ones.
Climatic conditions determine the shape of the pavement at set by defining the temperature and moisture gradients. Set conditions determine how the pavement will deform as it undergoes climatic changes throughout its lifetime. A positive temperature gradient at set commonly translates to a pavement with a predominately curled-up shape, except when the surface is heated to a higher temperature than it was at set. However, a pavement with a negative temperature gradient at set can transition from a curled-up shape to a downward curled pavement. Built-in curling determines the location of the critical tensile stresses in the pavement and the likely long-term pavement distresses.
Finally, construction practices and design features can influence the stress state of the pavement, from the early ages throughout its lifetime. Shoulder support can reduce slab deflection at the corners, while widened lanes reduce the pavement's edge stresses. The wheel loading on widened pavements no longer occurs at the pavement's edge. Instead, the loading occurs closer to the pavements interior. These construction methods may extend the pavement's life by several years.
Figure 42. Flowchart outlining the influence of early-age properties on long-term JPCP corner breaks.
Concrete material properties can influence the long-term performance of the pavement significantly with regard to corner cracking. The stiffness of the concrete governs the magnitude of the stresses within the pavement. This determines how severely the concrete will curl at the pavement edges due to mechanical wheel and environmental loading. Fracture properties and strength of the concrete are also important, because they determine the pavement's resistance to cracking. To reduce the severity of corner breaks, a lower stiffness material with high fracture resistance (strength) is needed. However, because these two requirements are commonly contradictory for concrete materials, a compromise should be made at the time of design.
The early-age factors mentioned previously influence the pavement response, including the early-age stresses, strains, and deflections. Their magnitude will influence the pavement performance significantly over its lifetime. The early-age stresses govern the degree of built-in curling. Upward curling causes the slab corners to lift. Downward curling requires that the slab joints bear down into the subbase. The slab length is stressed against its self-weight. This requires more force than upward curling.(39) Over the lifetime of the pavement, the curling can transition from upward to downward, or vice versa. However, drying shrinkage nearly always acts to curl the slab upward, placing the surface in tension.
During the early-age period, upward built-in curling and drying shrinkage are the primary conditions for the development of corner breaks. As figure 43 illustrates, microcracks later form because the tensile stresses placed on the pavement induce damage as the corners deflect. Over time, these microcracks, not visible to the naked eye, will lengthen and form a visible crack as a result of fatigue loading.
Figure
43. Schematic of top-down JPCP corner cracking
in pavements with built-in curling
and reduced subbase support and load
transfer. Wheel loading results in
top-down cracking.
With the initial microcrack formation and the pavement's built-in curling, it is more likely that corner breaks will form in the long term due to heavy traffic loading and the changing climatic conditions. However, if the pavement maintains suitable load transfer across the joints, fatigue damage can be delayed, reducing the number of corner breaks. However, when load transfer is lost, the joint allows water to infiltrate the pavement system. For a granular subbase, the annual precipitation and freeze-thaw cycles cause it to erode. If the pavement has adequate drainage, then the rate of erosion will not be as severe. For stabilized bases, corner cracking is still possible, because the pavement loses support when it lifts off the stiff subbase.
The loss of subbase support due to built-in curling or subbase erosion is aggravated by heavy traffic loading. When loaded, the pavement surface is in tension, so top-down corner cracking is the mode of failure as shown in figure 43. Traffic is one of the major factors that influence the pavement surface's state of stress, but thermal gradients caused by seasonal temperature changes can have a similar effect. At a certain temperature or time of day, the curling stresses can equal or exceed the wheel stresses.(39) This demonstrates the importance of thermal gradients on pavement performance.
A photograph of two corner breaks is provided in figure 44.
Figure 44. Photograph of corner breaks. Joints and corner breaks are enhanced for clarity.
Several criteria must be met for a crack to be classified as a corner break. The crack must extend vertically through the thickness of the slab. Also, as figure 45 shows, the crack must intersect both the transverse joint and the longitudinal joint at less than 1.8 m from the slab corner.(15)
Figure 45. Plan view of JPCP showing a corner break.
A typical curve showing the growth of corner breaks as a function of cumulative load applications is given in figure 46. The shape of this curve is similar to the one for transverse cracking (section 4.3). Initially, the percentage of corner breaks is relatively minor when the pavement is first loaded. But as climatic cycles and wheel loadings increase, the number of corner breaks rises sharply. After this rapid period of growth, the cracking damage typically levels off.
Figure 46. History of JPCP corner breaks.
Spalling distress is the cracking, breaking, or chipping of the slab edges within 0.6 m of the joint or crack.(15) Several factors have been found to contribute to development of spalling in concrete pavements. Some of the most common factors include: moisture loss at the pavement surface, presence of incompressibles at the joint, freeze-thaw action, traffic loads, mix proportioning, weak concrete at the surface due to poor finishing techniques, aggregate type used, width of the crack, type of joint sealant, and poorly designed or constructed load transfer devices. (See references 15, 16, 42, and 43.)
This section describes the mechanisms involved in developing spalling distress primarily due to moisture loss at the surface. A schematic representation of these mechanisms, and the processes involved, is presented in figure 47.
Figure 47. Flowchart outlining impact of early-age input on long-term delamination spalling distress for JPCP and CRCP.
During pavement construction, early-age inputs such as materials, climate, and construction procedures affect the strength and stress development in the pavement. During this early-age period, development of stresses exceeding the strength of the concrete may result in delamination areas near cracks or joints. These delaminated areas later interact with long-term variables such as traffic, climate, and other factors that contribute to spalling distress. In the long term, during the service life of the pavement, the distress progression is a result of the initial pavement behavior and the long-term inputs. A more detailed discussion about each one of the processes contributing to spalling development is provided in the following sections.
As discussed in section 2.4.1, potential for delamination is a function of the strength development and shear stresses produced by the drying shrinkage differential throughout the slab depth.
Primary factors that contribute to strength development and to the level of shearing stresses in the slab are:
The factors affecting the strength development in the concrete are discussed in section 5.2.6. For delamination spalling, the strength of the concrete is primarily affected by loss of moisture at the surface. Moisture loss at the surface results in a moisture gradient in the slab, as shown in figure 48. Due to the moisture gradient, the rate of strength development will decrease for the concrete at the surface. Therefore, the concrete strength will not be uniform throughout the pavement depth as shown on figure 49. It is important to note that the concrete strength throughout the pavement depth also will be a function of the temperature gradient, and the moisture loss at the bottom of the pavement as affected by moisture conditions at the subbase.
Figure 48. Relative humidity as a function of slab depth.
Figure 49. Strength development as a function of slab depth.
Reduced strength of the concrete at the surface also has been attributed to problems with inadequate mix proportioning combined with poor finishing practices. Mixes with high contents of fine aggregate and cement often result in segregation problems that can result in weak concrete at the surface, especially if overworked. Other contributing factors include poor consolidation (high entrapped air) and lack of entrained air when concrete resistant to freezing and thawing is required.(42)
The moisture gradient also can produce a drying shrinkage differential in the slab. Because the pavement is restrained by its own weight, the subbase, and reinforcement in the case of doweled pavement or CRCP, shear stresses tend to develop throughout the slab depth, as shown in figure 50.
Figure 50. Shear stresses as a function of slab depth.
In theory, whenever the tensile or shear stresses exceed the concrete strength, cracking in a horizontal plane parallel to the pavement surface will tend to develop, as illustrated in figure 51. These horizontal cracks usually occur close to joints or crack, and have typical depths of 13 to 75 mm. These cracks are commonly known as delamination.(16)
The depth of the delamination will be primarily a function of the evaporation rate, the type of curing, and the time to application of curing.
Figure 51. Delamination mechanism.
Although the formation of delamination planes may not be evident in the early age, subsequent climatic fluctuations, coupled with traffic loading, will induce tensile stresses at the area of the delaminated concrete that eventually break continuity with the pavement. Depending on the shape and depth of the delamination, concrete strength, level of stresses that develop, and the fatigue properties of the concrete, vertical cracks may form at those locations, as illustrated in figure 52.
Figure 52. Vertical cracks at delaminated areas leading to spalling distress.
As mentioned in section 2.3.3, other concrete delamination mechanisms include delamination at the steel depth in CRCP due to steel corrosion, two-layer concrete construction, excessive temperatures gradients in the slab, and restraint imposed by dowels.
Depending on the magnitude of traffic loads, temperature fluctuations, and concrete fatigue characteristics, the vertical cracks formed at the delaminated areas eventually translate into spalling distresses. Delamination spalling is characterized by small pieces of concrete near cracks or joints that come apart from the pavement as a result of traffic and environmental forces. Spalling distresses affect the riding quality and the structural integrity of the pavement, and therefore affect the performance of the pavement in the long term. Spalling also reduces the pavement cross section, and therefore the load transfer efficiency is reduced across joints or cracks.(44) Typical cases of delamination spalling are presented in figures 53 and 54.
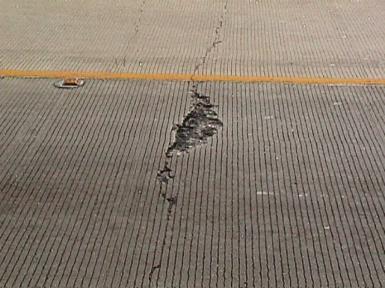
Figure 53. Delamination spalling at a CRCP crack.
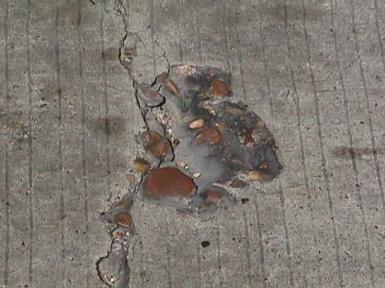
Figure 54. Round-shaped aggregates at a spalled CRCP crack.
The depth of the delamination correlates with the evaporation rate occurring in the early age. According to experience, high evaporation rates in the early age lead to higher depths of delamination. In the long term, as observed in figure 55, low evaporation rates usually produce a greater rate of spalling than high evaporation rates in the first few years. However, the spalling rate tends to flatten out faster, as opposed to high evaporation rates, where the spalling development keeps increasing. This phenomena is attributed to the fact that low evaporation rates produce shallower delamination depths than high evaporation rates. Due to the proximity to the surface, delaminations with shallower depths are more prone to being affected by traffic loads than delamination of greater depths. Depending on the fatigue characteristics of the concrete, deeper delaminations will start to be affected later and usually will result in a higher severity spalling. In some cases, the development of spalling distress may occur during construction operations or early in the life of the pavement.
Figure 55. Spalling progression as a function of evaporation rate.(16)
Deflection spalling generally is found on airport pavements or on very thin slabs. On airport pavements, spalling is caused by heavy aircraft loads. The heavy vertical loadings deflect the concrete pavements significantly at the joints and/or cracks. If the joint or crack is tight, or if incompressibles are present, the tops of the adjoining slabs bear on each other, and the concrete crushes. The breaking and chipping of the concrete is termed a deflection spall. Deflection spalls also form in thin slabs, such as ultrathin whitetopping, because the thin slabs also experience high deflection. Deflection spalls are not commonly found on interstate highway pavements thicker than 200 mm. The flowchart connecting early-age mechanisms to deflection spalling is shown in figure 56. Each of the seven sections are discussed in greater detail below. Deflection spalls can form in both CRCP and JPCP pavements.
Figure
56. Flowchart outlining the impact of early-age
input on long-term
deflection spalling performance for JPCP and CRCP.
The early-age inputs that impact deflection spalling are listed in step 1 of figure 56. The inputs address concrete mix design, pavement design, climatic conditions, and construction practices. The concrete mix should be tailored for optimal concrete strength. The joint/crack spacing in the pavement should be designed to keep the joint/crack openings tight, even when the pavement is subjected to climatic temperature and moisture changes. Construction practices should aim to reduce corner deflections. Similarly, the fresh concrete should not be overworked at the pavement's surface during construction because this weakens its strength.
The concrete's strength and stiffness development is important. Concrete strength at the edges of the adjoining pavements needs to be maintained to prevent crushing of the concrete.
The stresses and strains generated in the early-age pavement control the size of the joint opening. Likewise, the corner deflection of the pavement will later control the degree of deflection spalling.
The size of the joint opening controls the efficiency of load transfer. Loss of load transfer means that joint deflection will increase. Similarly, the pressure on the concrete at the joint increases when loaded vertically.
As figure 57 illustrates, deflection spalling of the pavement is caused primarily by heavy wheel loading (with respect to the structural capacity of the pavement). These wheel loads cause the pavement joints/cracks to deflect and the top edges of the adjacent slabs to press together, thus producing significant compressive stresses causing crushing in the top layer of the slab.
Figure 57. Schematic of deflection spalling mechanism.
The mechanism behind deflection spalling is shown more clearly in figure 58. The compressive stresses crush the concrete at the joint/crack. The severity of the distress is controlled by the pavement's deflection at the joint/crack (d).
Figure 58. Schematic of deflection spalling mechanism.
If the joint/crack width is kept tight and incompressibles kept out, deflection spalling can be minimized. The tight joint/crack will maintain the load transfer, and the deflection will be reduced. Another way to alleviate the severity of deflection spalling is to use a subbase with low deformation properties, such as a stabilized subbase. Heavy wheel loads would not have as great an impact with tight joints/cracks and stiffer subbases.
A photograph of deflection spalling is shown in figure 59. It can be seen that the top layer of concrete on both sides of the adjoining slab edges has spalled off. These spalls are deep, sometimes 76 mm or deeper. In this case, aircraft have generated the heavy loads required for deflection spalling to occur.
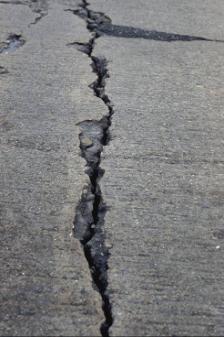
Figure 59. Photograph of deflection spalling on a CRCP.
The rate of spalling increases with time, as shown in figure 60. Over time, and with increased traffic loadings, microcracks form in the concrete to reduce its strength and durability. After the critical number of loads has been reached, the concrete will crush and deflection spalls will form.
Figure 60. Schematic of percent JPCP spalled joints/cracks vs. time.
Punchout distress is a condition that usually occurs in CRCP pavements between closely spaced cracks. Loss of aggregate interlock at the cracks, a function of crack width and traffic loads, can cause the slab to act as a cantilever beam, inducing high transverse (perpendicular to the direction of traffic) tensile stresses at the surface. Depending on the magnitude of the tensile stresses, strength and fatigue characteristics of the concrete, and traffic load applications, a longitudinal crack may eventually form between transverse cracks (CRCP transverse crack development is described in section 2.3). The result is a punchout. Progression of the punchout distress continues with traffic loads and climate cycles that induce spalling at the cracks, further loss of support, pumping, reduced subgrade support, and increased severity of the punchout distress.(15)
This section describes the mechanisms involved in the development of punchout distress, primarily early-age factors such as crack spacing and crack width. A schematic representation of these mechanisms and the processes involved is presented in figure 61.
Figure 61. Flowchart outlining impact of early-age input on long-term punchout distress of CRCP.
Initially, during pavement construction, early-age inputs such as materials, climate, and construction procedures (step 1) affect the strength, stiffness (step 2), and stress development in the pavement (step 3). The interaction of strength, stiffness, and stress development will lead to formation of cracking patterns (step 4) that will vary according to materials properties, climate, and design factors. The spacing and width of the cracks that form are determining factors in the magnitude of the stresses that later generate as a function of traffic loads, climatic cycles, load transfer, subgrade support, and concrete fatigue characteristics (step 5). Eventually, longitudinal cracks may form that will create an isolated piece of slab commonly referred to as a punchout (step 6). Progression of punchout distresses with time will be a function of the evolution of the cracking patterns and long-term inputs with time (step 7). A more detailed discussion about each one of the processes contributing to punchout development is provided in the following sections.
Early-age inputs that contribute to punchout formation are typically those inputs that affect the crack spacing, crack width, and steel stress during the early age. These factors include coarse aggregate type, steel reinforcement details, placement temperature, placement season, curing procedures, time when crack occurs, slab thickness, and subbase type.
The strength development in the concrete is important in preventing punchout distresses. The strength at the cement-aggregate interface directly influences the load transfer achieved through aggregate interlock. On the other hand, the strength of the concrete will govern the formation of cracks due to tensile stresses. In the same manner, the elastic modulus or stiffness of the concrete will directly affect the level of stresses that develop.
As described in chapter 2, volume changes resulting from temperature and moisture variations induce significant stresses in the concrete primarily as a function of the difference in the CTE of steel and concrete, the concrete drying shrinkage, the slab curling and warping, and the restraints imposed by the steel and the subbase.
As a consequence of the tensile stresses that develop in the concrete, transverse cracks tend to form to relieve the stresses. Important characteristics of these cracks are the crack spacing and crack width, because they govern the stresses that develop in the long term as a function of traffic loads and climatic conditions.
In the long term, factors such as joint load transfer, traffic loads, climatic cycles, and subgrade support interact with the initial crack spacing and crack width to determine the level of stresses that develop in the CRCP. With time, the initial crack spacing will continue to change as a function of the combined effect of temperature fluctuations, drying shrinkage, and traffic loads. The crack width that initially may govern the load transfer through aggregate interlock also will change with time as a function of drying shrinkage, temperature fluctuations, and newly formed cracks.
As figure 62 conceptually demonstrates, the interaction of crack spacing and crack width with long-term factors will govern the level of tensile stresses that develop. For long crack spacings, the bending stresses that generate at the edge due to wheel loads are higher than for short crack spacings. However, the stress tends to reach a maximum at a relatively long crack spacing, and it remains at that level even for longer crack spacings, if all factors are the same (see figure 63). On the other hand, short crack spacings generate significant bending stresses in the transverse direction. The load transferred in the longitudinal direction across transverse cracks will depend on the moment transfer and aggregate interlock that, in turn, are a function of crack width as well as the dowel action produced by the reinforcing steel.(20)
Figure 62. Schematic of position of tensile stresses in CRCP.
Figure 63. CRCP longitudinal and transverse stresses in CRCP as a function of crack spacing.
Eventually, load transfer at transverse cracks is reduced due to traffic and temperature fluctuations. That is, the loss of load transfer reduces the capacity of the pavement to distribute load across transverse cracks (longitudinal direction). As a result, the slab between short cracks will tend to act as a beam with the longer dimension in the transverse direction, producing high bending stresses in the slab. The deflection produced by wheel loads thus tends to increase, aggravating the loss of aggregate interlock. In addition, the repeated action of traffic and precipitation, combined with subbases prone to erosion, may weaken the support provided by the subgrade. Depending on the strength and fatigue characteristics of the concrete, subgrade support, loss of load transfer, and load applications, longitudinal cracks interconnecting closely spaced transverse cracks form and lead to what is commonly known as a punchout distress. This is illustrated in figure 64.
At every individual punchout location, the isolated piece of slab between transverse and longitudinal cracks will eventually continue to deteriorate, inducing spalling at the cracks. Reduced subgrade support and loss of load transfer may also result. In advanced stages of punchout distress, the traffic applications, combined with loss of support, load transfer, and pavement stiffness, rupture the steel reinforcement. Corrosion also causes steel rupturing, which can contribute to a significant reduction in the cross-sectional area of the reinforcement.(18)
The number of punchout distresses commonly increases with time. Faulting progression for a typical CRCP section is shown in figure 65. Faulting progression is a function of the continuing pumping of the subbase materials, loss of aggregate interlock, concrete strength and fatigue characteristics, traffic applications, and climatic conditions.
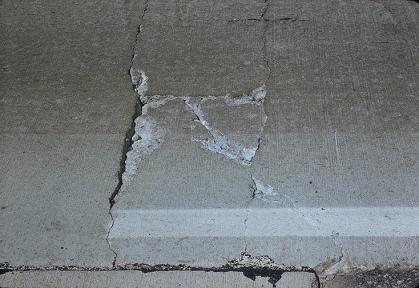
Figure 64. Typical CRCP punchout distress.
Figure 65. CRCP punchout progression with time.

