U.S. Department of Transportation
Federal Highway Administration
1200 New Jersey Avenue, SE
Washington, DC 20590
202-366-4000
Federal Highway Administration Research and Technology
Coordinating, Developing, and Delivering Highway Transportation Innovations
 |
| This report is an archived publication and may contain dated technical, contact, and link information |
|
Publication Number: FHWA-HRT-05-081 Date: October 2005 |
Previous | Table of Contents | Next
In this study, a test to assess the validity of the analytical model was conducted. Since the experimental mechanical behavior of the reinforced concrete slab under concrete volume change can be estimated in terms of strain, the strain equation needs to be derived from the analytical model. The strain, ![]() , that can be measured by the strain gage on the reinforced concrete slab is the resulting concrete strain due to the concrete volume change, εc, and the restraint from reinforcement, (εc)avg.
, that can be measured by the strain gage on the reinforced concrete slab is the resulting concrete strain due to the concrete volume change, εc, and the restraint from reinforcement, (εc)avg.
![]()
Figure 28. Equation.![]() .
.
where (εc)avg = (sc)avg/Ec. Thus,
Figure 29. Equation. ![]() .
.
and
Figure 30. Equation. ![]() .
.
where ![]() and
and ![]() are the strains due to concrete shrinkage and temperature variation, respectively. The (εc)avg in figure 28 is obtained from (σc)avg that is analytically derived for the averaged concrete stresses in the radial (r-) direction at any x-locations. Based on the previous discussion of FE model agreement (figure 27), this value can still adequately represent the reinforcement restraint-induced strain which is uniformly distributed throughout the lateral direction at around the longitudinal middle of the slab. The experiment was conducted considering the temperature variation-induced strain on three laboratory slab specimens: a plain concrete slab, a steel (number 4 rebar with a radius of 6.35 mm (0.25 inch); r = 0.01695) reinforced concrete slab, and a GFRP (number 4 rebar) reinforced concrete slab.
are the strains due to concrete shrinkage and temperature variation, respectively. The (εc)avg in figure 28 is obtained from (σc)avg that is analytically derived for the averaged concrete stresses in the radial (r-) direction at any x-locations. Based on the previous discussion of FE model agreement (figure 27), this value can still adequately represent the reinforcement restraint-induced strain which is uniformly distributed throughout the lateral direction at around the longitudinal middle of the slab. The experiment was conducted considering the temperature variation-induced strain on three laboratory slab specimens: a plain concrete slab, a steel (number 4 rebar with a radius of 6.35 mm (0.25 inch); r = 0.01695) reinforced concrete slab, and a GFRP (number 4 rebar) reinforced concrete slab.
The mechanical behavioral differences between the aforementioned slabs under a temperature change can be presented in terms of the differences in the deformations developed in the slabs. In order for the analytical model to predict the strain differences between the slabs under the temperature change, the CTEs of the reinforcements used in the slabs should be known. Therefore, an experiment to measure the CTEs of the steel and GFRP rebars using strain gages was conducted prior to the experiment on the slabs. The experimental method using strain gages has been standardized as an alternative method to accurately measure the CTEs of a test material with respect to that of any reference material having a known CTE.(31,32) Rebars-15.24 cm (6 inch) long number 4 steel and GFRP-were prepared along with a reference material, titanium silicate, having an extremely low CTE (about 0.0 ![]() /°F) over the temperature range of interest (from -29 °C (-0.2 °F) to 49 °C (120.2 °F)); grade 60 deformed steel rebar and the GFRP rebar manufactured by Marshall Industry Composite, Inc., were employed. A strain gage (EA-06-125BB-120; Measurement Group, Inc.) was attached at the middle of each of the steel and GFRP rebars in the longitudinal direction as well as at that of the titanium silicate strip, as shown in figures 31, 32, and 33.
/°F) over the temperature range of interest (from -29 °C (-0.2 °F) to 49 °C (120.2 °F)); grade 60 deformed steel rebar and the GFRP rebar manufactured by Marshall Industry Composite, Inc., were employed. A strain gage (EA-06-125BB-120; Measurement Group, Inc.) was attached at the middle of each of the steel and GFRP rebars in the longitudinal direction as well as at that of the titanium silicate strip, as shown in figures 31, 32, and 33.
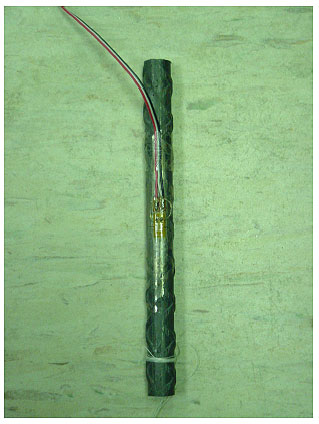
Figure 31. Photo. Number 4 steel rebar specimen for CTE measurement.
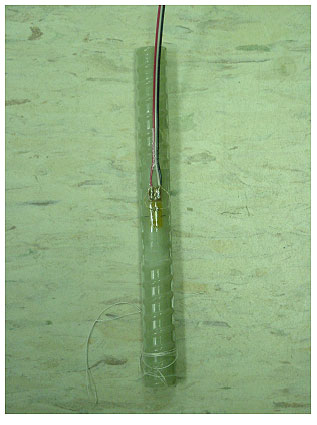
Figure 32. Photo. Number 4 GFRP rebar specimen for CTE measurement.
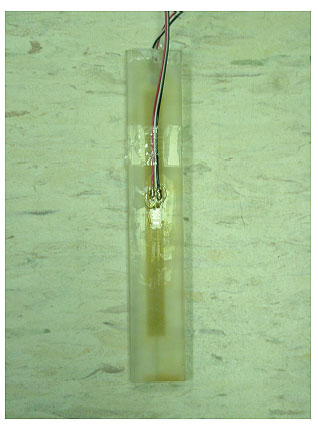
Figure 33. Photo. Titanium silicate strip specimen for CTE measurement.
The steel and GFRP rebars were then housed in the environmental chamber along with the titanium silicate strip so that both rebars and the titanium silicate strip were subjected to the cyclic temperature change simultaneously. The rebars and titanium silicate strip were suspended from one end so that friction could not impede their expansion or contraction due to temperature change. The measurement was conducted three times for each of the steel and GFRP reinforcing rebars. Two cycles of temperature change were applied for each measurement. Each cycle of temperature change consisted of 43 °C (109.4 °F) ® 49 °C (120.2 °F) ® 22 °C (71.6 °F) ® -29 °C (-20.2 °F) ® 43 °C (109.4 °F), would take about 5 d.
The output of the strain gage induced by temperature change is defined as thermal output. The thermal output of the gage is caused by combined resistance changes resulting from (1) changes with temperature in the resistivity of the gage grid alloy, and (2) the mechanical strain of the strain grid by an amount equal to the difference in the expansion coefficient between the gage grid alloy and the test material. The thermal output does not directly represent genuine strain of the test material induced by the temperature change and must be adjusted accordingly. As given in figure 34, the strain of the test material can be obtained by rearranging the equation
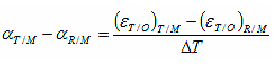
Figure 34. Equation. ![]() .
.
where aT/M and aR/M = CTEs of test and reference materials, respectively; and (eT/O)T/M and (eT/O)R/M = thermal outputs of test and reference materials, respectively. Since the CTE of the reference material (titanium silicate) is 0.0 ![]() °F in this study, figure 34 becomes
°F in this study, figure 34 becomes
![]()
Figure 35. Equation. ![]() .
.
The difference between the thermal outputs of the test and reference materials, which are obtained experimentally, can then represent the strain of the test material induced by the temperature change. The CTE of the test material can thus be obtained since ![]() T is experimentally known. For each measurement, the thermal output was set to 0
T is experimentally known. For each measurement, the thermal output was set to 0 ![]() at a reference temperature, To, of about 43°C (109.4 °F). From each rebar as well as from titanium silicate strip, the thermal output was collected at each temperature level, and the CTE of each rebar was obtained. It was also observed from the measurements that the thermal outputs were highly repeatable at a similar measured temperature, and the CTE of each rebar was fairly consistent at different applied temperature levels as shown in table 2 and figure 36, which correlate to the third measurement. The average CTEs from the three measurements were about 11.88 me/°C (6.6 me/°F) for steel rebar and 9.18 me/°C (5.1 me/°F) for the GFRP rebar.
at a reference temperature, To, of about 43°C (109.4 °F). From each rebar as well as from titanium silicate strip, the thermal output was collected at each temperature level, and the CTE of each rebar was obtained. It was also observed from the measurements that the thermal outputs were highly repeatable at a similar measured temperature, and the CTE of each rebar was fairly consistent at different applied temperature levels as shown in table 2 and figure 36, which correlate to the third measurement. The average CTEs from the three measurements were about 11.88 me/°C (6.6 me/°F) for steel rebar and 9.18 me/°C (5.1 me/°F) for the GFRP rebar.
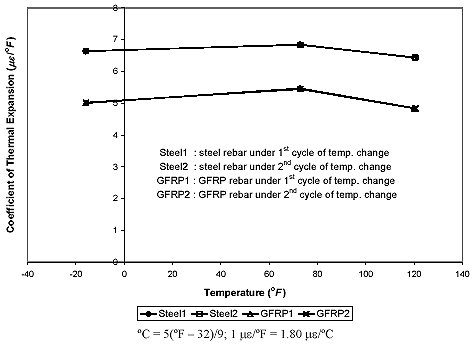
Figure 36. Graph. Coefficient of thermal expansion versus temperature for reinforcing rebars from third measurement.
The three laboratory slab specimens were cast and cured for about 5 months at room temperature and 40~45 percent RH before the experiment. Drying shrinkage effect would be negligible during the experiment. A thermocouple was set in the center of each slab before the concrete cast, and a strain gage (N2A-06-40CBY-120; Measurement Group, Inc.) was attached in the center of the upper surface of each slab after the curing process. The slabs were then subjected to cyclic temperature changes in an environmental chamber with temperature and humidity control. The schematic details of the specimens are shown in figure 37, and photos are shown in figures 38 and 39.
| Temperature (T; °F1) | Elapsed time (h) | Thermal Output (εT/O; |
(εT/O) T/M - (εT/O) R/M |
||||||
|---|---|---|---|---|---|---|---|---|---|
| Titanium silicate | Steel | GFRP | Steel | GFRP | Steel | GFRP | |||
| 109.2 | 0 | 0 | 0 | 0 | ~ | ~ | ~ | ~ | ~ |
| 120.1 | 24 | -74 | -3 | -21 | 10.9 | 70 | 53 | 6.4 | 4.8 |
| 72.7 | 48 | 247 | -3 | 47 | -36.5 | -250 | -199 | 6.8 | 5.5 |
| -16.0 | 60 | 633 | -198 | 6 | -125.2 | -831 | -627 | 6.6 | 5.0 |
| 110.2 | 87 | 2 | 0 | -1 | ~ | ~ | ~ | ~ | ~ |
| 109.7 | 94 | 1 | 0 | -1 | ~ | ~ | ~ | ~ | ~ |
| 120.5 | 144 | -76 | -4 | -22 | 11.3 | 73 | 55 | 6.4 | 4.8 |
| 72.9 | 168 | 246 | -2 | 48 | -36.3 | -248 | -198 | 6.8 | 5.4 |
| -15.9 | 180 | 631 | -199 | 3 | -125.1 | -830 | -628 | 6.6 | 5.0 |
| 110.0 | 207 | 1 | 0 | 1 | ~ | ~ | ~ | ~ | ~ |
| Average: | 6.6 | 5.1 | |||||||
1 °C = 5(°F - 32)/9.
2 1 (![]() T °F) = 0.56 (
T °F) = 0.56 (![]() T °C);
T °C);
3 To = 42.9 °C (109.2 °F).
41 ![]() /°F = 1.80
/°F = 1.80 ![]() /°C
/°C
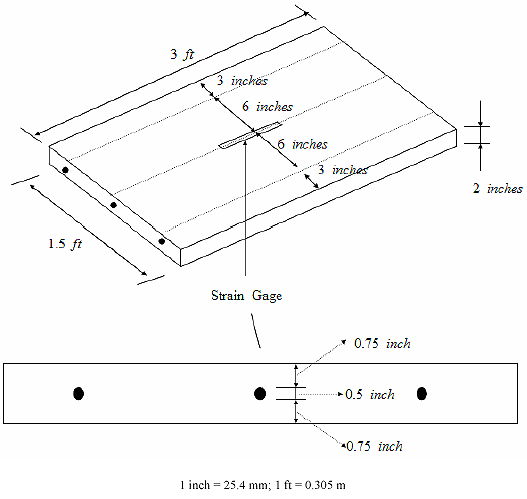
Figure 37. Drawing. Schematic details of concrete slabs used in experiment.
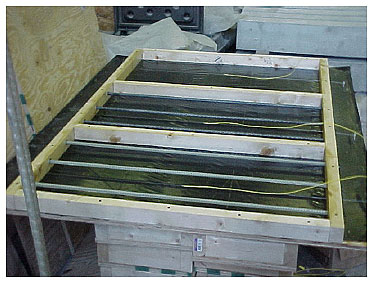
Figure 38. Photo. Concrete slab molds before concrete cast.
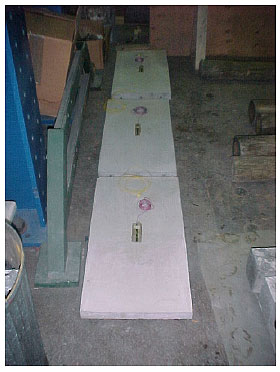
Figure 39. Photo. Concrete slabs attached with strain gages.
In the concrete slab experiment, each slab was supported on three lubricated rollers in order to minimize the frictional effect. The experiment was also conducted three times, and, at each time, the slabs were subjected to two cycles of temperature change as the CTE measurement experiment was. The titanium silicate strip, now attached with a strain gage (N2A-06-40CBY-120) at its middle in a longitudinal direction, was also employed in the experiment on the slabs. The experiment followed the same procedure as previously mentioned. A concrete CTE of 9.36 ![]() /°C (5.2
/°C (5.2 ![]() /°F), which was an average of the CTEs measured from the plain concrete slab, was utilized for the analytical calculation using figure 31, and the results are shown in figure 40. In addition, the Young's modulus of concrete of 30.5 GPa (4,420 ksi) used in the calculation was obtained experimentally from the results of the compressive tests of three 15.24- by 0.48-cm (6- by 12-inch) concrete cylinders cast at the same time as the concrete slabs. In the figure, it is predicted that the axial concrete strains calculated for the steel-reinforced slab have higher contraction magnitudes (shown as negative values) than those for the plain and GFRP-reinforced slabs under temperature drop. This is reasonable since the CTE of the steel rebar is higher than those of the concrete and GFRP so that the steel reinforcement adds more contraction on the concrete. Since the GFRP rebar used has a CTE similar to that of the concrete, the strain values calculated for the GFRP-reinforced slab are also close to those for the plain slab.
/°F), which was an average of the CTEs measured from the plain concrete slab, was utilized for the analytical calculation using figure 31, and the results are shown in figure 40. In addition, the Young's modulus of concrete of 30.5 GPa (4,420 ksi) used in the calculation was obtained experimentally from the results of the compressive tests of three 15.24- by 0.48-cm (6- by 12-inch) concrete cylinders cast at the same time as the concrete slabs. In the figure, it is predicted that the axial concrete strains calculated for the steel-reinforced slab have higher contraction magnitudes (shown as negative values) than those for the plain and GFRP-reinforced slabs under temperature drop. This is reasonable since the CTE of the steel rebar is higher than those of the concrete and GFRP so that the steel reinforcement adds more contraction on the concrete. Since the GFRP rebar used has a CTE similar to that of the concrete, the strain values calculated for the GFRP-reinforced slab are also close to those for the plain slab.
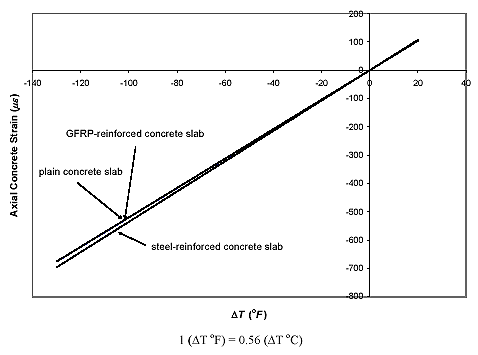
Figure 40. Graph. Axial concrete strain at midspan versus temperature change from analytical calculation.
In figures 41, 42, and 43, the axial concrete strains measured at the midspan of each slab over the temperature changes ranging from T = +49 °C (+120.2 °F) to -29 °C (-20.2 °F) are compared with the analytical calculations which employ the aforementioned material properties; some other material properties necessary for the analysis-such as the Poisson ratio of the concrete and the Young moduli of the steel and GFRP rebars-are the same as those listed in table 1. In the figure, the nomenclature of Test#X-Y represents the test results from the Yth temperature change cycle of Xth test. It is shown in the comparison that the experimentally obtained strains are fairly well distributed around the calculated strains, which are shown as solid lines. In addition, the measured strains under freezing temperatures seem to have contraction magnitudes that are somewhat smaller than the calculated values. This may result from the expansion of concrete and the higher Young's modulus of concrete caused by moisture freezing in the concrete. The experimentally measured strains are tabulated in table 3.
Similar results are also expected as the concrete shrinkage is considered. Therefore, the analytical model can be a useful means of evaluating the stress or strain level around the middle of a freely supported reinforced slab that is subjected to concrete shrinkage and temperature change.
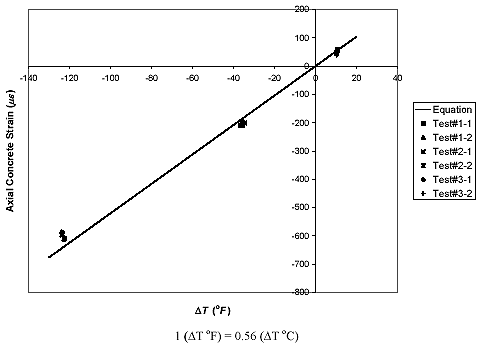
Figure 41. Graph. Axial concrete strain at midspan versus temperature change for plain concrete slab (reference temperature, To = about 42.39 °C (108.3 °F)).
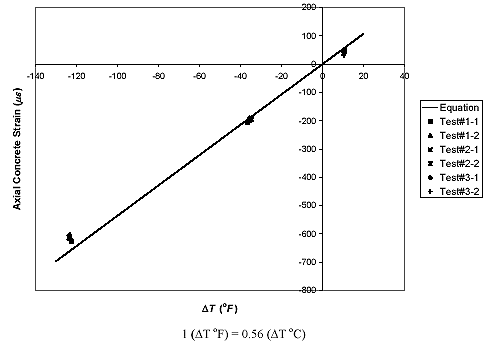
Figure 42. Graph. Axial concrete strain at midspan versus temperature change for steel-reinforced concrete slab (reference temperature, To = about 42.39 °C (108.3 °F)).
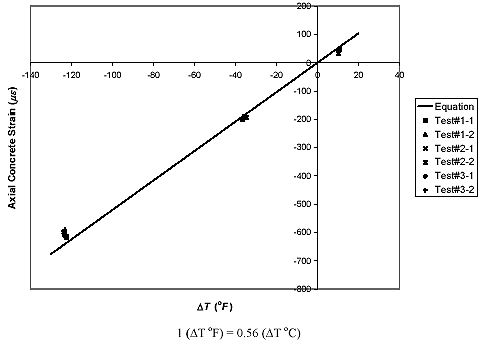
Figure 43. Graph. Axial concrete strain at midspan versus temperature change for GFRP-reinforced concrete slab (reference temperature, To = about 42.39 °C (108.3 °F)).
| Temperature (T; °F1) |
Elapsed Time (h) |
Thermal Output (ε |
(εT/O) T/M - (εT/O) R/M ( |
||||||||
|---|---|---|---|---|---|---|---|---|---|---|---|
| TS | PS | S-RS | G-RS | PS | S-RS | G-RS | |||||
| 1st Test: To= 108.0°F | 1st Cycle |
108.0 | 0 | 0 | 0 | 0 | 0 | ~ | ~ | ~ | ~ |
| 118.9 | 24 | -68 | -8 | -22 | -21 | 10.9 | 60 | 46 | 47 | ||
| 71.5 | 48 | 224 | 15 | 19 | 25 | -36.5 | -209 | -205 | -200 | ||
| -14.6 | 60 | 564 | -46 | -64 | -52 | -122.6 | -610 | -628 | -616 | ||
| 107.0 | 87 | 2 | 10 | 16 | 10 | ~ | ~ | ~ | ~ | ||
| 2nd Cycle | 108.0 | 94 | 3 | 5 | 11 | 8 | ~ | ~ | ~ | ~ | |
| 118.4 | 144 | -70 | -13 | -21 | -18 | 10.4 | 57 | 49 | 51 | ||
| 72.4 | 168 | 223 | 15 | 24 | 28 | -35.6 | -208 | -199 | -195 | ||
| -14.7 | 180 | 563 | -47 | -55 | -47 | -122.7 | -610 | -618 | -611 | ||
| 108.1 | 207 | 3 | 7 | 13 | 12 | ~ | ~ | ~ | ~ | ||
2nd Test: To = 108.3°F |
1st Cycle | 108.3 | 0 | 0 | 0 | 0 | 0 | ~ | ~ | ~ | ~ |
| 119.0 | 24 | -69 | -13 | -23 | -22 | 10.7 | 57 | 46 | 47 | ||
| 73.7 | 48 | 223 | 22 | 29 | 29 | -34.6 | -201 | -194 | -194 | ||
| -15.4 | 60 | 562 | -34 | -50 | -36 | -123.7 | -596 | -612 | -598 | ||
| 108.6 | 87 | 2 | 4 | 5 | -5 | ~ | ~ | ~ | ~ | ||
| 2nd Cycle | 108.7 | 94 | 0 | -7 | -6 | -14 | ~ | ~ | ~ | ~ | |
| 118.6 | 144 | -73 | -24 | -33 | -41 | 10.3 | 49 | 40 | 32 | ||
| 72.6 | 168 | 218 | 15 | 23 | 28 | -35.7 | -202 | -195 | -190 | ||
| -15.2 | 180 | 559 | -36 | -56 | -49 | -123.5 | -596 | -615 | -608 | ||
| 108.5 | 207 | -1 | 1 | 2 | -3 | ~ | ~ | ~ | ~ | ||
3rd Test: To= 108.5 oF |
1st Cycle |
108.5 | 0 | 0 | 0 | 0 | 0 | ~ | ~ | ~ | ~ |
| 119.0 | 24 | -68 | -15 | -24 | -19 | 10.5 | 53 | 44 | 49 | ||
| 73.0 | 48 | 222 | 25 | 31 | 33 | -35.5 | -197 | -190 | -189 | ||
| -15.2 | 60 | 560 | -27 | -47 | -37 | -123.7 | -587 | -607 | -596 | ||
| 109.0 | 87 | 0 | -4 | -6 | -5 | ~ | ~ | ~ | ~ | ||
2nd Cycle |
108.7 | 94 | -1 | -12 | -15 | -10 | ~ | ~ | ~ | ~ | |
| 118.9 | 144 | -70 | -31 | -40 | -30 | 10.4 | 39 | 31 | 40 | ||
| 73.2 | 168 | 220 | 20 | 25 | 28 | -35.3 | -200 | -195 | -191 | ||
| -14.8 | 180 | 557 | -30 | -46 | -32 | -123.3 | -587 | -603 | -589 | ||
| 109.0 | 207 | 1 | -7 | -9 | -6 | ~ | ~ | ~ | ~ | ||

