U.S. Department of Transportation
Federal Highway Administration
1200 New Jersey Avenue, SE
Washington, DC 20590
202-366-4000
Federal Highway Administration Research and Technology
Coordinating, Developing, and Delivering Highway Transportation Innovations
 |
| This report is an archived publication and may contain dated technical, contact, and link information |
|
Publication Number: FHWA-RD-97-146 Date: NOVEMBER 1997 |
Previous | Table of Contents | Next
The use of fluorescence microscopy in the study of HCC was initiated by Wilk, Dobrolubov, and Romer (1974) in Switzerland and was then used mainly as a tool to determine the quality of the air-void system in HCC. Wilk and associates used ultraviolet light transmitted through a thin section. This work prompted my development of a multimode microscope (Walker & Marshall, 1979). The object of the design of the P/EF microscope was to make it possible to view any spot on a thin section with all of the illumination modes of a petrographic microscope and with incident ultraviolet illumination on a single microscope stand so that the specimen did not have to be physically moved from one instrument to another and various forms of illumination did not have to be removed and replaced as the mode of illumination was changed. All the modes of viewing that are possible with a petrographic microscope were combined with the ability to view the fluorescence (when illuminated by ultraviolet light) within a thin section impregnated with specially dyed epoxy (see 5.3.4). The design is such that changing the exciter filters by adjusting a turret housing and the dichroic mirrors (DM) by moving a slide across a slot, exchanging barrier filters (BF), and flipping shutters are all that are required to switch from one mode to another. Soeder (1990) used epifluorescence microscopy with a different dye, DM, and BFs to study the pore structure of rocks of low permeability.
It was found that when ultraviolet illumination was transmitted through the thin section it caused fluorescence of all the fluorescent dye throughout the thickness of the section. The dye was distributed through all the capillary pores, in all the cracks no matter how small, and in all the small voids remaining in the paste as the cement hydrated. The fluorescence existed throughout the thickness of the section and produced a haze of uncollimated light that confused all viewing with a cloud in which any opaque particles (such as cement ferrites) seemed to float. If the section was more than 25 µm in thickness, even some of the air voids would be difficult to distinguish from the background haze. The work of Beauchamp and Williford (1974) and Beauchamp, Williford, and Gafford (1972) indicated that thinner sections would provide more definition. It was determined that the ultraviolet illumination must be incident (come from the direction of the objective, i.e., epi) upon the thin section so that the portion of the specimen being viewed was the first part of the specimen illuminated; thus, the ultraviolet light exciting the most clearly viewed fluorescence was not shaded by other portions of the specimen (Walker & Marshall, 1979).
The question has been asked: "Why use a thin section? Why not just use a highly polished slice for this incident light microscopy? After all, that is how one studies ore specimens." The answer is two-fold: (1) Ore specimens are opaque, and only the features on the surface are visible in incident illumination. Most of the components of HCC are translucent, and light penetrates the specimen. Ultraviolet light causes fluorescence throughout the entire thickness of the specimen and creates a pervasive yellow glow caused by the fluorescent-impregnated porous areas of the paste throughout. This glow of uncollimated fluorescence looks like a pool of glowing liquid in which any opaque particles seem to float. Other details are masked. It is necessary to make the specimen being examined thin so that the unwanted ultraviolet light can go on through and not bounce around and make noisy, meaningless fluorescence. (2) We need to be able to look at any spot of interest with the standard petrographic methods (that require transmitted collimated light) as well as with the fluorescence-causing methods, and we need to do it without switching microscopes and losing our place on the section.
The incident arrangement of the ultraviolet illumination necessitated using uncovered thin sections and the type of objective lenses required by uncovered thin sections. The light created within the specimen by the fluorescence of the dye is uncollimated and radiates from every fluorescent point. Such uncollimated light strikes a cover glass at random angles. Only light that strikes a cover slip at 90° to the surface will travel straight on through. The light produced at other angles bounces around under the cover slip and from the highly finished surface of the thin section and creates a yellow haze that obscures the viewing at all but the lowest magnifications.
Because the incident ultraviolet light is collimated by the objective lens, there is a greater concentration of this light at the point of focus with the higher power lenses; i.e., more ultraviolet light reaches each fluorescent molecule of the dye when the higher power objectives are used. Therefore, the fluorescence is brighter when the higher power objectives are used. At very high magnifications (60X objective), the lens and lens mounting are so close to the specimen that a yellow haze is produced by light bounced from the lens surface to the specimen surface and back, just as when a cover slip is used. This effect precludes the use of oil immersion lenses and lenses of greater power than 40X.
This microscope is diagrammatically shown in Figure 13-1, and a photograph of the equipment is shown in Figure 13-2 (see Walker, 1988). The P/EF microscope described in this chapter was obtained in 1977 under strict budget requirements. A more modern P/EF microscope that was specifically designed for this use would be more convenient than the model described here. Such a microscope might have different exciter filters, DMs, and BFs built into the instrument and would probably have different engravings for the various filters.
The ultraviolet light is incident on the specimen and is produced by a 200-watt mercury arc lamp. Incident microscope illumination requires a vertical illuminator to direct the light to a special mirror (DM) above the objective lens that will direct the light down through the objective without hindering light traveling from the objective to the ocular. For ultraviolet illumination, the wavelength of the light is controlled by the exciter filters, DMs, and BFs.
The vertical illuminator has a built-in turret for exciter filters:
UG-5, ultraviolet light (U engraving)
BG-3, violet light (V engraving)
BG-12, blue-violet light (B engraving)
IF-545 and BG-36, green light (G engraving)
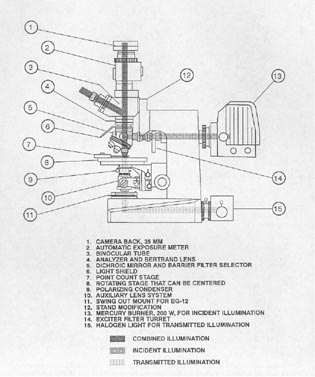
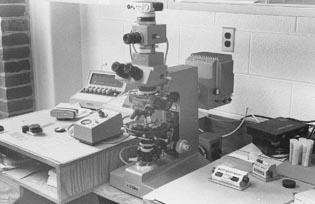
Figure 13-2 P/EF MICROSCOPE. In the right foreground are two pushbutton counters. The camera and exposure meter are on top of the microscope. The control for the exposure meter is between the microscope and the Swift automatic point-counter keyboard in the left background.
There is a slide containing the complementary DMs and BFs controlled by a lever in a four-position slot:
DM 400 with BF L-410 (U engraving)
DM 455 with BF Y-455 (V engraving)
DM 500 with BF 0-515 (B engraving)
the fourth position (G engraving), a straight-through path for ordinary polarized light microscopy (factory altered)
For the particular fluorescent dye in use, the exciter filters built into the turret in the vertical illuminator are usually sufficient. The only exciter filters used are the BG-3 (V engraving) and the BG-12 (B engraving). The illuminator has an accessory slot for the insertion of extra filters. Occasionally, it has been convenient to have an extra BG-12 filter for use in the optional exciter filter slot. The only additional BFs used have been a Y-485, a Y-495, and an .0-515. Figure 13-3 illustrates the relationship of the filters to the dye emittance spectrum. A different dye would have necessitated different filters. To lessen the eye fatigue due to the high contrast, a small amount of transmitted light filtered by a BG-12 filter 3.0 mm in thickness is used. A special swing-out mount for this filter was fabricated in the VTRC shop, as illustrated in Figure 13-4.
The transmitted light is from a low-voltage halogen source. The microscope accessories include a Swift automatic point counter, several other pushbutton counters (for counting voids, cracks, and traverses), and a filar micrometer.
The fluorescence elements are used in the study of HCC mainly because much of the paste (especially the hydration products of the cement) is colorless and has a
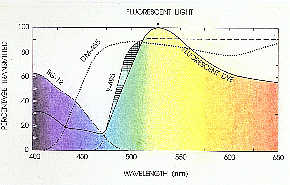
Figure 13-3 RELATIONSHIP OF FILTERS TO DYE EMITTANCE SPECTRUM. Percentage transmittance of exciter filters, dichroic mirrors, and barrier filters of a microsope compared with the excitation spectrum of fluorescent dye.
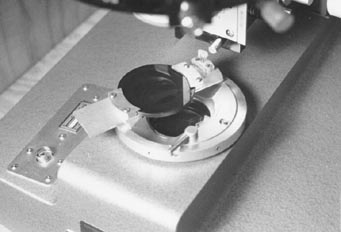
Figure 13-4 SWING-OUT FILTER OVER LIGHT PORT ON BASE OF MICROSCOPE. The filter holder was fabricated in the VTRC shop.
low index of refraction and essentially no birefringence. These properties of the paste are so much like empty space that it is nearly impossible to ascertain, in thin section, whether the microscopist is viewing a paste section or an empty space. The ability to distinguish empty space from colorless substances with zero birefringence is the major reason the fluorescence is such a useful complement to the microscopist's repertory of determinative methods. Included in the apparent empty space are those areas that contained water or air before the drying and vacuum impregnation of the concrete specimen with the dyed epoxy. Such features include cracks in both the aggregate and paste, the porosity of the aggregate, and the capillary system of the paste.
The microscopist can, with this one microscope,
while examining one particular area, switch back and forth between the fluorescence
features and the polarizing features (plane polarized illumination and crossed
nicols); thus, it is possible to detect and assess areas of empty space and
define their relationship to the reaction products, minerals, rock types, coatings
and shapes of the aggregate particles, and other components of the concrete.
A feature not readily recognizable in one mode can be easily examined in another.
The aggregates, secondary mineralization, and reaction products can be identified
and studied with the polarizing capabilities, whereas the areas of empty space
and their distinction from some of the hydration products can be determined
best by use of the fluorescence of the spaces impregnated by the dyed epoxy.
13.2 USES
Because the impregnation with the fluorescent dyecedes the thinning of the section to the point that will create new cracks in the aggregate, it is possible to know whether a particular crack (such as a cleavage crack in aggregate) was indigenous to the specimen or was caused by the processes used in the thinning of the section. If the crack is filled with the fluorescent dye, the crackceded thinning and can be assumed to be a feature of the specimen that was sent before it came to the laboratory.
In concrete, the cracks may go in any direction and often skirt the edges of aggregate particles. Even if the thin section is very thin, there may be no unobscured path along a crack for transmitted light to come through (see Fig. 13-5). The fluorescence of the impregnating epoxy mixture creates light within all the cracks. Even those cracks whose width is below the resolving power of the lenses used may be detected and their location identified. Because of the uncollimated nature of this fluorescent light, the apparent width of these very fine cracks is somewhat increased.
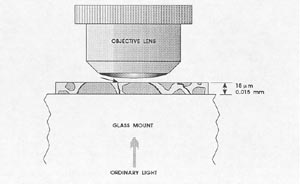
Figure 13-5 CRACKS IN THIN SECTION OF CONCRETE. The arrow indicates the only crack that would be visible with transmitted illumination. Impregnated with a fluorescent dye and illumination with ultraviolet light would make possible the observation of the fluorescence of the dye in the other cracks. (The supporting glass slide would be about 100 times the thickness of the thin section of concrete.)
For laboratory-produced concrete examined at a moderate magnification of about 200X, it was found that air content determinations made on two (more were considered too costly) thin sections of HCC by the fluorescence method had no correlation with the air content determinations made on a finely lapped slice of the concrete by the linear traverse method of ASTM C 457 even though great care was taken to focus on the edges of the voids (see Walker, 1979a). Although there was no correlation in the air-void determinations, a good correlation was found with the determinations of the specific surface and spacing factor. In the original work done by Wilk, Dobrolubov, and Romer (1974), the spacing factor was considered to be the most important parameter to be determined. Because the Virginia specifications for air content are in terms of percentage of air voids, it was decided that this technique did not fill the needs of VDOT.
The optical properties of the cement and the empty space in and near a cement grain when compared with similar properties of cement grains of known age and similar size and history will indicate the approximate age and degree of hydration of the cement.
13.2.4 Effect of Fine Aggregate
A smooth-surfaced, sound, fine aggregate (few re-entrant angles, low porosity, and cracks) will produce a concrete mixture that is easy to finish without additional water. An irregularly shaped or porous fine aggregate will create a harsh mixture with a high water demand and prompt the contractor to add more water (see Appendix D; Walker, 1988). By reason of the poor distribution of the cement and the additional water, the concrete may have low strength. The irregular shape and porosity of the poor sand, pockets of excess water, and concomitant clumped distribution of the cement particles may be observed with the P/EF microscope.
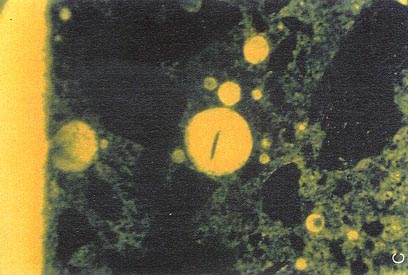
1. Examine fluorescent-impregnated ultrathin sections of HCC with the illuminator set for violet light (V settings). Use the accessory BF Y-485. Under these conditions of illumination, the areas of bright fluorescence (empty areas, air voids, and very porous paste) are bright yellow; areas of lower fluorescence (ordinary paste) are greener; and areas of no fluorescence, such as nonporous aggregate particles, are dark blue.
2. Continually check to ensure that the focus of the microscope is in the proper plane. Even sections as thin as 10µm can be focused on in more than one plane. Keep the focus on the surface of the section that is closest to the objective lens. This plane is the clearest and most free of the circles of confusion caused by nearby out-of-focus objects. Be alert to changes in the focal plane as different thicknesses of the thin section are moved under the microscope. Be aware when objects outside the plane are viewed in an out-of-focus manner. The light from the fluorescence can be so intense that the microscopist may become tempted to register all objects that fluoresce as empty space without checking the plane of focus and ascertaining that the fluorescence is truly from the plane being examined.
3. Make all quantitative determinations (point counting, chord accumulation, and size measurements) on the surface of the section nearest the objective lens (see Fig. 13-6). An object may be seen differently at two different planes of focus (see Fig. 13-7).
1. Check all cracks (in aggregate as well as in paste) seen with the polarizing features of the microscope with the fluorescent features to make sure that they contain fluorescent dye.
2.If fluorescence is lacking, change to the polarization mode and check for very faint birefringence and any relief within the crack that differs from that of the mounting medium. Faint birefringence and unexpected relief indicate the sence of a substance filling the crack such as silica gel or another
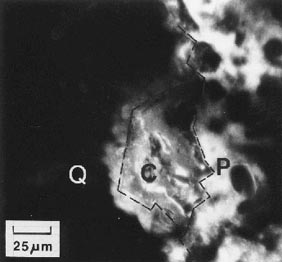
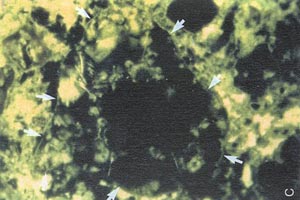
Figure 13-6 FLUORESCENCE FROM POROUS CLAY POCKET SHINING THROUGH EDGE OF QUARTZ PARTICLE. P is the paste. C is the clay pocket. Q is the quartz aggregate. The focus plane is within the section (Walker, 1981).
 |
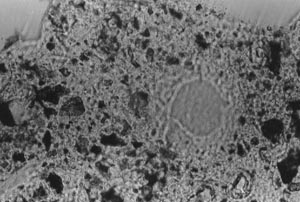 |
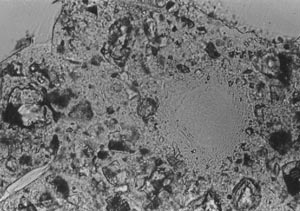
Figure 13-7 VOID IN THIN SECTION. A. Void in thin section with focus plane on top surface of section. B. Same as A with focus plane at bottom of section.
secondary reaction product. If the nonfluorescent crack is really empty, it occurred during thinning of the sample and is not indigenous to the specimen.
3. Check the extent of cracking by examining the specimen with ultraviolet illumination so that the very fine cracks may be observed (see Fig. 13-5). Fluorescence will indicate the fine continuation of the wider, more easily seen cracks and the fine cracks occurring at the boundaries of the aggregate.
1. When the specific surface, spacing factor, or both are the required data and the specimen is too small to allow a sufficient slice to be prepared or equipment necessary to perform an examination in accordance with ASTM C 457 is lacking, examine a minimum of two fluorescent-impregnated ultrathin sections with ultraviolet illumination and an automatic stage, such as the Swift point counter or similar device.
2. With the automatic motion of the point counter, make traverses across the sections at intervals of 2 mm or greater. The traverses must cover the entire usable area of the thin sections.
3. Record all aggregate, paste, and voids that occur at the points defined by the automatic stage.
4. Continually check to ascertain that the focus is on the near surface of the section and that the edge of the void defining the boundary of the void is at the surface. If the void boundary is beneath the surface, ignore the void and record for the point the substance (aggregate or paste) that occurs on the surface plane of examination.
5. Record the number of voids traversed by use of an accessory push-button counter. Unless the distance between points is so small that the entire section is scanned during step 3, this must be performed during a second pass over each traverse.
6. Calculate the data obtained by the method scribed in the modified point-count method of ASTM C 457.
7. Unless the sum of the areas of the thin sections, total length of traverse, and number of points counted are at least the minimum scribed by Tables 1 and 2 of ASTM C 457, do not report the percentage of air voids.
13.3.4 Porosity Related to Carbonation
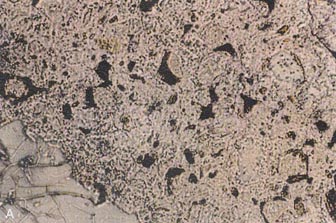
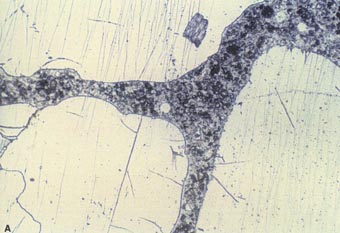
Study the degree of carbonation and the consequences to the integrity of the HCC by switching back and forth between the polarizing and fluorescence features of the microscope as shown in Figures 13-8 and 13-9. Figure 13-8 shows that carbonation on the exterior of HCC can provide a tighter, less permeable structure than exists below the carbonation. Figure 13-9 shows the high porosity that often accompanies and may be the cause of carbonation in the interior of HCC.
13.3.5 Water-Cement Ratio and Permeability
1. Examine the permeability and water-cement ratio of the HCC by estimating the amount of open area shown by the fluorescence of the dye in
 |
 |
 |
Figure 13-8 THIN SECTION OF EXTERIOR PORTION OF HCC. A. The surface exposed to the air is at the top. B. Same view as A but viewed with crossed nicols. The bright area shows the high birefringence of the calcite of the carbonated area. C. Same view as A and B viewed with ultraviolet light, causing flouorescence of the pore structure of the HCC. Notice that there is more porosity indicated by fluorescence in the poration of the HCC furthest from the surface than there is in the carbonated zone.
 |
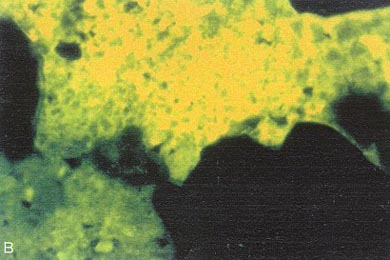 |
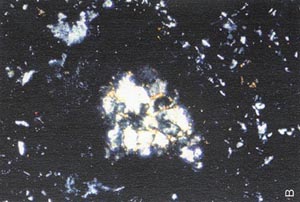
Figure 13-9 THIN SECTION OF INTERIOR PORTION OF HCC. A. Viewed with crossed nicols. The bright area shows the high birefringence of the calcite of the carbonated area. B. Same area as A viewed with ultraviolet light causing fluorescence of the pore structure within the carbonated area.
 |
 |
>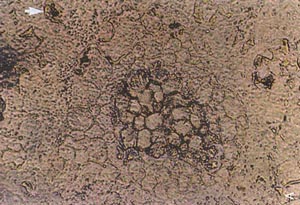 |
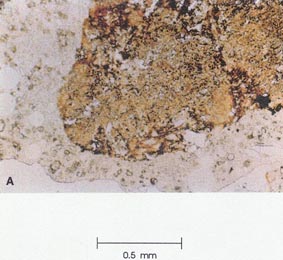
Figure 13-10 THIN SECTION OF 50-YEAR-OLD CONCRETE. At the center is the remnant of a very large cement grain (cement was more coarsely ground then). Modern cement is usually about the size of the completely hydrated and filled cement grain indicated by the arrow. A Viewed with plane poarized illumination. B Same location as A viewed with crossed nicols. Notice the original birefringence still present in the unhydrated central portion of the grain. C. Same location as A viewed with ultraviolet light causing fluorescence of the dye in the pore structure. The structure indicates that the original external boundary of the cement grain was the thin line, here indicated by arrows.
2. To compare the permeability of an HCC containing a specific admixture or an aggregate with the permeability of an HCC of known quality, examine fluorescent-impregnated ultrathin sections of both materials. The material with the fewer fluorescent cracks and capillaries is the one that is less permeable and probably has the lower water-cement ratio.
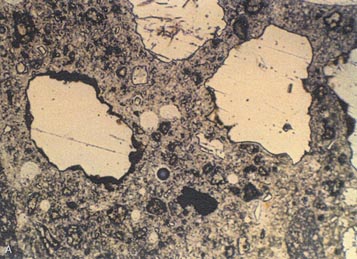
1. Examine cement grains with the polarizing and the fluorescence features of the microscope. The center of an only partially hydrated cement particle will still have the birefringence of the unhydrated cement (see Fig. 13-10).
2. Compare the birefringence of the center of the cement grain with that of cement grains of similar size and history. When a cement particle is completely hydrated, the center may become empty or filled with reaction products (see Fig. 13-11). The size of the compared grains is important because the outer hydrated portion of a very large cement grain can protect the inner portion from hydration.
13.3.7 Quality of Fine Aggregate
1. By means of the polarizing features, examine numerous sand particles in fluorescent-impregnated ultrathin sections of the concrete under study. Identify the minerals, and describe the shape of the particles and any coatings on them.
2. With fluorescence-causing illumination, study the sand particles and the paste in which they are imbedded.
3. Examine the effect of the quality of fine aggregate on the surrounding paste. Notice the bond between the paste and the aggregate, any cracking or porosity within the aggregate, and the distribution of the cement particles.
4. Compare with thin sections of an HCC made with a fine aggregate with a known low-void content that has performed well in concrete mixtures. The void content of sand is explained in Appendix E. If lacking good comparative thin sections, draw your conclusions by a study of Figures 13-12 through 13-14, which illustrate the appearance of various qualities of fine aggregate in different forms of illumination.
1. The best black and white photomicrography is obtained when
the BG-12 exciter (B engraving) and the DM 500 with the BF .0-515 (B slot position)
are employed. When viewed by the eye, the fluorescence is orange-yellow
and the aggregates are black; in photographs, the contrast is good but some
paste details are lost.
 |
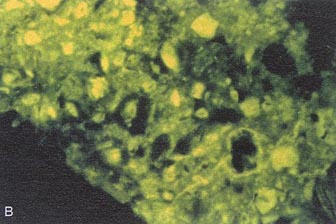 |
Figure 13-11 THIN SECTION OF 25-YEAR-OLD
CONCRETE. The cement grains are completely hydrated. Some cement grain centers
are empty; others contain secondary mineralization. A. Viewed with plane
polarized light. B. Viewed with incident ultraviolet illumination causing
fluorescence of the dye in empty spaces.
 |
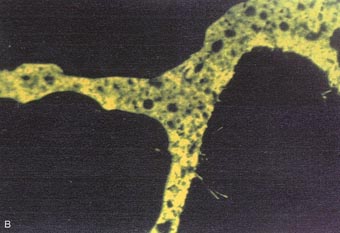 |
Figure 13-12 THIN SECTION OF HCC FABRICATED WITH SMOOTH, ROUNDED SAND. A. Viewed with plane polarized light. B. Same view as A with ultraviolet illumination causing fluorescence in the pore structure impregnated with dye. Notice the even texture of the paste.
 |
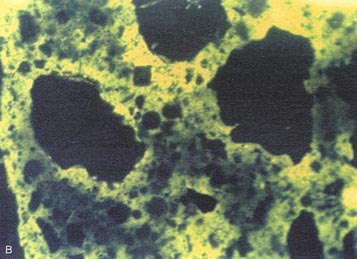 |
Figure 13-13 THIN SECTION OF HCC FABRICATED WITH ANGULAR, DIRTY SAND. There are numerous reentrant angles. A. Viewed with plane polarized light. B. Same view as A with ultraviolet illumination causing fluorescence that delineates the pore structure. Notice the clumping of the cement grains, abundance of pores (shown by the fluorescence) at the edge of the sand, structure of the clay coatings, and general uneven texture of the paste. Such uneven texture indicates zones of weakness through the HCC.
 |
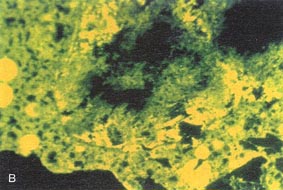 |
Figure 13-14 THIN SECTION OF POROUS, IRON-STAINED PARTICLE OF SAND. A. Viewed with plane polarized light. B. Viewed with incident ultraviolet illumination causing fluorescence of the dye in the pore structure of the sand grain and indicating a zone of water accumulation and weakness.
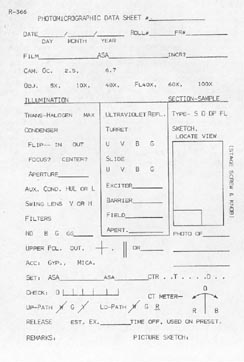
Figure 13-15 PAGE FROM VTRC P/EF PHOTOMICROSCOPY NOTEBOOK
2. Color photomicrography requirements vary with the intensity of fluorescence, but the quality is generally good with the violet settings (BG-3, DM 455, and Y-455) and the addition of Y-485. No transmitted light is used in the photomicrography of fluorescent images.
Completely satisfactory exposures for photomicrography with fluorescence or with crossed nicols have not been obtained. In both cases, it has been necessary to try many different exposure times. When the automatic exposure meter is used, the ability of the equipment to produce the correct exposure seems to depend on whether a bright or a dark object is centered in the view to be photographed. Bracketing the exposure with this light meter is done by setting the light meter for many different ISO numbers and photographing with each.
3. Standardize on a method of keeping track of all photomicrographs taken. Each exposure should have a reference number and be recorded with any data that will aid in improving future exposures. The data recorded should include the source and type of illumination, position of any intensity controls, filters used, amount of opening of all diaphragms (akin to f-stop), film used, and ISO number used to set the exposure meter. If roll film is used, a system of identifying rolls should be devised and this identification recorded with the negatives and on any contact or other archive prints. Figure 13-15 is a page in the P/EF photomicroscopy notebook used at VTRC. The information to be recorded will depend on the nature of the specimen, camera, illumination, and adjustment on the light meter or shutter control.

