U.S. Department of Transportation
Federal Highway Administration
1200 New Jersey Avenue, SE
Washington, DC 20590
202-366-4000
Federal Highway Administration Research and Technology
Coordinating, Developing, and Delivering Highway Transportation Innovations
 |
| This report is an archived publication and may contain dated technical, contact, and link information |
|
Federal Highway Administration > Publications > Research > Structures > Laboratory Evaluation of Waterborne Coatings on Steel |
Publication Number: FHWA-RD-03-032 |
(a)
![Figure 1. Chart a. [FTIR spectrum of (A) styrene modified acrylics, (B) unmodified (vinyl) acrylics using diffuse reflectance sample accessory.] This chart shows the difference of infrared (IR) absorption by styrene modified acrylics and unmodified (vinyl) acrylics. Styrene modified acrylics shows a large IR absorption peak between 3000 and 3300 centimeters to the negative first power and several small peaks above wavenumber of 3000 centimeters to the negative first power, whereas unmodified acrylics only show a large IR absorption peak between 3000 and 3300 centimeters to the negative first power.](images/fig01a.gif)
(b)
![Figure 1. Chart b. [FTIR spectrum of (A) styrene modified acrylics, (B) unmodified (vinyl) acrylics using diffuse reflectance sample accessory.] This chart shows the difference of infrared (IR) absorption by styrene modified acrylics and unmodified (vinyl) acrylics. Styrene modified acrylics shows a large IR absorption peak between 3000 and 3300 centimeters to the negative first power and several small peaks above wavenumber of 3000 centimeters to the negative first power, whereas unmodified acrylics only show a large IR absorption peak between 3000 and 3300 centimeters to the negative first power.](images/fig01b.gif)
Figure 1. FTIR spectrum of (a) styrene modified
acrylics, (b) unmodified (vinyl)
acrylics using diffuse reflectance sample
accessory.
![Figure 2. Bar graph. [Adhesion strength of waterborne primers before test. Conversion factor: 1 mega pascal equals 145 pounds per square inch.] This graph shows the adhesion strength of three different primer types - zinc-rich, acrylic, and epoxy primers. Four zinc-rich primers had similar strength ranging from 8 to 12.5 mega pascals. For acrylic primers, primers 3, 4, and 5 all show strength of 18 mega pascals whereas primer 6 showed 13 mega pascals and primer 7 showed 6 mega pascals.](images/fig02.gif)
Figure 2. Adhesion strength of waterborne primers before test.
Conversion factor: 1 MPa = 145 psi
![Figure 3. Bar graph. [Adhesion strength of waterborne coating systems before test. Conversion factor: 1 mega pascals equals 145 pound per square inch] This graph shows the adhesion strength of three different coating types - zinc-rich, acrylic, and epoxy coating systems. Three of four zinc-rich coatings (systems 1, 2, and 11) showed strength of 12 mega pascals but system 14 shows 6 mega pascals. Acrylics systems 3, 4, and 5 all showed strength of 15 mega pascals but systems 6 and 7 show strength of 6 mega pascals. Epoxy systems 8 and 9 showed strength of 14 and 23 mega pascals respectively, but systems 10 and 13 both showed strength of 18 mega pascals.](images/fig03.gif)
Figure 3. Adhesion strength of waterborne coating systems before test.
Conversion factor: 1 MPa = 145 psi
![Figure 4. Bar graph. [Comparison of topcoat gloss reduction by three test methods.] This graph shows the mean topcoat gloss reduction of waterborne acrylic and epoxy systems after 3,000-hour test A, 3,000-hour test B, and 2-year outdoor exposure. The topcoat gloss of acrylic systems reduced 63 percent after test A and test B, but only reduced 34 percent after the outdoor exposure. The topcoat gloss of epoxy systems reduced 13 percent, 18 percent, and 75 percent after test A, test B, and outdoor exposure respectively.](images/fig04.gif)
Figure 4. Comparison of topcoat gloss reduction by three test methods.
![Figure 5. Bar graph. [Comparison of topcoat color change by three test methods.] This graph shows the topcoat color change of waterborne acrylic and epoxy systems after 3,000-hour test A, 3, 000-hour test B, and 2-year outdoor exposure. The topcoat color difference (E) of acrylic systems was found to be 16, 9.5, and 7.6 before and after the tests. The topcoat color difference of epoxy systems was found to be 15, 11, and 3 percent before and after the tests.](images/fig05.gif)
Figure 5. Comparison of topcoat color change by three test methods.
a.
![Figure 6. a - Panel pictures. [Coating conditions of system 2 after exposures. A. 3,000-hour test A, b. 3,000-hour test B C. 2-year outdoor exposure] This figure shows the coating conditions of system 2 (zinc-rich moisture-cured urethane system) after three tests. No surface failure was observed in all cases. They all exhibited a small amount of creepage at the scribe. However, test B induced a higher amount of scribe creepage than that by test A and outdoor exposure.](images/fig06a.jpg)
b.
![Figure 6. b - Panel pictures. [Coating conditions of system 2 after exposures. A. 3,000-hour test A, b. 3,000-hour test B C. 2-year outdoor exposure] This figure shows the coating conditions of system 2 (zinc-rich moisture-cured urethane system) after three tests. No surface failure was observed in all cases. They all exhibited a small amount of creepage at the scribe. However, test B induced a higher amount of scribe creepage than that by test A and outdoor exposure.](images/fig06b.gif)
c.
![Figure 6. c - Panel pictures. [Coating conditions of system 2 after exposures. A. 3,000-hour test A, b. 3,000-hour test B C. 2-year outdoor exposure] This figure shows the coating conditions of system 2 (zinc-rich moisture-cured urethane system) after three tests. No surface failure was observed in all cases. They all exhibited a small amount of creepage at the scribe. However, test B induced a higher amount of scribe creepage than that by test A and outdoor exposure.](images/fig06c.jpg)
Figure 6. Coating conditions of system 2 after
exposures.
a. 3,000-h test A b.
3,000-h test B c. 2-y outdoor exposure
a.
![Figure 7. a Panel pictures. [Coating conditions of system 1 after exposures. A. 3,000-hour test A B. 3,000-hour test B C. 2-year outdoor exposure] This figure shows the coating conditions of system 1 (zinc-rich epoxy system) after three tests. No surface failure was observed in all cases. The system developed a small amount of creepage at scribe after test A and test B but none after the outdoor exposure.](images/fig07a.jpg)
b.
![Figure 7. b Panel pictures. [Coating conditions of system 1 after exposures. A. 3,000-hour test A B. 3,000-hour test B C. 2-year outdoor exposure] This figure shows the coating conditions of system 1 (zinc-rich epoxy system) after three tests. No surface failure was observed in all cases. The system developed a small amount of creepage at scribe after test A and test B but none after the outdoor exposure.](images/fig07b.jpg)
c.
![Figure 7. c Panel pictures. [Coating conditions of system 1 after exposures. A. 3,000-hour test A B. 3,000-hour test B C. 2-year outdoor exposure] This figure shows the coating conditions of system 1 (zinc-rich epoxy system) after three tests. No surface failure was observed in all cases. The system developed a small amount of creepage at scribe after test A and test B but none after the outdoor exposure.](images/fig07c.jpg)
Figure 7. Coating conditions of system 1 after
exposures.
a. 3,000-h test A b. 3,000-h test B c. 2-y outdoor exposure
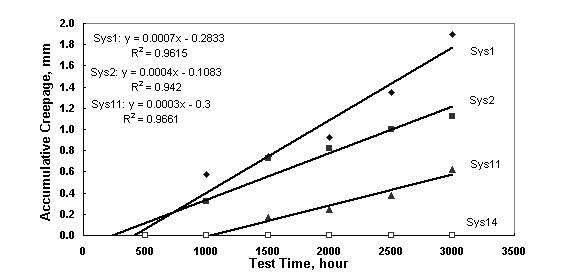
Figure 8. Plot of scribe
creepage of zinc-rich coating systems over
SP 10 surfaces versus
laboratory test time after test A.
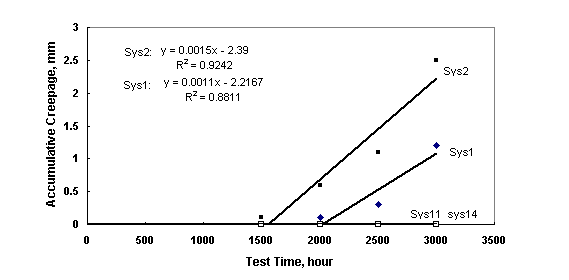
Figure 9. Plot of scribe
creepage of zinc-rich coating systems over
SP 10 surfaces versus
laboratory test time after test B.
![Figure 10. Plot chart. [Plot of scribe creepage of zinc-rich coating systems over SP 10 surfaces versus laboratory test time versus outdoor exposure time.] Only system 2 developed scribe creepage that increased linearly with exposure time. Systems 1, 11, and 14 all showed no creepage at all, therefore the lines superimposed with the X-axis.](images/fig10.gif)
Figure 10. Plot of scribe creepage of zinc-rich coating
systems over
SP 10 surfaces versus
outdoor exposure time.
![Figure 11. Plot chart. [Plot of scribe creepage of acrylic coating systems over SP 10 surfaces versus laboratory test time after test A.] The scribe creepage developed by systems 3, 4, 5, 6 and 7 all increased with test time linearly and the line slope decreased in the order of system 4, system 3, system 6, system 5, and system 7. Systems 3 and 4 showed similar amount of creepage and systems 6, 5, and 7 showed lower amount of creepage that were very similar.](images/fig11.gif)
![Figure 12. Plot chart. [Plot of scribe creepage of acrylic coating systems over SP 10 surfaces versus laboratory test time after test B.] The scribe creepage developed by systems 3, 4, 5, 6 and 7 all increased with test time linearly and the line slope decreased in the order of system 7, system 4, system 3, system 6, and system 5. Actually, systems 3 and 4 showed almost the same amount of scribe creepage at all test times.](images/fig12.gif)
Figure 12. Plot of scribe creepage
of acrylic coating systems over
SP 10 surfaces versus laboratory
test time after test B.
![Figure 13. Plot chart. [Plot of scribe creepage of acrylic coating systems over SP 10 surfaces versus outdoor exposure time.] The scribe creepage developed by systems 3, 4, 5, 6, and 7 all increased with test time linearly starting 0.5 year and the line slope decreased in the order of system 4, system 3, system 7, system 6, and system 5.](images/fig13.gif)
a.
![Figure 14.A Panel pictures. [Coating conditions of system 3 after exposures. A. 3,000-hour test A B. 3,000-hour test B C. 2-year outdoor exposure] This figure shows the coating conditions of system 3 (acrylic system) after three tests. No surface failure was observed in all cases, but the system developed some creepage at the scribe after all the three tests.](images/fig14a.jpg)
b.
![Figure 14.B Panel pictures. [Coating conditions of system 3 after exposures. A. 3,000-hour test A B. 3,000-hour test B C. 2-year outdoor exposure] This figure shows the coating conditions of system 3 (acrylic system) after three tests. No surface failure was observed in all cases, but the system developed some creepage at the scribe after all the three tests.](images/fig14b.jpg)
c.
![Figure 14.C Panel pictures. [Coating conditions of system 3 after exposures. A. 3,000-hour test A B. 3,000-hour test B C. 2-year outdoor exposure] This figure shows the coating conditions of system 3 (acrylic system) after three tests. No surface failure was observed in all cases, but the system developed some creepage at the scribe after all the three tests.](images/fig14c.jpg)
Figure 14. Coating conditions of system 3 after
exposures.
a. 3,000-h test A b. 3,000-h test B c. 2-y outdoor exposure
a.
![Figure 15.A Panel pictures. [Coating conditions of system 5 after exposures. A. 3,000-hour test A B. 3,000-hour test B C. 2-year outdoor exposure] This figure shows the coating conditions of system 5 (acrylic system) after three tests. No surface failure was observed in all cases, but the system developed some creepage at the scribe after all the three tests.](images/fig15a.jpg)
b.
![Figure 15.B Panel pictures. [Coating conditions of system 5 after exposures. A. 3,000-hour test A B. 3,000-hour test B C. 2-year outdoor exposure] This figure shows the coating conditions of system 5 (acrylic system) after three tests. No surface failure was observed in all cases, but the system developed some creepage at the scribe after all the three tests.](images/fig15b.jpg)
c.
![Figure 15.C Panel pictures. [Coating conditions of system 5 after exposures. A. 3,000-hour test A B. 3,000-hour test B C. 2-year outdoor exposure] This figure shows the coating conditions of system 5 (acrylic system) after three tests. No surface failure was observed in all cases, but the system developed some creepage at the scribe after all the three tests.](images/fig15c.jpg)
Figure 15. Coating conditions of system 5 after
exposures.
a.
3,000-h test A b. 3,000-h test B c. 2-y outdoor exposure
a.
![Figure 16.A Panel pictures. [Coating conditions of system 8 after exposures. A. 3,000-hour test A B. 3,000-hour test B C. 2-year outdoor exposure] This figure shows the coating conditions of system 8 (epoxy system) after three tests. No surface failure was observed in all cases, but the system developed some creepage at the scribe after all the three tests.](images/fig16a.jpg)
b.
![Figure 16.B Panel pictures. [Coating conditions of system 8 after exposures. A. 3,000-hour test A B. 3,000-hour test B C. 2-year outdoor exposure] This figure shows the coating conditions of system 8 (epoxy system) after three tests. No surface failure was observed in all cases, but the system developed some creepage at the scribe after all the three tests.](images/fig16b.jpg)
c.
![Figure 16.C Panel pictures. [Coating conditions of system 8 after exposures. A. 3,000-hour test A B. 3,000-hour test B C. 2-year outdoor exposure] This figure shows the coating conditions of system 8 (epoxy system) after three tests. No surface failure was observed in all cases, but the system developed some creepage at the scribe after all the three tests.](images/fig16c.jpg)
Figure 16. Coating conditions of system 8 after
exposures.
a. 3,000-h
test A b. 3,000-h test B c. 2-y outdoor exposure
a.
![Figure 17.A Panel pictures. [Coating conditions of system 10 after exposures. A. 3,000-hour test A B. 3,000-hour test B C. 2-year outdoor exposure] This figure shows the coating conditions of system 10 (epoxy system) after three tests. No surface failure was observed in all cases, but the system developed some creepage at the scribe after all the three tests.](images/fig17a.jpg)
b.
![Figure 17.B Panel pictures. [Coating conditions of system 10 after exposures. A. 3,000-hour test A B. 3,000-hour test B C. 2-year outdoor exposure] This figure shows the coating conditions of system 10 (epoxy system) after three tests. No surface failure was observed in all cases, but the system developed some creepage at the scribe after all the three tests.](images/fig17b.jpg)
c.
![Figure 17.C Panel pictures. [Coating conditions of system 10 after exposures. A. 3,000-hour test A B. 3,000-hour test B C. 2-year outdoor exposure] This figure shows the coating conditions of system 10 (epoxy system) after three tests. No surface failure was observed in all cases, but the system developed some creepage at the scribe after all the three tests.](images/fig17c.jpg)
Figure 17. Coating conditions of system 10 after
exposures.
a.
3,000-h test A b. 3,000-h test B c. 2-y outdoor exposure
![Figure 18. Plot chart. [Plot of scribe creepage of epoxy coating systems over SP 10 surfaces versus laboratory test time after test A.] The scribe creepage developed by systems 8, 9, 10, and 13 all increased with test time linearly and the line slope decreased in the order of system 13, system 9, system 8, and system 10.](images/fig18.gif)
Figure 18. Plot of scribe creepage of epoxy coating systems
over SP 10 surfaces
versus laboratory
test time after test A.
![Figure 19. Plot chart. [Plot of scribe creepage of epoxy coating systems over SP 10 surfaces versus laboratory test time after test B.] The scribe creepage developed by systems 8, 9, 10 and 13 all increased with test time linearly and the line slope decreased in the order of system 13, system 9, system 8, and system 10.](images/fig19.gif)
Figure 19. Plot of scribe creepage
of epoxy coating systems over SP 10
surfaces versus laboratory
test time after test B.
![Figure 20. Plot chart. [Plot of scribe creepage of epoxy coating systems over SP 10 surfaces versus outdoor exposure time.] The scribe creepage developed by systems 8, 9, 10, and 13 all increased with test time linearly starting 0.5 year and the line slope decreased in the order of system 13, system 9, system 8, and system 10. The lines for system 8 and system 10 almost superimposed together, these systems developed much less scribe creepage than that by system 13 and system 9.](images/fig20.gif)
Figure
20. Plot of scribe creepage of epoxy coating systems over
SP 10 surfaces versus
outdoor
exposure time.
a.
![Figure 21.A Panel pictures. [Coating conditions of system 13 after exposures. A. 3,000-hour test A B. 3,000-hour test B C. 2-year outdoor exposure] This figure shows the coating conditions of system 13 (epoxy system) after three tests. No surface failure was observed in all cases, but the system developed a large amount of creepage at the scribe after all the three tests. The coating of creepage areas in figure (A) were removed by a knife, therefore rust surface were exposed.](images/fig21a.jpg)
b.
.
![Figure 21.B Panel pictures. [Coating conditions of system 13 after exposures. A. 3,000-hour test A B. 3,000-hour test B C. 2-year outdoor exposure] This figure shows the coating conditions of system 13 (epoxy system) after three tests. No surface failure was observed in all cases, but the system developed a large amount of creepage at the scribe after all the three tests. The coating of creepage areas in figure (A) were removed by a knife, therefore rust surface were exposed.](images/fig21b.jpg)
c.
![Figure 21.C Panel pictures. [Coating conditions of system 13 after exposures. A. 3,000-hour test A B. 3,000-hour test B C. 2-year outdoor exposure] This figure shows the coating conditions of system 13 (epoxy system) after three tests. No surface failure was observed in all cases, but the system developed a large amount of creepage at the scribe after all the three tests. The coating of creepage areas in figure (A) were removed by a knife, therefore rust surface were exposed.](images/fig21c.jpg)
Figure 21. Coating conditions of system 13 after
exposures.
a.
3,000-h test A b. 3,000-h test B c. 2-y outdoor exposure
![Figure 22. Plot chart. [Plot of scribe creepage of polyurethane coating system (system 12) over SP 10 surfaces versus laboratory test time after test A.] The scribe creepage developed by system 12 increased with test time linearly.](images/fig22.gif)
Figure 22. Plot of scribe
creepage of polyurethane coating system (system 12)
over SP 10 surfaces versus laboratory test
time after test A.
![Figure 23. Plot chart. [Plot of scribe creepage of polyurethane coating system (system 12) over SP 10 surfaces versus laboratory test time after test B.] The scribe creepage developed by system 12 increased with test time linearly.](images/fig23.gif)
Figure 23. Plot of scribe
creepage of polyurethane coating system (system 12)
over
SP 10 surfaces versus laboratory test time after test B.
![Figure 24. Plot chart. [Plot of scribe creepage of polyurethane coating system (system 12) over SP 10 surfaces versus outdoor exposure time] The scribe creepage developed by system 12 increased with test time, but the linearity of the plot is not very good.](images/fig24.gif)
Figure 24. Plot of scribe
creepage of polyurethane coating system (system 12)
over SP 10
surfaces versus outdoor exposure time.
![Figure 25. Bar graph. [Comparison of mean scribe creepage developed by different coating types in three test methods.] This graph shows the mean creepage for zinc-rich, acrylic, and epoxy systems after three tests. The mean scribe creepage of zinc-rich systems was found to be 1.7, 1.0, and 0.5 millimeters after test A, test B, and outdoor exposure respectively. The mean scribe creepage of epoxy systems after test A, test B, and outdoor exposure was found to be 3.5, 4.1, and 4.3 millimeters respectively. The mean scribe creepage of epoxy systems after test A, test B, and outdoor exposure was found to be 3.9, 5.3, and 7.0 millimeters respectively.](images/fig25.gif)
Figure 25.
Comparison of mean scribe creepage developed
by different coating
types in three test methods.

