U.S. Department of Transportation
Federal Highway Administration
1200 New Jersey Avenue, SE
Washington, DC 20590
202-366-4000
Federal Highway Administration Research and Technology
Coordinating, Developing, and Delivering Highway Transportation Innovations
 |
| This report is an archived publication and may contain dated technical, contact, and link information |
|
Federal Highway Administration > Publications > Research > Structures > A Laboratory and Field Study of Composite Piles for Bridge Substructures |
Publication Number: FHWA-HRT-04-043 |
Previous | Table of Contents | Next
The properties of materials used in composite piles can differ significantly from those of conventional pile materials (e.g., steel and concrete), including differences in anisotropy, stiffness, surface hardness, and surface roughness. These differences may produce differences in the behavior of interfaces between the piles and the surrounding soil. Interface behavior plays an important role in the ultimate capacity and load transfer characteristics of the pile, as shown schematically in figure 10. For example, the axial pile capacities of a composite pile and a conventional pile, with identical dimensions and soil conditions, may be quite different due to differences in the developed shaft capacity. To date, most laboratory studies published in this area involve interface shear tests on traditional pile materials. Relatively few studies are available on interface shear behavior between composite pile materials and soils. The principal focus of this chapter is on the soil-pile interface behavior characteristics of composite piles against sand. This chapter summarizes interface shear tests results for seven pile material types (five composite pile materials and two conventional pile materials) against two types of sands. The interface behavior of the different piles is studied within the geotribology framework proposed by Dove and Jarrett (2002).
This chapter is divided into five sections:
Figure 10. Illustration. Influence of soil-pile friction on
pile capacity.
A matrix summarizing the tests carried out for the interface behavior study is provided in table 5.
| Type of Test | Type of Soil | Type of Pile Surface | Comments |
|---|---|---|---|
| Direct shear test | Density sand | Not applicable | Average Dr = 70% |
| Direct shear test | Density sand | Not applicable | Average Dr = 100% |
| Direct shear test | Model sand | Not applicable | Average Dr = 75% |
| Interface shear test | Density sand | Lancaster CP40 | Curved specimen, 24-inch nominal diameter |
| Interface shear test | Model sand | Lancaster CP40 | Curved specimen, 24-inch nominal diameter |
| Interface shear test | Density sand | Hardcore 24-4 | Curved specimen, 24-inch nominal diameter |
| Interface shear test | Model sand | Hardcore 24-4 | Curved specimen, 24-inch nominal diameter |
| Interface shear test | Density sand | Hardcore FRP, no bonded sand | Flat plate, surface untreated with no acrylic coating |
| Interface shear test | Model sand | Hardcore FRP, no bonded sand | Flat plate, surface untreated with no acrylic coating |
| Interface shear test | Density sand | Hardcore FRP, with bonded sand | Flat plate, textured surface with bonded sand |
| Interface shear test | Model sand | Hardcore FRP, with bonded sand | Flat plate, textured surface with bonded sand |
| Interface shear test | Density sand | Plastic Piling recycled plastic | Flat coupons from prismatic rectangular beams |
| Interface shear test | Model sand | Plastic Piling recycled plastic | Flat coupons from prismatic rectangular beams |
| Interface shear test | Density sand | Concrete | Coupon from prestressed concrete pile |
| Interface shear test | Model sand | Concrete | Coupon from prestressed concrete pile |
| Interface shear test | Density sand | Steel | Coupon from sheet pile |
| Interface shear test | Model sand | Steel | Coupon from sheet pile |
1 inch = 25.4 mm.
Two sands were used in this study: Density sand and a Model sand. The Density sand is a fine- to medium-grained, silica sand with subrounded to rounded grains, and the Model sand consists of a blend of Light Castle sand with Bedding sand. The Model sand consists predominantly of fine-grained sand with subangular to angular grains. The Density sand was used in a previous study by Gómez, et al. (2000). The Model sand was prepared to mimic the foundation soils of the pile test site at the Route 351 Bridge.
Index parameter values for both sands used in this study are listed in table 6. Grain size distribution curves for these sands are shown in figure 11. The Density sand has grain sizes ranging from 0.2 to 0.9 mm (0.0078 to 0.035 inches) with no fines. The Model sand has grain sizes ranging from 0.1 to 2 mm (0.0039 to 0.078 inches) with about 5 percent fines. Microscopic views of the sands are shown in figure 12.
| Parameter | Density Sand (1) | Model Sand | ASTM Standard |
|---|---|---|---|
| D10 (mm) | 0.3 | 0.08 | D2487 |
| D50 (mm) | 0.5 | 0.18 | |
| Cu | 1.8 | 2.6 | |
| Cc | 1.1 | 0.8 | |
| 17.5 | 17.0 | D4253 | |
| 15.1 | 14.1 | D4254 | |
| Gs | 2.65 | 2.65 | D854 |
| Note: (1) After Gómez, et al. (2000); 1 mm = 0.039 inches; 1 kN/m3 = 6.36 lbf/ft3. | |||
Figure 11. Graph. Grain size curves to test
sands.
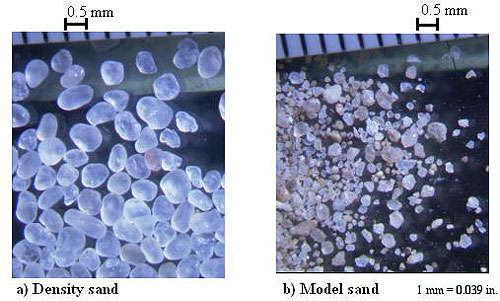
Figure 12. Photos. Microscopic views of the test
sands.
Direct shear tests were performed to determine the internal friction angles of the Density and Model sands. Displacement controlled direct shear tests with a 101.6 mm (4-inch) square shear box were performed. All tests were carried out at a horizontal displacement rate of 0.9 mm/minute (min) (0.036 inch/min). The direct shear tests were performed in accordance with American Society for Testing and Materials (ASTM) Standard D3080-98 (ASTM 1998). Samples were prepared by means of air pluviation and tamping. Dry sand was poured through a 6.5 mm (0.254 inch) funnel positioned at 10 mm (0.39 inch) above the top of the sand surface. Increased density was achieved by means of a small tamping device. To minimize the friction between the sand and the soil box, the inside of the walls was coated with a thin film of vacuum grease.
Direct shear test results, in terms of shear stress versus horizontal displacement curves, are presented in figures 13 through 15 for the medium-dense to dense Density and Model sands, respectively. For the entire range of relative densities and normal pressures tested, all of the direct shear tests exhibited a peak shear stress followed by a stress reduction toward a residual shear stress with a nearly constant volume state. The peak and residual (nearly constant volume state) friction angles obtained from the direct shear tests are summarized in table 7.
|
Parameter |
Density Sand (Average Dr = 70%) |
Density Sand (Average Dr = 10%) |
Model Sand (Average Dr = 75%) |
|---|---|---|---|
|
Peak |
34.7 o |
39.3 o |
43.4 o |
|
Residual |
29.8 o |
29 o |
36.2 o |
Notes: (1) Four normal stresses were used: 25, 50, 100, and 200 kPa (3.63, 7.25, 14.5, and 29 lbf/inch2).
Figure 13. Graphs. Direct shear test results for Density
sand (average Dr = 70 %).
Figure 14. Graphs. Direct shear test results for Density
sand (average Dr = 100 %).
Figure 15. Graphs. Direct shear test results for Model sand
(average Dr = 75%).
In table 7, Dr refers to the sample's relative density, which can be calculated as follows:
 (5)
(5)
where
Both linear and curved-peak shear strength envelopes are shown in figures 13 through 15. The nonlinear shear strength envelopes were obtained using the following expression proposed by Duncan, et al. (1980):
 (6)
(6)
where
The values of ![]() o and
o and ![]()
![]() for both sands are shown in figures 13 through 15.
The shearing area of the soil specimens decreases during direct
shear testing. The direct shear test stress paths, shown in figures
13 through 15 in
for both sands are shown in figures 13 through 15.
The shearing area of the soil specimens decreases during direct
shear testing. The direct shear test stress paths, shown in figures
13 through 15 in ![]() -
-![]() space, have been corrected for this
effect.
space, have been corrected for this
effect.
The interface testing program included determining interface friction angles between the two sands described above and the following seven pile surfaces: Lancaster FRP shell (curved), HardcoreT FRP shell (curved), Hardcore FRP plate without bonded sand (flat), Hardcore FRP plate with bonded sand (flat), Plastic Piling recycled plastic (flat), steel sheet pile (flat), and prestressed concrete (flat). The following subsections describe these pile surfaces within a geotribology framework.
The importance of surface topography, and the degree of surface roughness in interface behavior and soil-structure interaction response, have been noted by many investigators (e.g., Yoshimi and Kishidi 1982, Kishida and Uesugi 1987, Lehane, et al., 1993, Dove, et al., 1997, Han 1997, Dove and Frost 1999, Dove and Jarrett 2002).
The surface roughness of each pile material investigated was measured with a Taylor- Hobson Talysurf stylus profilometer. A schematic of the profilometer used in this study is shown in figure 16. As the figure illustrates, the profilometer comes equipped with a diamond stylus tip that traverses the surface to be characterized. Transducers in the profilometer help record the vertical and horizontal coordinates of the stylus tip. Therefore, the raw surface profile data consists of a series of discrete coordinate pairs
(x, z) that can be postprocessed and analyzed to obtain the surface topography characterization of the material investigated (Dove and Jarrett 2002).
Surface topography was quantified by three commonly used roughness parameters: the maximum peak-to-valley height (Rt), the average mean line spacing (Sm), and the arithmetic average roughness (Ra). Sm is twice the mean distance between locations at which the profiles cross the centerline drawn through the centroid of the profile. Ra is the arithmetic average value of the profile departure from the mean line along the profile length. These three roughness parameters are illustrated in figure 17. More detailed discussion of these parameters is given in International Organization for Standardization (ISO) Standard 4287 (ISO 1997).
Figure 16. Illustration. Stylus profilometer sketch
(Johnson 2000).
Figure 17. Chart. Graphical representation of roughness
parameters Rt, Sm, and
Ra.
Coupons approximately 25 mm (0.975 inch) by 200 mm ( 7.8 inches) were cut from each pile material. A series of six profiles, each 49 mm (1.91 inches) in length, were made on the surface of each coupon. All profiles were made in the longitudinal direction of the piles. Photos of the 7 pile surfaces and corresponding representative surface profiles are shown in figures 18 to 24.
The roughness parameters for the seven interface materials are summarized in table 8. The parameter values reported and subsequently used are averages of the six individual values obtained for each coupon.
Figure 18. Photo and Graph. Surface characteristics of
Lancaster FRP composite pile.
Figure 19. Photo and Graph. Surface characteristics of
Hardcore FRP composite pile.
Figure 20. Photo and Graph. Surface characteristics of
Hardcore FRP plate.
Figure 21. Photo and Graph. Surface characteristics of
Hardcore surface-treated FRP plate.
Figure 22. Photo and Graph. Surface characteristics of
Plastic Piling plastic composite pile.
Figure 23. Photo and Graph. Surface characteristics of
prestressed concrete pile.
Figure 24. Photo and Graph. Surface characteristics of
steel sheet pile.
| Interface Material Type | Roughness Parameters | |||||
|---|---|---|---|---|---|---|
|
Rt ( |
Sm ( |
Ra ( |
||||
|
Average |
S. D. |
Average |
S. D. |
Average |
S. D. |
|
|
LC-CP40 |
93.5 |
29.7 |
7.49 |
1.13 |
16.3 |
3.6 |
|
HC-24-4 |
177.5 |
52.8 |
5.08 |
0.90 |
33.3 |
12.3 |
|
HC untreated FRP plate |
133.8 |
13.0 |
1.55 |
0.57 |
19.9 |
2.7 |
|
HC treated FRP plate |
341.2 |
83.7 |
0.49 |
0.03 |
31.4 |
2.4 |
|
PPI plastic |
365.9 |
73.2 |
1.86 |
0.21 |
43.1 |
9.1 |
|
Concrete |
335.3 |
90.9 |
1.94 |
0.59 |
28.0 |
5.0 |
|
Steel |
66.7 |
3.2 |
0.43 |
0.03 |
5.7 |
0.3 |
Notes: LC = Lancaster Composite, Inc., HC = Hardcore Composites,
PPI = Plastic Pilings, Inc., Rt = maximum peak-to-valley
height, Sm = average mean line spacing, Ra =
arithmetic average roughness, SD = standard deviation; 1 ![]() m = 0.000039 inch; 1 mm = 0.039 mm.
m = 0.000039 inch; 1 mm = 0.039 mm.
The hardness of the interface material is another important factor for consideration when studying interface behavior. As the surface hardness of the construction material decreases, it becomes possible for the soil grains to penetrate the construction material and shear failure may occur if soil grains plow along the material surface (Pando, et al., 2002a). In their study of sand-polymer interfaces, O'Rourke, et al. (1990), found that the interface frictional strength decreased with increasing polymer hardness. The authors found that relatively hard and smooth polymer surfaces did not show significant dilatancy, and the sand grains tended to slide along the polymer interface; whereas the particle movement on relatively soft and smooth polymer surfaces involved predominantly rolling and temporary grain indentations that resulted in higher interface friction values. The findings by O'Rourke, et al. (1990), are mainly applicable to smooth polymeric materials since, as the authors pointed out, surface roughness of rough polymers will promote dilation and result in increased shear resistance.
The surface hardness of the different pile/interface materials was investigated by means of the Vickers hardness test. The Vickers hardness test has the flexibility to allow application of small loads, which is convenient for testing softer materials such as recycled plastic and FRP composites, and consists of pressing a standard diamond pyramid into the sample. The Vickers hardness number (HV) is related to the load applied and the area of the diamond pyramid indentation. Vickers hardness tests were performed in accordance with ASTM Standard E384-99 (ASTM 1999). The results of the hardness tests are summarized in table 9.
|
Interface Material |
Vickers Hardness (HV) |
||
|---|---|---|---|
|
Mean |
SD |
N |
|
|
LC-CP40 |
24.0 |
1.83 |
20 |
|
HC-24-4 |
2.14 |
20 |
|
|
HC untreated FRP flat plate |
35.7 |
10.38 |
20 |
|
HC treated FRP flat plate |
Not measurable (1) |
||
|
PPI plastic |
8.5 |
5.05 |
20 |
|
Concrete |
63.7 |
36 |
36 |
|
Steel |
184.2 |
10.28 |
20 |
Notes: (1): Not measurable because it is difficult to clearly measure the diamond indentation mark due to presence of the bonded sand particles.
HV = Vickers hardness number (ASTM Standard E384-99) (carried out at room temperature).
LC = Lancaster Composite, Inc., HC = Hardcore Composites.
PPI = Plastic Pilings, Inc. SD = standard deviation, n = number of tests performed.
Representative coupons were obtained from each of the seven different pile materials investigated. Careful consideration was given to selecting pile coupons that were representative of the average surface texture of the piles. The coupons from the plastic, concrete, and steel piles, and from the two Hardcore FRP plates, were all flat surfaced. Therefore, it was possible to use a flat shear box for interface shear testing of these materials.
The coupons from the cylindrical FRP shells (i.e., Lancaster CP40 and Hardcore 24-4) were cut with a water-cooled saw to dimensions that fit into the bottom half of the shear box. However, because both composite FRP shells were fabricated with thermoset resins, their curvature could not be removed. To permit testing of these curved-pile specimens, the top half of the shear box was modified such that it could conform to the outside curvature of the piles, as shown in figure 25. The interface shear tests carried out on the other pile materials involved the use of the unmodified top half of the direct shear box. The interface shear tests were performed in accordance with ASTM Standard D5321-97 (ASTM 1997), and the horizontal displacement rate was 0.9 mm/min (0.35 inch/min).
Figure 25. Illustration. Sketch of modified interface shear
test setup.
The interface tests performed using the Density and Model sands are summarized in tables 10 and 11, respectively. Interface shear tests were carried out at constant normal stresses ranging from 23 to 200 kPa (3.3 to 29 lbf/inch2) (the contact area of the soil sample remained constant throughout the test). Typical interface shear stress versus interface displacement curves for the seven pile material types are shown in figures 26 and 27 for the Density and Model sands, respectively. Additional details of the interface tests performed for this investigation are presented in appendix A.
Interface strength envelopes for the seven pile materials and for the Density and Model sands are shown in figures 28 through 34. Curvature of the strength envelopes with increasing normal stresses was generally not significant. The interface friction angles obtained from linear fits to the test data are summarized in table 12.
| Pile/Material | Dr (%) | Sm (mm) | Rt ( |
Hardness (HV) | Sm/D50 | Rt/D50 | dp (mm) | dcv (mm) | |||
|---|---|---|---|---|---|---|---|---|---|---|---|
| Lancaster Composite FRP shell (CP40) |
57.5 |
38.2 |
7.49 |
93.5 |
24 |
14.97 |
0.19 |
14.5 |
0.45 |
12.1 |
14 |
|
64.3 |
63.2 |
7.49 |
93.5 |
24 |
14.97 |
0.19 |
22.8 |
0.35 |
19.2 |
13.5 |
|
|
62.4 |
113.2 |
7.49 |
93.5 |
24 |
14.97 |
0.19 |
40.0 |
0.42 |
33.1 |
8 |
|
|
65.7 |
200 |
7.49 |
93.5 |
24 |
14.97 |
0.19 |
70.2 |
0.60 |
59.6 |
3.4 |
|
|
Hardcore Composites FRP shell (24-4) |
61.4 |
22.5 |
5.08 |
177.5 |
17.7 |
10.16 |
0.36 |
13.1 |
2.14 |
12.8 |
9.6 |
|
66.0 |
50 |
5.08 |
177.5 |
17.7 |
10.16 |
0.36 |
28.7 |
2.27 |
27.3 |
11.5 |
|
|
66.3 |
100 |
5.08 |
177.5 |
17.7 |
10.16 |
0.36 |
57 |
1.77 |
52.9 |
10.3 |
|
|
68.3 |
200 |
5.08 |
177.5 |
17.7 |
10.16 |
0.36 |
111.1 |
1.99 |
102.0 |
13 |
|
|
Hardcore FRP plate; untreated surface |
64.6 |
26.15 |
1.55 |
133.8 |
35.7 |
3.10 |
0.27 |
15.02 |
0.96 |
13.03 |
2.8 |
|
61.5 |
50.06 |
1.55 |
133.8 |
35.7 |
3.10 |
0.27 |
29.81 |
1.17 |
24.73 |
6.7 |
|
|
63.4 |
107.3 |
1.55 |
133.8 |
35.7 |
3.10 |
0.27 |
57.93 |
1.61 |
52.03 |
11.1 |
|
|
66.2 |
199.73 |
1.55 |
133.8 |
35.7 |
3.10 |
0.27 |
107.55 |
1.59 |
95.45 |
10.9 |
|
|
Hardcore FRP plate; treated surface |
62.6 |
26.15 |
0.49 |
341.2 |
See note (1) |
0.98 |
0.68 |
18.48 |
1.22 |
15.54 |
11.0 |
|
64.7 |
50.06 |
0.49 |
341.2 |
See note (1) |
0.98 |
0.68 |
30.97 |
1.91 |
27.29 |
10.7 |
|
|
63.7 |
107.17 |
0.49 |
341.2 |
See note (1) |
0.98 |
0.68 |
63.34 |
1.74 |
55.3 |
10.8 |
|
|
64.9 |
183.5 |
0.49 |
341.2 |
See note (1) |
0.98 |
0.68 |
116.03 |
2.26 |
97.15 |
10.6 |
|
|
PPI plastic |
65.9 |
29.11 |
1.86 |
365.9 |
8.5 |
3.73 |
0.73 |
17.10 |
1.26 |
13.19 |
6.7 |
|
61.1 |
56.77 |
1.86 |
365.9 |
8.5 |
3.73 |
0.73 |
32.63 |
1.28 |
27.96 |
5.3 |
|
|
60.8 |
105.37 |
1.86 |
365.9 |
8.5 |
3.73 |
0.73 |
56.05 |
2.20 |
51.83 |
5.07 |
|
|
61.9 |
180.37 |
1.86 |
365.9 |
8.5 |
3.73 |
0.73 |
93.91 |
1.82 |
81.94 |
6.56 |
|
|
61.1 |
199.72 |
1.86 |
365.9 |
8.5 |
3.73 |
0.73 |
103.39 |
1.66 |
92.67 |
9.45 |
|
|
Prestressed concrete pile |
63.2 |
23.7 |
1.94 |
335.3 |
63.7 |
3.88 |
0.67 |
18.1 |
1.71 |
14.2 |
12.2 |
|
61.9 |
51.5 |
1.94 |
335.3 |
63.7 |
3.88 |
0.67 |
35.4 |
0.93 |
26.3 |
12 |
|
|
63.3 |
101.9 |
1.94 |
335.3 |
63.7 |
3.88 |
0.67 |
68.5 |
1.70 |
50.7 |
10.6 |
|
|
64.0 |
175.4 |
1.94 |
335.3 |
63.7 |
3.88 |
0.67 |
111.5 |
2.55 |
93.7 |
9 |
|
|
Steel from sheet pile |
67.0 |
25.57 |
0.43 |
66.7 |
184.2 |
0.86 |
0.13 |
13.48 |
0.73 |
11.07 |
3.6 |
|
65.9 |
51.27 |
0.43 |
66.7 |
184.2 |
0.86 |
0.13 |
31.38 |
1.10 |
23.61 |
10.7 |
|
|
64.1 |
101.85 |
0.43 |
66.7 |
184.2 |
0.86 |
0.13 |
59.11 |
0.79 |
49.11 |
6.8 |
|
|
65.4 |
202.33 |
0.43 |
66.7 |
184.2 |
0.86 |
0.13 |
105.11 |
1.06 |
94.36 |
8.8 |
Notes: (1) Not measurable because it is difficult to clearly
measure the diamond indentation mark due to presence of the bonded
sand particles.
D50 = 0.5 mm for Density sand, Dr =Relative
density after sample consolidation (as per equation 5), ![]() n= Normal pressure, Sm =
Average mean line spacing,
n= Normal pressure, Sm =
Average mean line spacing,
Rt = Maximum peak-to-valley height, Hardness (HV) =
Average Vickers hardness number,
![]() p= Peak interface shear stress,
dp = Horizontal displacement at peak,
p= Peak interface shear stress,
dp = Horizontal displacement at peak,
![]() cv = Residual interface shear
stress, dCV = Horizontal displacement at residual.
cv = Residual interface shear
stress, dCV = Horizontal displacement at residual.
1 ![]() m = 0.039 inches; 1 m = 0.000039 inch; 1 kPa
= 0.145 poundforce per square inch.
m = 0.039 inches; 1 m = 0.000039 inch; 1 kPa
= 0.145 poundforce per square inch.
| Pile/Material | Dr (%) | Sm (mm) | Rt ( |
Hardness (HV) | Sm/D50 | Rt/D50 | dp (mm) | dcv (mm) | |||
|---|---|---|---|---|---|---|---|---|---|---|---|
| Lancaster Composite FRP shell (CP40) |
57.8 |
22.5 |
7.49 |
93.5 |
24 |
41.59 |
0.52 |
10.3 |
2.48 |
10 |
10.7 |
|
58.7 |
50 |
7.49 |
93.5 |
24 |
41.59 |
0.52 |
27.5 |
8.81 |
27.2 |
10 |
|
|
63.2 |
100 |
7.49 |
93.5 |
24 |
41.59 |
0.52 |
52.3 |
2.11 |
50.2 |
10 |
|
|
64.9 |
200 |
7.49 |
93.5 |
24 |
41.59 |
0.52 |
102.4 |
2.51 |
96.2 |
11 |
|
|
Hardcore Composite FRP shell (24-4) |
56.1 |
22.5 |
5.08 |
177.5 |
17.7 |
28.22 |
0.99 |
14.5 |
0.31 |
14.0 |
10.4 |
|
64.4 |
50 |
5.08 |
177.5 |
17.7 |
28.22 |
0.99 |
28.6 |
12.3 |
28.1 |
10 |
|
|
60.9 |
100 |
5.08 |
177.5 |
17.7 |
28.22 |
0.99 |
56.5 |
9.26 |
55.8 |
10.3 |
|
|
67.9 |
200 |
5.08 |
177.5 |
17.7 |
28.22 |
0.99 |
113.2 |
12.36 |
112.3 |
13 |
|
|
Hardcore FRP plate; untreated surface |
65.4 |
26.15 |
1.55 |
133.8 |
35.7 |
8.61 |
0.74 |
16.44 |
0.98 |
14.24 |
6.4 |
|
59.1 |
50.06 |
1.55 |
133.8 |
35.7 |
8.61 |
0.74 |
33.55 |
1.15 |
27.49 |
11.1 |
|
|
64.7 |
107.17 |
1.55 |
133.8 |
35.7 |
8.61 |
0.74 |
66.38 |
1.71 |
59.20 |
2.6 |
|
|
66.4 |
183.52 |
1.55 |
133.8 |
35.7 |
8.61 |
0.74 |
112.68 |
1.92 |
96.12 |
9.2 |
|
| Hardcore FRP plate; treated surface |
63 |
26.15 |
0.49 |
341.2 |
See note (1) |
2.71 |
1.90 |
23.26 |
0.91 |
16.51 |
5.4 |
|
65 |
50.08 |
0.49 |
341.2 |
See note (1) |
2.71 |
1.90 |
39.00 |
1.61 |
30.17 |
9.5 |
|
|
60.1 |
107.3 |
0.49 |
341.2 |
See note (1) |
2.71 |
1.90 |
80.45 |
1.97 |
69.67 |
10.2 |
|
|
62 |
152.2 |
0.49 |
341.2 |
See note (1) |
2.71 |
1.90 |
115.75 |
2.26 |
97.29 |
9.8 |
|
|
PPI plastic |
64.4 |
26.15 |
1.86 |
365.9 |
8.5 |
10.36 |
2.03 |
14.42 |
0.91 |
10.73 |
11.3 |
|
58.1 |
50.06 |
1.86 |
365.9 |
8.5 |
10.36 |
2.03 |
28.63 |
0.80 |
23.41 |
9.7 |
|
|
65.1 |
107.25 |
1.86 |
365.9 |
8.5 |
10.36 |
2.03 |
74.64 |
1.00 |
57.43 |
5.2 |
|
|
66.4 |
152.2 |
1.86 |
365.9 |
8.5 |
10.36 |
2.03 |
105.69 |
1.47 |
81.98 |
8.2 |
|
|
62.4 |
199.7 |
1.86 |
365.9 |
8.5 |
10.36 |
2.03 |
126.73 |
1.64 |
113.27 |
8.3 |
|
|
Prestressed concrete pile |
58.9 |
23.7 |
1.94 |
335.3 |
63.7 |
10.79 |
1.86 |
19.8 |
1.00 |
11.9 |
11.8 |
|
58.7 |
51.5 |
1.94 |
335.3 |
63.7 |
10.79 |
1.86 |
37.8 |
1.35 |
29.9 |
9.5 |
|
|
61.9 |
101.9 |
1.94 |
335.3 |
63.7 |
10.79 |
1.86 |
72.5 |
1.12 |
55.5 |
9.5 |
|
|
68.2 |
175.4 |
1.94 |
335.3 |
63.7 |
10.79 |
1.86 |
116.7 |
1.42 |
91.7 |
11.7 |
|
|
Steel from sheet pile |
63.5 |
26.08 |
0.43 |
66.7 |
184.2 |
2.39 |
0.37 |
17.42 |
0.46 |
12.00 |
8.7 |
|
62.5 |
51.27 |
0.43 |
66.7 |
184.2 |
2.39 |
0.37 |
31.84 |
0.79 |
27.57 |
3.6 |
|
|
64.3 |
101.85 |
0.43 |
66.7 |
184.2 |
2.39 |
0.37 |
63.33 |
0.97 |
56.69 |
5.4 |
|
|
67.0 |
202.33 |
0.43 |
66.7 |
184.2 |
2.39 |
0.37 |
121.47 |
1.39 |
109.85 |
4.5 |
Notes: (1) Not measurable because it is difficult to clearly
measure the diamond indentation mark due to presence of the bonded
sand particles.
D50 = 0.18 mm for Model sand, Dr= Relative
density after sample consolidation (as per equation 5), ![]() ’n = Normal pressure, Sm = Average
mean line spacing,
’n = Normal pressure, Sm = Average
mean line spacing,
Rt = Maximum peak-to-valley height, Hardness (HV) =
Average Vickers hardness number, ![]() p= Peak interface shear stress,
dp = Horizontal displacement at peak,
p= Peak interface shear stress,
dp = Horizontal displacement at peak,
![]() cv = Residual interface shear
stress, dCV = Horizontal displacement at residual.
cv = Residual interface shear
stress, dCV = Horizontal displacement at residual.
1 mm = 0.039 inches; 1 µm = 0.000039 inch; 1 kPa = 0.145 poundforce
per square inch.
Figure 26. Graphs. Typical interface shear test results for
Density sand (![]() ’n
’n ![]() 100 kPa).
100 kPa).
Figure 27. Graphs. Typical interface shear test results for
Model sand (![]() ’n
’n ![]() 100 kPa).
100 kPa).
Figure 28. Graph. Interface shear strength envelopes for
Lancaster Composite FRP shell.
Figure 29. Graph. Interface shear strength envelopes for
Hardcore Composites FRP shell.
Figure 30. Graph. Interface shear strength envelopes for
untreated Hardcore FRP plate.
Figure 31. Graph. Interface shear strength envelopes for
treated Hardcore FRP plate.
Figure 32. Graph. Interface shear strength envelopes for
PPI plastic.

Figure 33. Graph. Interface shear strength envelopes for
concrete.
Figure 34. Graph. Interface shear strength envelopes for
steel.
| Soil | Pile | Soil properties | Surface Hardness (HV) | Relative Roughness | Interface Angles | |||
|---|---|---|---|---|---|---|---|---|
| Average Dr (%) | D50 (mm) | Rt/D50 | Sm/D50 | |||||
|
Density Sand |
LC FRP |
62.5 |
0.5 |
24 |
0.19 |
14.97 |
19.7 |
16.6 |
|
HC FRP |
65.5 |
17.7 |
0.36 |
10.16 |
29.2 |
27.3 |
||
|
Untreated FRP plate |
63.9 |
35.7 |
0.27 |
3.1 |
28.4 |
25.7 |
||
|
Treated FRP plate |
64.0 |
N/T |
0.68 |
0.98 |
31.9 |
27.8 |
||
|
PPI plastic |
62.2 |
8.5 |
0.73 |
3.73 |
27.6 |
24.9 |
||
|
Concrete |
63.1 |
63.7 |
0.67 |
3.88 |
33.0 |
27.7 |
||
|
Steel |
65.6 |
184.2 |
0.13 |
0.86 |
28.2 |
25.1 |
||
|
Model Sand |
LC FRP |
61.2 |
0.18 |
24 |
0.52 |
41.59 |
27.3 |
26.0 |
|
HC FRP |
62.3 |
17.7 |
0.99 |
28.22 |
29.5 |
29.3 |
||
|
Untreated FRP plate |
63.9 |
35.7 |
0.74 |
8.61 |
31.7 |
28.0 |
||
|
Treated FRP plate |
62.5 |
N/T |
1.9 |
2.71 |
37.3 |
32.6 |
||
|
PPI plastic |
63.3 |
8.5 |
2.03 |
10.36 |
33.4 |
28.8 |
||
|
Concrete |
61.9 |
63.7 |
1.86 |
10.79 |
34.3 |
28.0 |
||
|
Steel |
64.3 |
184.2 |
0.37 |
2.39 |
31.2 |
28.6 |
||
Note: N/T = not testable. 1 mm = 0.039 inch
It has been demonstrated previously that the strength and volume change behaviors of an interface system composed of a granular soil and a construction material are largely controlled by three factors: the relative size of the sand grains with respect to the surface asperity height and spacing, the hardness of the materials, and the soil grain shape (Kishida and Uesugi 1987, O'Rourke, et al., 1990, Irsyam and Hryciw 1991, Hryciw and Irsyam 1993, Dove and Harpring 1999, Dove and Frost 1999, Frost and Han 1999, and Dove and Jarrett 2002). The interface shear test program conducted in this study was not designed to systematically investigate the different factors that influence the interface shear behavior of sands and FRP materials. Nevertheless, the interface friction angle values obtained in this study (shown in table 12), were obtained from interface shear tests having important differences in the following basic variables:
The first two variables are related to soil characteristics, and
the remaining three are related to pile surface characteristics.
All of these variables, except angularity, were measured
quantitatively. Therefore, the influence of the quantitative
variables on the interface friction coefficients (peak and residual
tan ![]() ) can be investigated by performing
multiple linear regressions. Linear regression analyses for both
sand types and for peak and residual interface friction
coefficients are presented in the following subsections. The
regressions were carried out with the interface friction
coefficient as the dependent variable, and
Rt/D50, Sm/D50, and HV
as independent variables. Due to small sample size (N = 7),
statistically significant results (at the 5 percent level) were not
expected.
) can be investigated by performing
multiple linear regressions. Linear regression analyses for both
sand types and for peak and residual interface friction
coefficients are presented in the following subsections. The
regressions were carried out with the interface friction
coefficient as the dependent variable, and
Rt/D50, Sm/D50, and HV
as independent variables. Due to small sample size (N = 7),
statistically significant results (at the 5 percent level) were not
expected.
The linear regression analysis results for both sand types and for peak and residual interface friction coefficients are presented in sections 3.5.1 through 3.5.4. The general discussion of the regression results is provided in section 3.5.5.
Results of the regression analysis for the tan ![]() peak values from tests using the
Density sand are summarized in table 13.
peak values from tests using the
Density sand are summarized in table 13.
|
Regression Equation |
|
|---|---|
|
R2 (N=7) |
0.662 |
|
R2 change due to Rt/D50 |
0.355 |
|
R2 change due to Sm/D50 |
0.302 |
|
R2 change due to HV |
0.005 |
The coefficient of determination (R2) for this fit
was 0.66, shown graphically in figure 35. The contributions of
Rt/D50, Sm/D50, and HV
to R2 were 53.6 percent, 45.6 percent, and 0.8 percent,
respectively. This indicates that hardness (HV) is the least
significant predictor of the tan ![]() peak values compared to
Rt/D50 and Sm/D50.
peak values compared to
Rt/D50 and Sm/D50.

Figure 35. Graph. Multiple linear regression on Density
sand tan ![]() peak
values.
peak
values.
Results of the regression analysis for the tan ![]() cv values from tests using the
Density sand are summarized in table 14.
cv values from tests using the
Density sand are summarized in table 14.
|
Regression Equation |
|
|---|---|
|
R2 (N=7) |
0.581 |
|
R2 change due to Rt/D50 |
0.264 |
|
R2 change due to Sm/D50 |
0.313 |
|
R2 change due to HV |
0.004 |
The coefficient of determination (R2) for this fit
was 0.58, and is shown graphically in figure 36. The contributions
of Rt/D50, Sm/D50, and
HV to R2 were 45.4 percent, 53.9 percent, and 0.7
percent, respectively. As in the previous analyses, this indicates
that the hardness (HV) has considerably less influence on the tan
![]() cv values than
Rt/D50 and Sm/D50.
cv values than
Rt/D50 and Sm/D50.
Figure 36. Graph. Multiple linear regression on Density
sand tan ![]() dcv
values.
dcv
values.
Results of the regression analysis for the tan ![]() peak values from tests using the
Model sand are summarized in table 15.
peak values from tests using the
Model sand are summarized in table 15.
|
Regression equation: |
|
|---|---|
|
R2 (N=7) |
0.892 |
|
R2 change due to Rt/D50 |
0.612 |
|
R2 change due to Sm/D50 |
0.279 |
|
R2 change due to HV |
0.001 |
The coefficient of determination (R2) for this fit
was 0.89, and is shown graphically in figure 37. The contributions
of Rt/D50, Sm/D50, and
HV to R2 were 68.6 percent, 31.3 percent, and 0.1
percent, respectively. As in the previous analysis, this indicates
that hardness (HV) has considerably less influence on the tan
![]() peak values than
Rt/D50 and Sm/D50.
peak values than
Rt/D50 and Sm/D50.

Figure 37. Graph. Multiple linear regression on Model sand
tan ![]() peak values.
peak values.
Results of the regression analysis for the tan ![]() cv values from tests using the
Model sand are summarized in table 16.
cv values from tests using the
Model sand are summarized in table 16.
|
Regression equation |
|
|---|---|
|
R2 (N=7) |
0.474 |
|
R2 change due to Rt/D50 |
0.275 |
|
R2 change due to Sm/D50 |
0.179 |
|
R2 change due to HV |
0.020 |
The coefficient of determination (R2) for this fit
was 0.47, and is shown graphically in figure 38. The contributions
of Rt/D50, Sm/D50, and
HV to R2 were 58 percent, 37.8 percent, and 4.2 percent,
respectively. As in the previous analysis, this indicates that
hardness (HV) has considerably less influence on the tan ![]() cv values than
Rt/D50 and Sm/D50.
cv values than
Rt/D50 and Sm/D50.
Figure 38. Graph. Multiple linear regression on Model sand
tan ![]() cv values.
cv values.
Based on the four linear regression analyses presented above, the following observations and comments are made.
The regression analyses presented in the preceding sections did not include the influence of soil angularity. As explained earlier, this was because the angularity of the sands used in this study was only described qualitatively. The sand angularity for the Density sand was described as subrounded to rounded, and for the Model sand as subangular to angular. In general, angular sands have values of higher interface friction angle than rounded sands (Han and Frost 1999). This is consistent with results for the Model and Density sands, as listed in table 12. Due to the higher contact stresses at sharp grain edges, angular soil grains are able to penetrate into the surfaces of some of the pile materials. For this reason, and because angular particles may interlock better with the pile surface roughness, interface friction angles tend to be larger for angular soil grains than for rounded grains.
The following laboratory activities were performed for this investigation:
Interface shear tests were performed on 14 types of soil-pile interfaces. Tests were carried out for two types of sands: Density sand (D50 = 0.5 mm (0.019 inch), subrounded to rounded particle shape) and Model sand (D50 = 0.18 mm (0.007 inch), subangular to angular particle shape). Seven pile surfaces were tested: Lancaster FRP composite (curved), Hardcore FRP composite (curved), Hardcore FRP composite plate (flat), Hardcore FRP composite plate with bonded sand treatment (flat), PPI recycled plastic coupon (flat), prestressed concrete pile coupon (flat), and a steel sheet pile coupon (flat). The results of these tests are summarized in appendix A.
The peak and residual interface friction angles for the 14 sand-to-pile interfaces tested are summarized in tables 10 through 12. The following points and observations can be made regarding the experimental data.

