U.S. Department of Transportation
Federal Highway Administration
1200 New Jersey Avenue, SE
Washington, DC 20590
202-366-4000
Federal Highway Administration Research and Technology
Coordinating, Developing, and Delivering Highway Transportation Innovations
 |
| This report is an archived publication and may contain dated technical, contact, and link information |
|
Federal Highway Administration > Publications > Research > Structures > A Laboratory and Field Study of Composite Piles for Bridge Substructures |
Publication Number: FHWA-HRT-04-043 |
Previous | Table of Contents | Next
An important reason that composite piles have not gained wide acceptance in civil engineering practice is the lack of a long-term track record of performance. To help fill this void, a long-term monitoring program was implemented at the Route 351 Bridge project. The initial plan was to compare the performance of three adjacent bridge piers, each supported by different pile types. Coordination and logistical difficulties, however, prevented implementation of the initial plan. Consequently, the original long-term monitoring program was reduced to monitoring two instrumented piles installed at the center of two adjacent piers.
The instrumented production piles will be monitored for several years. This reduced program is not ideal, particularly because the bent where the FRP composite pile is located will have two types of piles, each with a different stiffness, and this may affect load distribution among the piles in the pier. In addition, the pile arrangements in the two piers are not the same. The pier with the FRP pile has five central piles installed vertically, and the two outer piles are installed with 4-to-1 batter in the direction perpendicular to the bridge axis. The pier with the instrumented prestressed concrete pile has three central piles installed vertically, and the two outer piles on each end of the pier are installed at 4-to-1 batter oriented in the direction of the bridge axis. Despite these shortcomings, this monitoring program is expected to provide some insight on the long- term durability and performance of the FRP composite pile. This chapter describes the instrumented production piles; the instrumentation used; the soil conditions at the locations of the instrumented piles; the installation information including driving records, PDA, CAPWAP, and PIT tests; and the monitoring data gathered to date.
Long-term instrumentation was installed in a Hardcore FRP composite pile and a prestressed concrete pile, and the piles were installed as the center piles of Piers 11 and 10, respectively. Figure 205 shows the locations of the instrumented production piles.
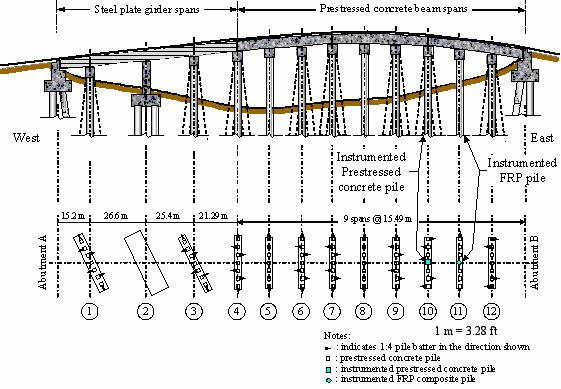
Figure 205. Illustration. Location of instrumented
production piles at the Route 351 Bridge.
The instrumented prestressed concrete production pile has characteristics similar to the test pile described in chapter 6. However, the production pile is longer, with a length of 22 m (72.2 ft). The 28-day strength of the concrete used in this pile is 61 MPa (8,845 lbf/inch2).
The prestressed concrete pile was instrumented with eighteen vibrating-wire sister bar strain gages located at seven levels, as shown in figure 206. These gages will be used to assess the load transfer from pile to soil.
As shown in figure 206, a pair of gages was located at each level to provide gages on opposite sides of the pile. Two extra gages were installed at the uppermost and lowermost levels for redundancy. The gages are Geokon Model 4911 rebar strain meter gages. These gages consist of two lengths of No. 12M, grade 420 steel bar (No. 4 steel bar, grade 60) welded onto each end of a miniature vibrating-wire strain gage element. The entire assemblage is 1.3 m (4.3 ft) long. The instrumentation for the prestressed concrete production pile was installed on November 6, 2001. The pile was cast on November 7, 2001. The vibrating-wire sister bar strain gage survival rate, after pile manufacturing, driving, and restrike, was 100 percent.
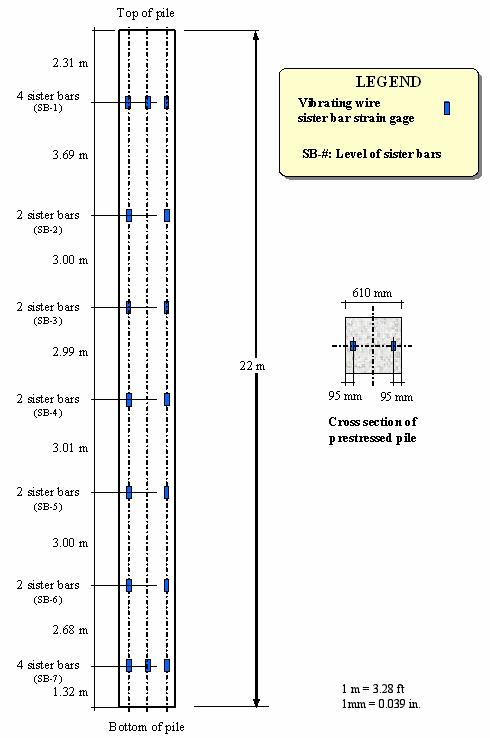
Figure 206. Illustration. Load transfer instrumentation
layout for prestressed concrete production pile.
The instrumented FRP composite production pile has the same characteristics as the FRP composite test pile described in chapter 6, but the length of this pile is 21.2 m (69.6 ft). Similar to the prestressed concrete pile, the FRP composite production pile was instrumented with 18 vibrating-wire sister bar strain gages located at 7 levels, as shown in figure 207. These gages will be used to assess the load transfer from pile to soil.
The FRP pile was also instrumented with gages installed to study the performance and durability of the FRP tube. The following durability instrumentation was installed to monitor strains in the FRP tube:
Four vibrating-wire strain gages were installed on the outside surface of the FRP pile at the locations shown in figure 208. These gages are Geokon Model VK4100 vibrating-wire strain gages. These gages have a 50 mm- (2 inch-) gage length. The gages were installed by epoxy bonding their mounting tabs to the pile exterior. In addition to providing strain data, these gages can measure temperature since they come with a thermistor incorporated.
The vibrating-wire sister bars and the internal foil resistance strain gages for the FRP composite production pile were installed between January 24 and February 1, 2002. The concrete was poured for this pile on February 6, 2002. The vibrating-wire sister bar strain gage survival rate, after pile manufacturing, driving, and restrike, was 100 percent. The survival rate of the internal foil gages was 30 percent. The majority of the internal foil gages started to drift after the concrete was poured. This could be due to moisture from the concrete. The external vibrating-wire strain gages were installed after pile installation on November 7, 2002. As of December 30, 2002, all external gages were functioning.
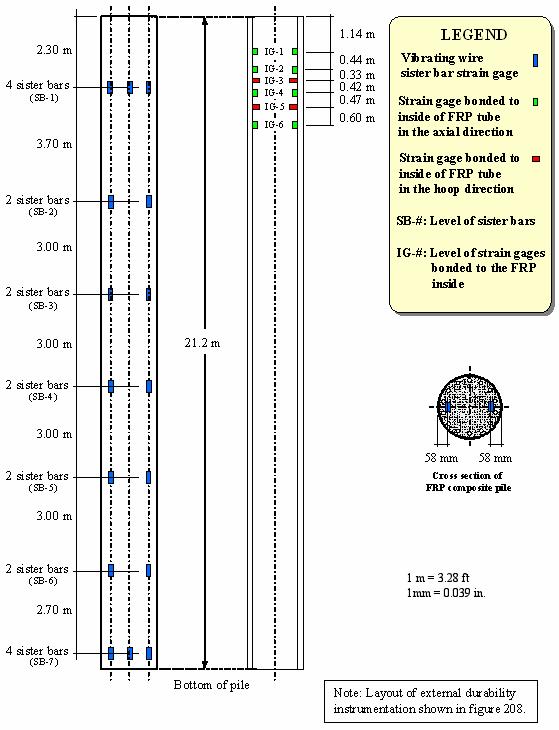
Figure 207. Illustration. Instrumentation layout for FRP
composite production pile.
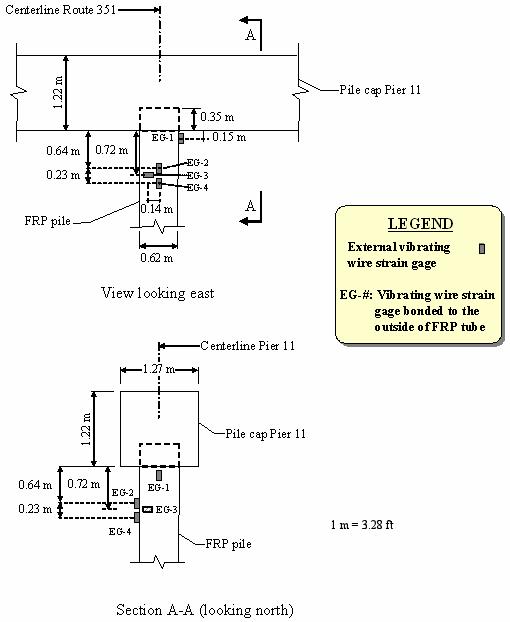
Figure 208. Illustration. Layout of external durability
instrumentation used in the FRP composite production
pile.
VDOT investigated the soil conditions along the bridge alignment. The general soil stratigraphy found along the Route 351 Bridge alignment is shown in figure 209. The uppermost layer of river sediments consists of very soft to soft silty clay of varying thicknesses. The soft river sediments are underlain by loose to medium-dense, silty fine sand extending to variable depths depending on the location along the alignment. In general, the silty fine sand was found to increase in density with increasing depth, becoming dense to very dense at a depth of about 30 m (98.4 ft).
The specific soil conditions found at Piers 10 and 11 are shown in figures 210 and 211, respectively. As shown, a sandy, silty, clay interbed was found at Piers 10 and 11, between elevations -18.7 and -20 m (61.3 and 65.6 ft), and -11.6 to -20 m (38.0 and 65.6 ft), respectively. For reference, the elevations of the installed piles are also shown in these figures.
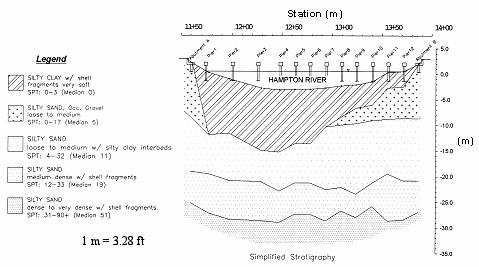
Figure 209. Graph. Simplified stratigraphy along the Route
351 Bridge alignment.
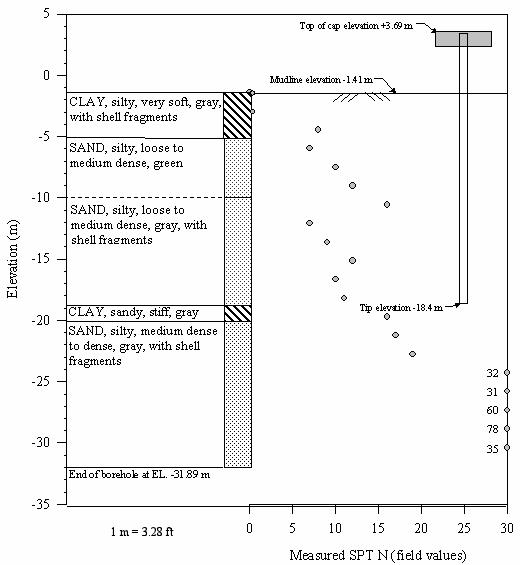
Figure 210. Graph. Simplified stratigraphy in the vicinity
of the instrumented prestressed concrete pile installed at Pier
10.
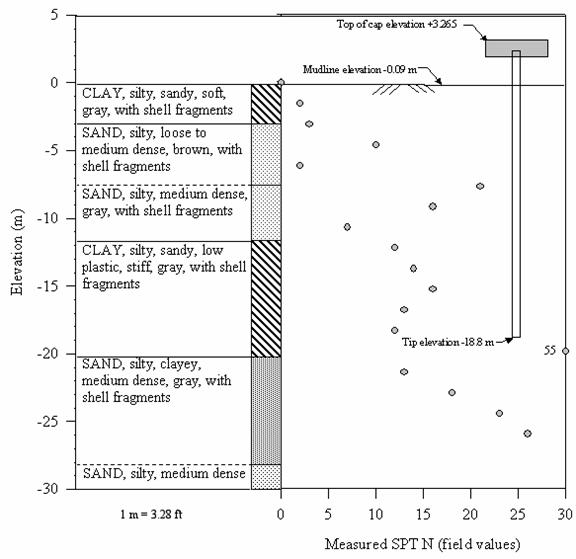
Figure 211. Graph. Simplified stratigraphy in the vicinity
of the instrumented FRP composite pile installed at Pier
11.
The instrumented production piles were driven with an ICE model 80S single-acting diesel hammer. The maximum rated energy of the hammer is 108.6 kN-m (80,000 ft-lbs). Both instrumented production piles were driven with 230 mm- (9 inch-) thick plywood pile cushions. The pile-driving records are shown in figure 212. The prestressed concrete pile and FRP pile were driven on June 13 and June 14, 2002, respectively.
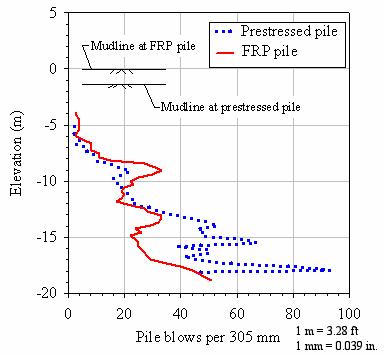
Figure 212. Graph. Driving records for instrumented
production piles.
Dynamic monitoring was performed using a Pile Driving Analyzer (PDA). The PDA monitoring and data processing were performed by an FHWA contractor. Monitoring was performed during both the initial driving and during restrike. Restrike occurred on June 18, 2002, which represents a setup period of 4 and 5 days after initial driving for the FRP composite pile and prestressed concrete pile, respectively. PDA records for the two instrumented production piles at restrike are shown in figure 213. The PDA records show a force peak at about time 0, measured with respect to the horizontal bars in figure 213 that represent the wave travel time for two pile lengths for each pile. The prestressed concrete and FRP composite piles show similar dynamic behavior. Both piles show a large increase in the velocity record and corresponding low force at about 2L/c (where L is pile length, and c is wave speed). This type of PDA record shape is characteristic of piles with a small toe resistance. Very little separation between the force and velocity traces appears between time 0 and about 0.5L/c. This corresponds to the zone of zero to minimal shaft resistance; that is, the portion of the pile above the ground surface and the portion through the very soft river sediments where shaft resistance is small.
Table 47 provides some of the measurements obtained during pile driving. It can be seen that the wave speed (c) and impedance values (EA/c) recorded in the FRP composite pile were about 5.3 percent and 6.1 percent lower, respectively, than the prestressed pile. The maximum compressive and tensile stresses in the prestressed concrete pile were lower than the allowable stresses recommended for prestressed piles (Hannigan, et al., 1996). The highest driving stresses were recorded in the FRP composite pile; however, no standards are currently available for allowable driving stresses of FRP composite piles.
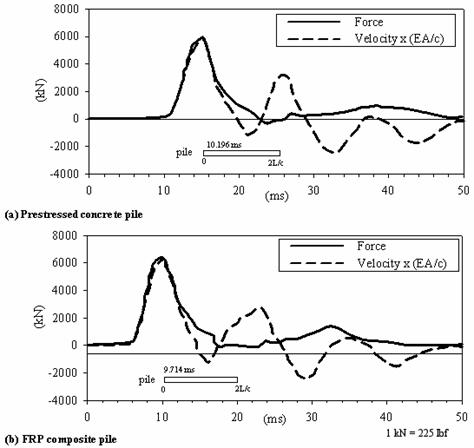
Figure 213. Graph. PDA recordings during restrike (Spiro
and Pais 2002b).
|
Measurement |
Pile Type |
|
|---|---|---|
|
Prestressed |
FRP |
|
|
Wave speed (c) |
4054 m/s |
3840 m/s |
|
Impedance (EA/c) |
3589 kN/m/s |
3370 kN/m/s |
|
Maximum compression stress measured during driving |
11.7 MPa |
13 MPa |
|
Maximum tensile stress measured during driving |
7 MPa |
8.8 MPa |
|
Allowable stresses |
Comp. < 24.3 MPa Tension < 7 MPa |
No standards available |
| 1 m = 3.28 ft 1 kN/m = 68.6 lbf/ft 1 MPa = 145 lbf/inch2 |
||
Estimates of pile capacity from the dynamic strain and acceleration measurements were obtained using the Case method and CAPWAP analyses (Spiro and Pais 2002b). Both the Case method and CAPWAP capacities are listed in table 48. The FRP composite production pile showed an increase in the Case method capacity of about 125 percent between the end of initial driving and restrike 4 days later. According to the CAPWAP analyses, the prestressed concrete and FRP composite piles have capacities of 1,980 and 2,046 kN (445 and 460 kips), respectively. These CAPWAP capacities are over two times larger than the axial design load of 890 kN (200 kips) for the piles in the piers. The CAPWAP analyses also indicate that the shaft capacities, as percentages of the total capacities, are 82 percent and 71 percent for the prestressed concrete and FRP piles, respectively. These high shaft capacity percentage values agree with the observations made earlier regarding the shape of the PDA records being characteristic of piles with low toe resistance.
|
Method |
Capacity Component |
Prestressed Concrete Pile |
FRP Pile |
|---|---|---|---|
|
Case (1) (End-of-Driving) |
Total |
Not available (2) |
890 kN |
|
Case (1) (Restrike (3)) |
Total |
2091 kN |
2002 kN |
|
CAPWAP (Restrike (3)) |
Shaft |
1624 kN |
1459 kN |
|
Toe |
356 kN |
587 kN |
|
|
Total |
1980 kN |
2046 kN |
|
| Notes: (1) Case method using a Case
damping coefficient of 0.60. 1 kN = 225 lbf, or 0.225 kip (2) Not available due to signal acquisition problems. (3) Restrike of piles performed 4 and 5 days after initial driving, for the FRP and prestressed concrete piles. |
|||
Pile integrity tests (PIT) were performed on the instrumented production piles before and after pile installation. These tests were carried out using the same procedure used for the test piles described in chapter 6.
PIT results for the prestressed concrete production pile installed at Pier 10, performed before and after pile driving, are shown in figures 214 and 215, respectively. No discernable damage was noted based on comparison of the pre- and postdriving PIT soundings. The soil resistance in the pile after installation results in a smaller toe reflection, as shown in figure 215.
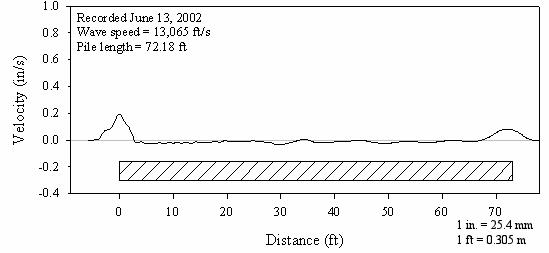
Figure 214. Graph. PIT sounding on the prestressed concrete
production pile before installation.
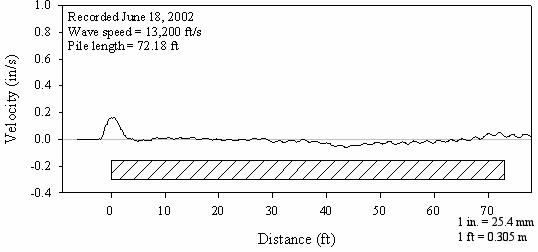
Figure 215. Graph. PIT sounding on the prestressed concrete
production pile after installation and restrike.
PIT results for the FRP composite pile installed at Pier 11 are shown in figures 216 and 217. No significant difference between the pre- and postdrive PIT traces was observed for the FRP pile. Toe reflection in the postdrive PIT is almost not discernible, probably due to high soil resistance. No discernable damage could be detected based on comparison of the pre- and postdriving PIT soundings.
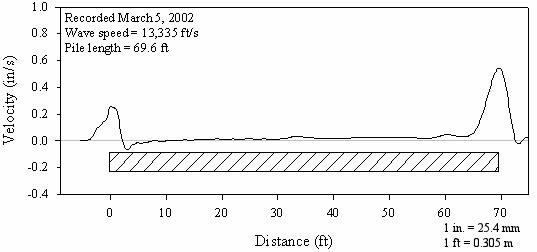
Figure 216. Graph. PIT sounding on the FRP composite
production pile before installation.
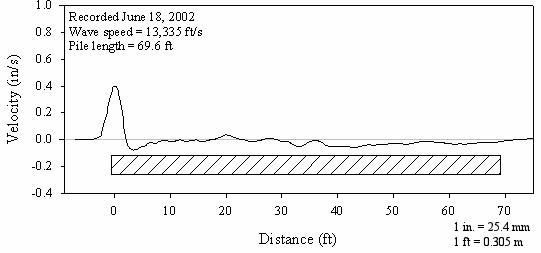
Figure 217. Graph. PIT sounding on the FRP composite
production pile before installation.
Important date information for these two piles is summarized in table 49.
|
Pile Type |
Cross Section |
Length (m) |
Fabrication Date |
Driving Date |
Restrike Date |
|---|---|---|---|---|---|
|
Prestressed concrete |
610 mm square |
22 |
11/7/01 |
6/13/02 |
6/18/02 |
|
FRP |
622 mm circular |
21.2 |
2/6/02 |
6/14/02 |
6/18/02 |
| 1 mm = 0.039 inch 1 m = 3.28 ft |
|||||
Due to delays in the construction schedule of the bridge, only a few readings have been made on the instrumented production piles. The instrumentation for the prestressed and FRP composite piles have been read on the dates shown in tables 50 and 51, respectively. On December 30, 2002, the estimated loads acting on the prestressed concrete and FRP composite piles were 24.1 percent and 30.9 percent of the axial design load, respectively.
|
Date |
Description of Pile Loading Condition |
Estimated Load on Pile |
|---|---|---|
|
6/18/02 |
After pile installation and restrike |
0 kN |
|
11/7/02 |
Pile cap and girders from east span installed |
110 kN |
|
12/30/02 |
Pile cap and girders from adjacent spans installed. Deck slab for east span in place |
227 kN |
| 1 kN = 225 lbf | ||
|
Date |
Description of Pile Loading Condition |
Estimated Load on Pile |
|---|---|---|
|
6/18/02 |
After pile installation and restrike |
0 kN |
|
11/7/02 |
Pile cap and girders from east and west spans installed |
155 kN |
|
12/30/02 |
Pile cap, girders, and deck slab from adjacent spans in place |
290 kN |
| 1 kN = 225 lbf | ||
The loads acting on each pile were estimated based on the information reported in the bridge design drawings. The weight of the pile cap is based on unit weight for the reinforced concrete of 23.6 kN/m3 (150 lbf/ft3) and the pile cap dimensions of 1.22 by 1.27 by 12.5 m (4.00 by 4.17 by 41.0 ft). The load from the AASHTO Type II girders (7 girders per each span) is calculated based on a span length of 15.5 m (50.8 ft) and a girder weight per unit length of about 5.6 kN/m (384 lbf/ft) (Nilson 1987). The load due to the reinforced concrete bridge deck is based on a slab thickness of 0.2 m (0.656 ft) and a deck width of 12.8 m (42.0 ft). As a first approximation, the loads acting on the pile were estimated by dividing the total pier load by the number of piles in the pier.
A photo of the bridge taken on December 30, 2002, is shown in figure 218. This photo shows that Piers 7 through 12 have been installed and the bridge deck has been poured up to Pier 10. The photo also shows the formwork for the deck between Piers 9 and 10.
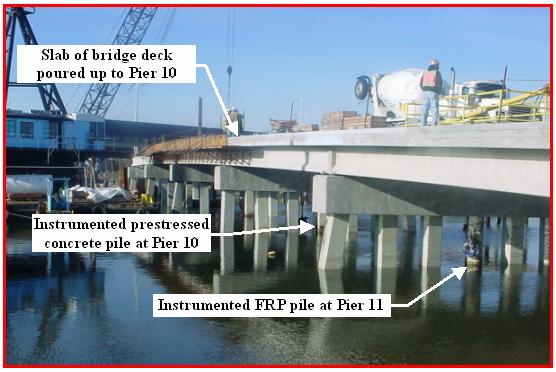
Figure 218. Photo. Route 351 Bridge under construction on
December 30, 2002.
The load distributions estimated for the prestressed concrete and FRP composite piles are shown in figures 219 and 220, respectively. These load distributions were estimated by multiplying the average strain at each level of vibrating-wire sister bars by the values of axial stiffness (EA) of each pile (as reported in chapter 6). The load distributions were calculated considering the residual stresses after driving using the procedure described by Fellenius (2002).
Long-term monitoring and data collection responsibility are being transferred to VDOT and the Virginia Transportation Research Council (VTRC).
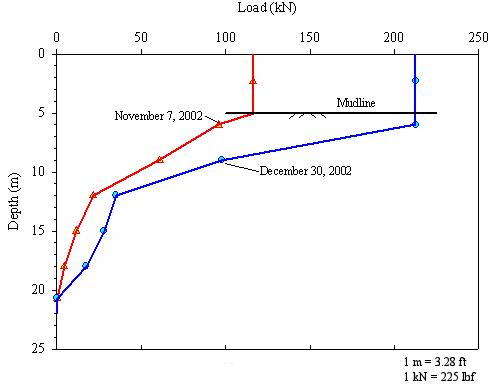
Figure 219. Graph. Load distributions on November 7, 2002,
and December 30, 2002, for the prestressed concrete production pile
at Pier 10.
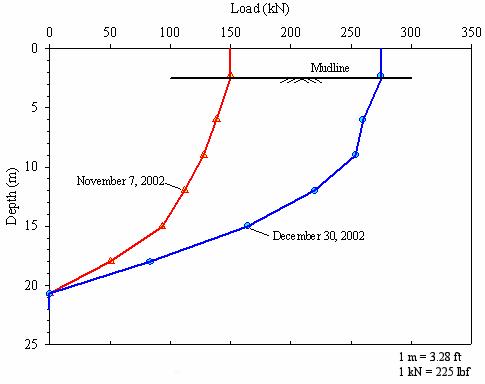
Figure 220. Graph. Load distributions on November 7, 2002,
and December 30, 2002, for the FRP composite production pile at
Pier 11.
A monitoring program has been implemented at the Route 351 Bridge project to compare the long-term performance, load-transfer, and durability characteristics of an FRP composite pile and a standard prestressed concrete pile. The two production piles selected for monitoring were installed at the centers of Piers 10 and 11. The piles consist of (1) a conventional, 610-mm (23.8-inch) square, prestressed concrete pile installed at Pier 10, and (2) a 622-mm (24.3-inch) diameter composite pile formed of an FRP shell and filled with concrete and steel reinforcing bars installed at Pier 11. The instrumented production piles are about 22 m (72 ft) long.
Load-transfer instrumentation, consisting of 18 vibrating-wire sister bars, was installed at 7 levels in both piles. Durability instrumentation, consisting of resistance foil gages and vibrating-wire gages, was installed on the FRP composite pile to monitor the inside and outside of the FRP tube, respectively.
The soils at the production pile locations were investigated by VDOT, and consisted of very soft to soft silty clay underlain by loose to medium-dense silty sand. A sandy, silty, clay interbed was found at Pier 10 between elevations -18.7 and -20 m (61.3 and 65.6 ft), and at Pier 11 between elevations -11.6 to -20 m (38.0 and 65.6 ft).
The field testing of the instrumented production piles included PDA, CAPWAP, and PIT tests. The following conclusions can be drawn from this test program.
Durability instrumentation was installed on the FRP composite pile to monitor the inside and outside strains of the FRP tube. The durability instrumentation had to be installed after the construction activities near Pier 11 were completed. In addition to providing the strain data for the FRP shells, the durability strain gages will also provide records of temperature because vibrating-wire strain gages incorporate thermocouples to provide information necessary for reducing the strain gage data. The strain and temperature data will be used to interpret the performance of the FRP shells, as follows: knowledge of the exposure time and temperature can be used to estimate the FRP properties of modulus and strength from the laboratory durability study described in chapter 4; knowledge of the strain in the production piles can be combined with the modulus to give the stress in the FRP shell; and comparing the stress with the strength of the FRP shell indicates how close the shell is to failure.

