U.S. Department of Transportation
Federal Highway Administration
1200 New Jersey Avenue, SE
Washington, DC 20590
202-366-4000
Federal Highway Administration Research and Technology
Coordinating, Developing, and Delivering Highway Transportation Innovations
 |
| This report is an archived publication and may contain dated technical, contact, and link information |
|
Federal Highway Administration > Publications > Research > Structures > Long-Term Performance of Epoxy-Coated Reinforcing Steel in Heavy Salt-Contaminated Concrete |
Publication Number: FHWA-HRT-04-090 |
Previous | Table of Contents | Next
Tables 6 through 8 summarize the last electrochemical test data, grouped by type of test slab, that were collected in December 2002 just before the autopsy of the slabs. The data include SCP, OCP, macrocell current, AC resistance, and impedance modulus at 0.1 Hz. Figures 5 through 16 summarize the changes of mean SCP and mean macrocell current density with time for the slabs having different configurations. The elapsed time in the figures was calculated from the day when the slabs were placed in the outdoor test yard. It was noted that when test slabs had suffered from corrosion-induced physical damage, the data listed in tables 6, 7, and 8 did not represent actual condition of the reinforcing bars in those slabs.
Test slabs containing black bars in both mats
Each of the black bar test samples had cracking and delamination
of the concrete cover after 96-week SE testing and before placing
the slabs outdoors. Therefore, the SCP and microcell currents
measured after cracking are not indicative of the true difference
in performance, because the corrosion rate and potentials (SCP)
drop after cracking and delamination of the concrete cover occurs.
The straight, non-bent black bars had an average corrosion current
density of about 2.4 ![]() A/cm2 (15.5
A/cm2 (15.5
![]() A/in.2) during the 96-week SE
testing. Upon outdoor exposure, the black bar samples averaged
somewhat less than 1.5
A/in.2) during the 96-week SE
testing. Upon outdoor exposure, the black bar samples averaged
somewhat less than 1.5 ![]() A/cm2 (9.7
A/cm2 (9.7
![]() A/in.2). This same effect may be
present for some of the other poorly performing ECR samples with
large damaged areas, precracks, and bending damage.
A/in.2). This same effect may be
present for some of the other poorly performing ECR samples with
large damaged areas, precracks, and bending damage.
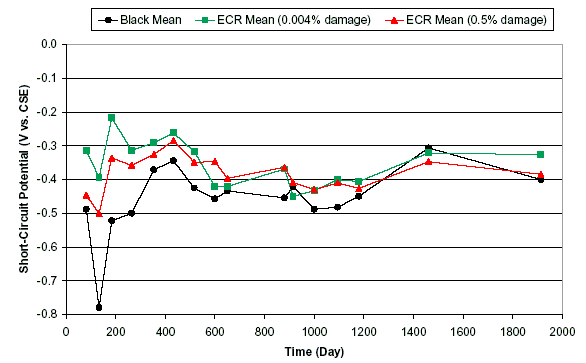
Test slabs containing ECRs in the top mat and black bars in the bottom mat
Test slabs containing ECRs performed better, especially the ones with smaller initial defect size (0.004 percent), than the black bar control slabs because ECRs exhibited lower macrocell current and more positive SCP over the test period than those of the black bar counterparts. Macrocell current density of the black bars became negative in every category after 1,600 days (see figures 6, 8, and 10). Negative current readings indicated reversal of macrocell current between original anode (top mat) and original cathode (bottom mat) at the time of measurement. Such current reversal was caused by corroding bottom mat cathode steel first instead of usual corrosion initiation at the top mat bars. This situation was possible when chloride reached the black bars in the bottom mat and subsequently initiated the active corrosion there, while top mat ECRs were able to suppress corrosion. As discussed later, chloride concentration at some bottom bar depths was found to far exceed the chloride threshold for corrosion initiation of black bars (250 to 300 ppm).
Test slabs containing ECRs in both mats and stainless steel
Figures 11 and 12 show variations of mean SCP and macrocell current density with time for the slabs containing either ECRs in both mats or stainless steel. There were three test slabs containing stainless steel bars in the top mat or in both mats, and two of them were precracked. Because of the small number of slabs, the stainless steel slabs were treated as one variable, even though some contained cracks and/or black bottom bars. Each pair of ECRs in the top and bottom mats contained the same coating damage (0.004 or 0.5 percent), and every slab contained two pairs of ECRs with each of the two coating defect areas. While the 0.5 percent damaged ECRs exhibited more negative potentials compared to the others (ECRs with 0.004 percent coating defect and stainless steel) during most of the exposure time, all of the mean macrocell current density data remained very small throughout the test period. Mean macrocell current density of stainless steel bars with black bottom steel became negative at around 1,600 days due to active corrosion in the bottom black mat. Furthermore, when ECR was used in both mats, the coating defect size did not make a noticeable difference in macrocell current density output, which approached that of stainless steel bars. This observation suggests that using ECRs in both mats in northern bridge decks is likely to give very high corrosion resistance in corrosive environments under deicing salt applications, and may approach an equivalent corrosion resistance to that offered by stainless steel bars.
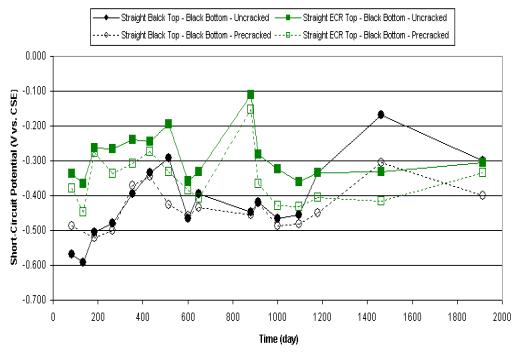
The effect of having precracks on SCP and macrocell current density can be seen in figures 13 and 14, which show the change of mean SCP and mean macrocell current density with time for the slabs containing straight black bars and straight ECRs, respectively. All the top bars were connected to black bottom bars. In general, mean SCP and macrocell current density data for black bars and top mat ECRs behaved similarly in precracked and uncracked concrete during the outdoor weathering test period. The presence of the precrack influenced the time-to-corrosion initiation during the initial 96 weeks of SE testing more than after long-term outdoor exposure.
Figures 15 and 16 show the change of mean SCP and mean macrocell current density with time for straight and bent ECRs in uncracked concrete, respectively. Test slabs containing ECRs in both mats exhibited the most negative mean SCP among three groups, however, the performance between the groups was not largely different. When bent ECRs were connected to the black bottom bars, they produced the highest mean macrocell current density and were followed closely by the straight ECRs coupled with black bottom bars. In contrast, test slabs containing straight ECRs in both mats exhibited insignificant mean macrocell current density throughout the entire exposure period.
Further data analysis related to slab configuration and bar type
Table 9 summarizes the mean values of the test data presented in figures 5 through 12 according to four bar types (black, stainless steel, ECR with 0.5 percent initial coating damage, and ECR with 0.004 percent initial coating damage) and five slab configurations (straight top-black bottom-uncracked, straight top-ECR bottom-uncracked, straight top-black bottom-precracked, bent top-black bottom-uncracked, and stainless steel bars in uncracked).
The SCP and macrocell current density data listed in table 9 also are presented in figures 17 and 18, respectively. As shown in figure 17, black and stainless steel bars exhibited the most negative and positive mean SCP, respectively. Mean SCP of the black bars moved in the negative direction when slabs contained precracks and bent bars. When coating defect size decreased from 0.5 to 0.004 percent, the mean SCP became more positive (lower corrosion tendency). As observed in figures 5 through 16, mean macrocell current density varied significantly depending on slab configuration and bar type. This trend is summarized in figure 18. The black bars produced the highest mean macrocell current density among various combinations of test variables regardless of slab configuration, i.e., presence of crack and bar shape (bent vs. straight).
To illustrate relative significance of slab configuration and
bar type on the mean macrocell current density, figure 19 presents
the ratios of macrocell current density data shown in table 9 and
figure 18 by dividing them by the highest average value (1.3
![]() A/cm2 (8.4
A/cm2 (8.4 ![]() A/in.2)) of the black bent bar-black
bottom-uncracked concrete slabs. The stainless steel bars exhibited
negligible mean macrocell current density which was only 1 percent
of the highest black bar case. For straight ECRs, the mean
macrocell current density was influenced by the size of the initial
coating damage and whether the bottom mat bar was coated or
uncoated. When straight ECRs in the top mat were coupled with black
bars in the bottom mat, the size of coating defect became a factor
for controlling macrocell current density. In the case of straight
top ECRs containing 0.004 percent of initial coating defect coupled
with black bottom bars, mean macrocell current density was 7 to 21
percent of the highest black bar case, depending on the presence of
precracks. If straight top ECRs contained 0.5 percent initial
coating defect, the current values increased to more than 40
percent of the highest black bar case, regardless of whether the
slab had a precrack. For bent ECRs, even ones containing 0.004
percent coating damage produced noticeable macrocell current
density when they were connected to black bottom bars, such that
mean macrocell current density increased to 38 and 49 percent of
the highest black bar case, regardless of initial coating defect
size. If top mat ECRs were connected to ECRs in the bottom mats in
uncracked concrete, the effect of coating damage on macrocell
current density was minor, and the ratio decreased to no greater
than 2 percent of the highest black bar data. They behaved
similarly to stainless steel bars.
A/in.2)) of the black bent bar-black
bottom-uncracked concrete slabs. The stainless steel bars exhibited
negligible mean macrocell current density which was only 1 percent
of the highest black bar case. For straight ECRs, the mean
macrocell current density was influenced by the size of the initial
coating damage and whether the bottom mat bar was coated or
uncoated. When straight ECRs in the top mat were coupled with black
bars in the bottom mat, the size of coating defect became a factor
for controlling macrocell current density. In the case of straight
top ECRs containing 0.004 percent of initial coating defect coupled
with black bottom bars, mean macrocell current density was 7 to 21
percent of the highest black bar case, depending on the presence of
precracks. If straight top ECRs contained 0.5 percent initial
coating defect, the current values increased to more than 40
percent of the highest black bar case, regardless of whether the
slab had a precrack. For bent ECRs, even ones containing 0.004
percent coating damage produced noticeable macrocell current
density when they were connected to black bottom bars, such that
mean macrocell current density increased to 38 and 49 percent of
the highest black bar case, regardless of initial coating defect
size. If top mat ECRs were connected to ECRs in the bottom mats in
uncracked concrete, the effect of coating damage on macrocell
current density was minor, and the ratio decreased to no greater
than 2 percent of the highest black bar data. They behaved
similarly to stainless steel bars.
Figure 20 shows the effect of coating defect size on macrocell current density for ECRs in top mat only and ECRs in both mats cases. A regression analysis shows a well-defined relationship, indicating that defect size makes a significant influence on the ECRs coupled with black bottom bars, but the coating size effect is diminished when ECRs are used in both mats.
Table 10 lists mean SCP and mean macrocell current density data per coating type. The same data are presented in figures 21 and 22. Because of a large variation among different coating types, mean macrocell current density is presented in two scales: a linear scale in figure 22(a) and a logarithmic scale in figure 22(b). Performance differences are difficult to interpret from the SCP data in figure 21. Generally, coatings C and F had the worst SCP data, while coatings A, D, and E had the best SCP data. It can be seen in figure 22 that mean macrocell current density varied significantly by coating type, which could be related to coating quality, but such variation disappeared when ECRs were used in both mats. Coatings A and D performed well in all configurations, while coatings C and F had generally poor performance (except for the case of ECRs in both mats).
A statistical analysis was conducted to calculate sample mean
(![]() ) and sample standard deviation
(s) for SCP, macrocell current density, AC resistance, and
impedance modulus at 0.1 Hz data. Then, the results were used to
determine the 95 percent confidence interval for the unknown
population mean (
) and sample standard deviation
(s) for SCP, macrocell current density, AC resistance, and
impedance modulus at 0.1 Hz data. Then, the results were used to
determine the 95 percent confidence interval for the unknown
population mean (![]() ). The 95 percent
confidence interval for
). The 95 percent
confidence interval for ![]() means that researchers
are 95 percent confident that the unknown
means that researchers
are 95 percent confident that the unknown ![]() is within this interval for a variable. Statistical
analysis was performed for the variables classified
by combinations of slab configuration and bar type, and the
final results are provided in figures 23 through 26.
is within this interval for a variable. Statistical
analysis was performed for the variables classified
by combinations of slab configuration and bar type, and the
final results are provided in figures 23 through 26.
Figure 23 shows the distribution of ![]() for the SCP data categorized by 12 combinations of test
variables. The
for the SCP data categorized by 12 combinations of test
variables. The ![]() 's are evenly distributed
among different variables. The stainless steel bars and bent black
bars exhibited the most positive and most negative SCP mean values,
respectively.
's are evenly distributed
among different variables. The stainless steel bars and bent black
bars exhibited the most positive and most negative SCP mean values,
respectively.
Figure 24 shows distribution of ![]() 's for the macrocell current density data categorized by
12 combinations of test variables. As noted in earlier sections,
use of stainless steel bars and ECRs containing 0.004 percent
initial coating damage produced the least current density. When
ECRs having 0.5 percent initial coating defect are used in both
mats, the macrocell current density slightly increased from zero.
These are followed by straight ECRs containing 0.004 percent
coating defects in the top mat only and other top mat only ECR
cases. The black bar cases yielded the highest mean values.
's for the macrocell current density data categorized by
12 combinations of test variables. As noted in earlier sections,
use of stainless steel bars and ECRs containing 0.004 percent
initial coating damage produced the least current density. When
ECRs having 0.5 percent initial coating defect are used in both
mats, the macrocell current density slightly increased from zero.
These are followed by straight ECRs containing 0.004 percent
coating defects in the top mat only and other top mat only ECR
cases. The black bar cases yielded the highest mean values.
High coating resistance and impedance is characteristic of a
quality, corrosion-resistant coating. Figures 25 and 26 show
distribution of ![]() 's for AC resistance
measured between the two mats and impedance modulus at 0.1 Hz of
top mat bar, respectively. Impedance modulus data exhibited larger
variations and higher absolute values than did the AC resistance
test data. The four highest upper limits of
's for AC resistance
measured between the two mats and impedance modulus at 0.1 Hz of
top mat bar, respectively. Impedance modulus data exhibited larger
variations and higher absolute values than did the AC resistance
test data. The four highest upper limits of ![]() 's were achieved by ECRs containing 0.004 percent
coating defect. However, the lowest limit of
's were achieved by ECRs containing 0.004 percent
coating defect. However, the lowest limit of ![]() 's was near zero resistance for most combinations of
test variables.
's was near zero resistance for most combinations of
test variables.
Researchers began test slab autopsies by making a 1.3-cm (0.5-inch) deep groove along the bottom side of the slabs at two locations (figure 27) using a gas-powered saw. A test slab was split into several fragments by using a chisel and hammer. Embedded bars were then carefully extracted using a small chisel and hammer (figure 28). Researchers exercised caution when removing ECRs to avoid coating damage.
Figure 29 shows a photograph of a top mat straight ECR that performed well throughout the severe testing regime. The ECR and concrete/bar interface appearance was excellent, with no sign of corrosion. Figure 30 shows a severely corroded, straight, top mat ECR. Figures 31 and 32 show photographs of well and poorly performing bent ECRs, respectively, both from the top mat.
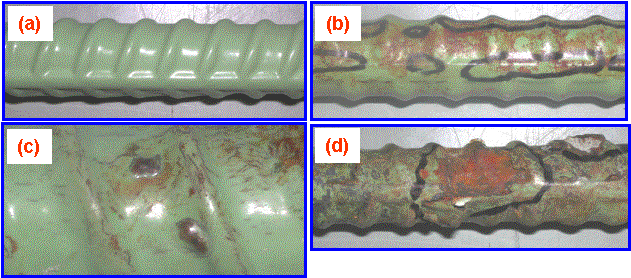
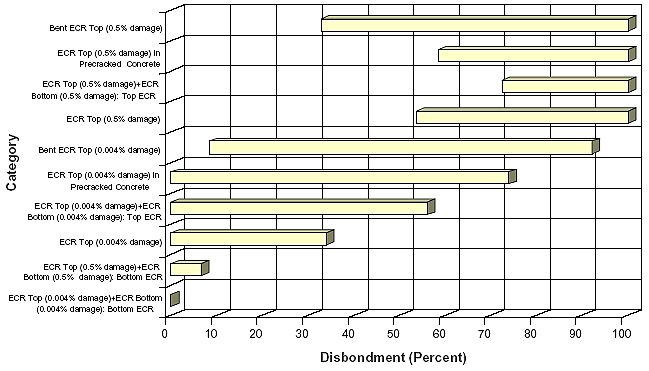
Closeup examination of the extracted ECRs revealed four different coating conditions, which are shown in figure 33. When the ECR performed well, the exposed coating looked new with a glossy texture (figure 33(a)). It was observed that when the epoxy coating reaches the advanced stage of deterioration due to corrosion, the coating exhibits numerous hairline cracks (figure 33(b)) and then blisters (figure 33(c)). Accumulation of multiple rust layers beneath disbonded coating was also a common corrosion morphology observed on severely corroded ECRs (figure 33(d)). The disbonded coating mentioned above was defined as a permanently separated coating from substrate upon knife adhesion test performed several days after the ECRs were excavated. Therefore, it was different from temporary adhesion loss, which can recover fully or partially with time.
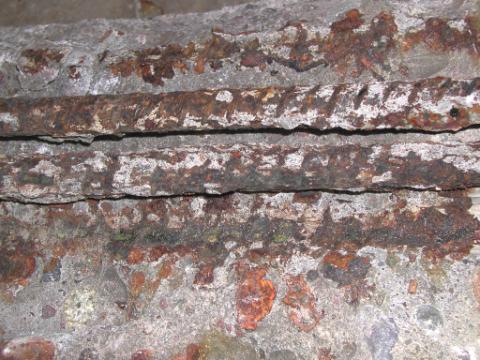
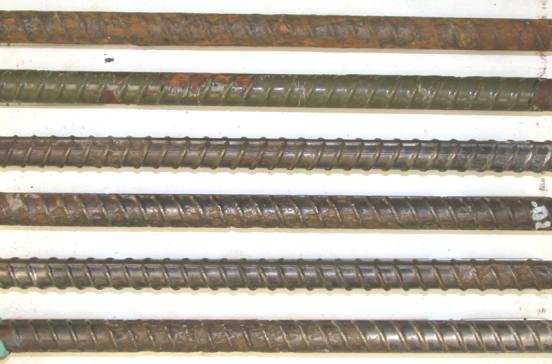
Figures 34 and 35 show photographs of a severely corroded straight black bar and a poorly performed bent black, respectively. Figure 36 shows a photograph of a broken test slab fragment, which exhibited active corrosion in the bottom black bar mat.
All of the extracted bars, including those in the bottom mat, were carefully documented, cleaned, and examined according to the autopsy procedure described. Figures 37 and 38 show photographs of autopsied bars taken after they were cleaned. The bars shown in figure 37 were removed from slab #18, which contained ECRs in the top mat only. While one top ECR (the second bar from the top in the photograph) exhibited localized coating disbondment originated from corrosion at the smaller artificial coating defects (0.004 percent), the other top ECR (the first bar from the top in the photograph) experienced severe corrosion, again initiated at the larger artificial coating defects (0.5 percent), such that the epoxy coating could be peeled off completely.
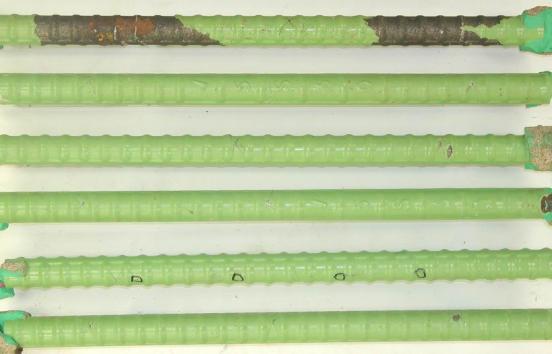
The bars shown in figure 38 were removed from slab #10, which contained ECRs in both mats. While one top ECR (the second bar from top in the photograph) exhibited virtually no reduction in adhesion even at the smaller artificial coating defects (0.004 percent), the other top mat ECR (the first bar from top in the photograph) experienced moderate corrosion that initiated at the larger artificial coating defects (0.5 percent), such that epoxy coating could be peeled off locally around the initial defects. The ECRs extracted from the bottom mat were corrosion-free and had minimal adhesion loss. The photographs of individual autopsied bars are included in appendix A.
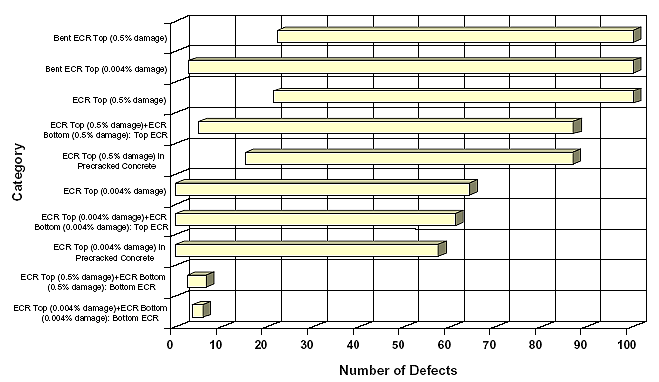
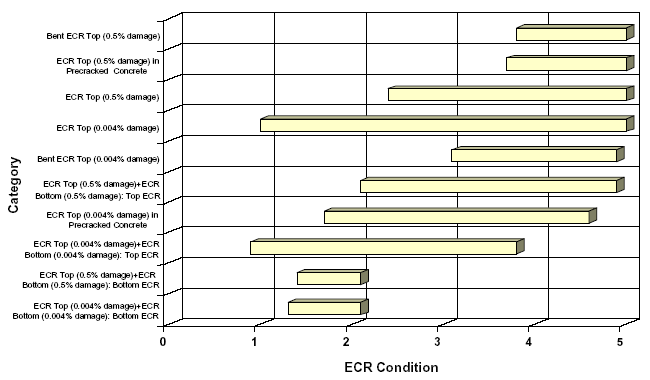
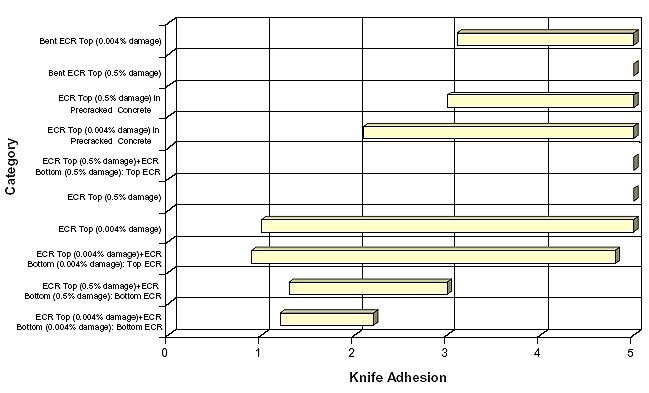
Tables 11 and 12 summarize the findings of the autopsied ECRs in terms of the number of final defects, coating thickness, exterior physical appearance, knife adhesion, and degree of adhesion loss. Final defects were classified as bare area, mashed area (mechanical damage), coating crack, and holiday. The number of final coating defects on the autopsied ECRs was very large on some poorly performing bars, while others maintained good coating continuity. The coating cracks as shown in figure 33 were the most frequent form of coating deterioration. When the coating defects were too excessive to count individual defects, an arbitrary number of 100 was assigned to quantify the worst condition in the subsequent data analysis.
Figures 39 through 42 present the 95 percent confidence
intervals for ![]() of the data provided in
tables 11 and 12. Each plot was constructed for 10 combinations of
test variables. It is statistically significant that the ECRs
removed from the bottom mat of the ECR top-ECR bottom slabs
exhibited the least number of final defects (figure 39) and the
best appearance (figure 40). The bottom mat ECRs extracted from
these slabs also exhibited the strongest knife adhesion (figure 41)
and the least amount of coating disbondment (figure 42). Their
performance was followed by the top mat straight ECRs containing
0.004 and 0.5 percent coating defects, respectively. Conditions of
top mat ECRs that were removed from the ECR top-ECR bottom slabs
were not particularly different from those of the top mat only
cases. Based on macrocell current density data and autopsy results,
the excellent performance of test slabs containing ECRs in both
mats should be attributed to the fact that the presence of ECR in
the bottom mat suppresses the corrosion activity by minimizing the
cathodic reaction (oxygen reduction through consuming electrons).
In general, bent ECRs, when coupled with black bottom bars,
performed the worst of all materials tested.
of the data provided in
tables 11 and 12. Each plot was constructed for 10 combinations of
test variables. It is statistically significant that the ECRs
removed from the bottom mat of the ECR top-ECR bottom slabs
exhibited the least number of final defects (figure 39) and the
best appearance (figure 40). The bottom mat ECRs extracted from
these slabs also exhibited the strongest knife adhesion (figure 41)
and the least amount of coating disbondment (figure 42). Their
performance was followed by the top mat straight ECRs containing
0.004 and 0.5 percent coating defects, respectively. Conditions of
top mat ECRs that were removed from the ECR top-ECR bottom slabs
were not particularly different from those of the top mat only
cases. Based on macrocell current density data and autopsy results,
the excellent performance of test slabs containing ECRs in both
mats should be attributed to the fact that the presence of ECR in
the bottom mat suppresses the corrosion activity by minimizing the
cathodic reaction (oxygen reduction through consuming electrons).
In general, bent ECRs, when coupled with black bottom bars,
performed the worst of all materials tested.
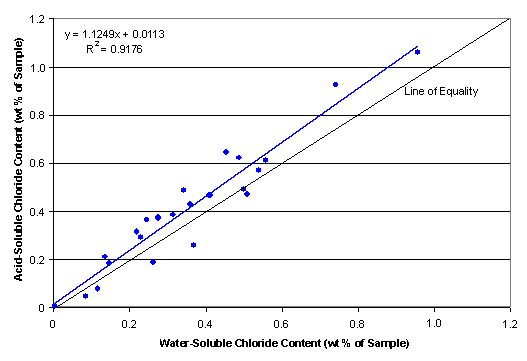
Tables 6 through 8 list the water-soluble chloride data for every bar in the top mat. Based on the reversal of macrocell current and the high level of chloride in the top mat, some slabs were selected for additional chloride analysis at the bottom mat. To estimate the total chloride, limited acid-soluble chloride analysis also was conducted, with the selected powder samples representing various concentrations of water-soluble chloride. Figure 43 shows a result of the regression analysis demonstrating a relationship between water-soluble vs. acid-soluble chloride concentration. Regression analysis of the experimental chloride data indicates that the water-soluble chloride concentration of the concrete is approximately 89 percent of the total (acid-soluble) chloride concentration. Coarse aggregates used in this project came from Eau Claire, WI. Because these aggregates did not contain chlorides, the acid-soluble (total chlorides) and water-soluble (free chlorides) test results were similar.
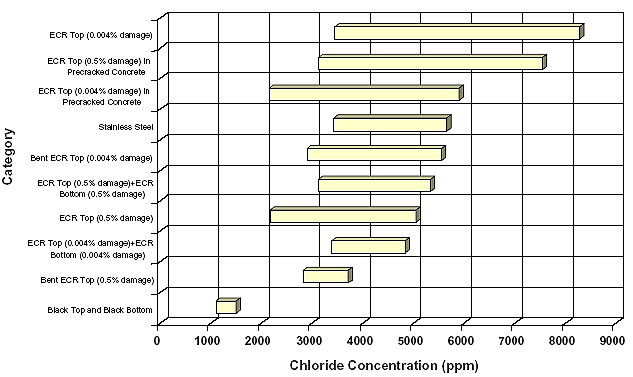
Figure 44 shows the 95 percent confidence intervals for
![]() for 10 combinations of test variables. It is
interesting to note that water-soluble chloride concentration in
the top mat containing black bars was far lower than the rest. This
is likely due to the fact that the slabs containing black bars were
cracked and delaminated after the 96-week SE testing and before
being placed outdoors. Rainwater passing through the cracks and
delaminations likely dissolved some of the free chloride ions in
the concrete near the top mat of steel. Compounding of the free
chloride in the black bar rust products also may have occurred.
for 10 combinations of test variables. It is
interesting to note that water-soluble chloride concentration in
the top mat containing black bars was far lower than the rest. This
is likely due to the fact that the slabs containing black bars were
cracked and delaminated after the 96-week SE testing and before
being placed outdoors. Rainwater passing through the cracks and
delaminations likely dissolved some of the free chloride ions in
the concrete near the top mat of steel. Compounding of the free
chloride in the black bar rust products also may have occurred.
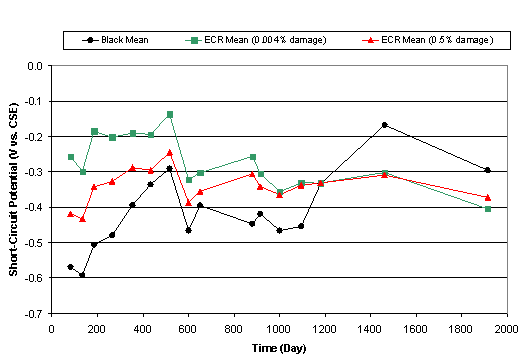
Figure 5. Short-circuit potential change with time (straight top
(black and ECR)-black bottom-uncracked concrete) during outdoor
exposure
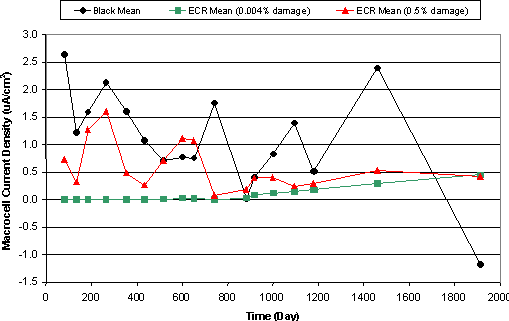
Figure 6. Macrocell current density change with time (straight top
(black and ECR)-black bottom-uncracked concrete) during outdoor
exposure
Figure 7. Short-circuit potential change with time (straight top (black and ECR)-black bottom-cracked concrete) during outdoor exposure
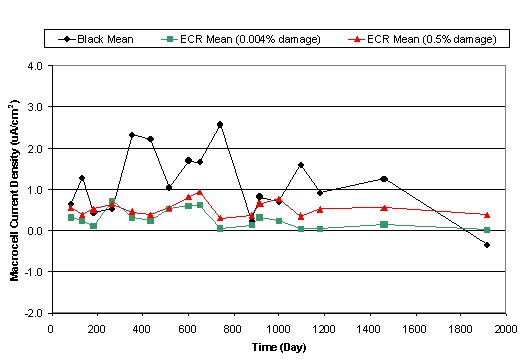
Figure 8. Macrocell current density change with time (straight top
(black and ECR)-black bottom-cracked concrete) during outdoor
exposure
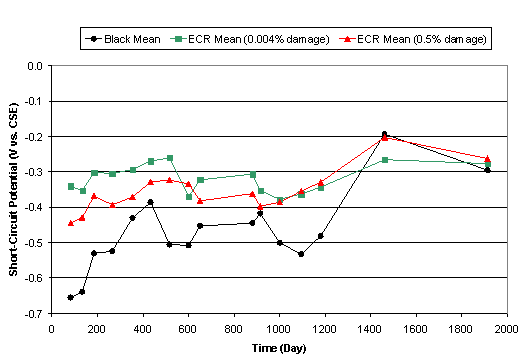
Figure 9. Short-circuit potential change with time (bent top (black
and ECR)-black bottom-uncracked concrete) during outdoor
exposure
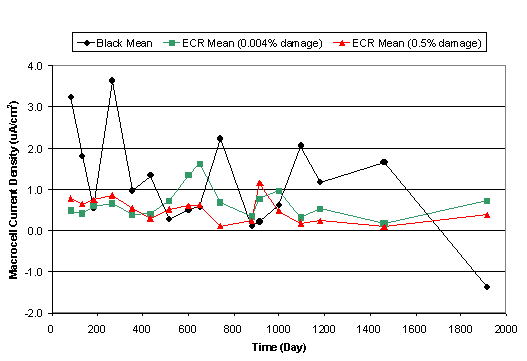
Figure 10. Macrocell current density change with time (bent top
(black and ECR)-black bottom-uncracked concrete) during outdoor
exposure
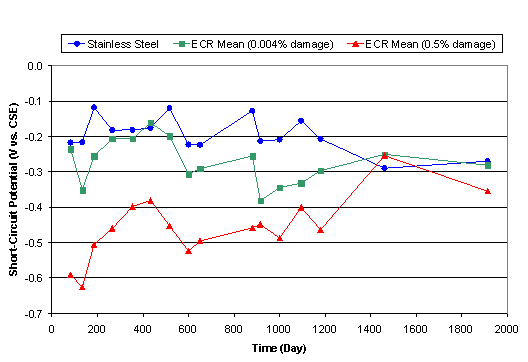
Figure 11. Short-circuit potential change with time (stainless
steel and ECR in both mats-uncracked concrete)
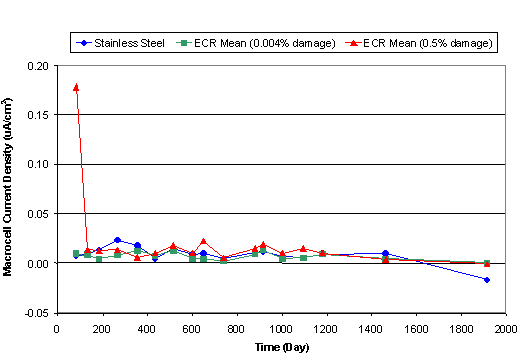
Figure 12. Macrocell current density change with time (stainless
steel and ECR in both mats-uncracked concrete)
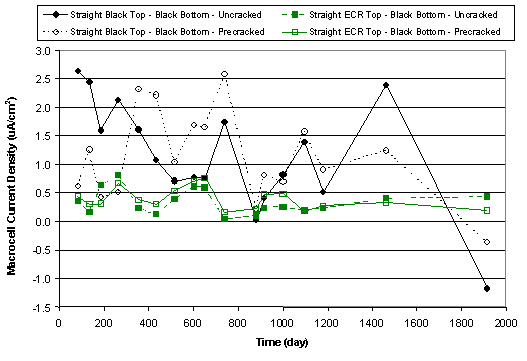
Figure 14. Mean macrocell current density change with time
(uncracked vs. precracked concrete)
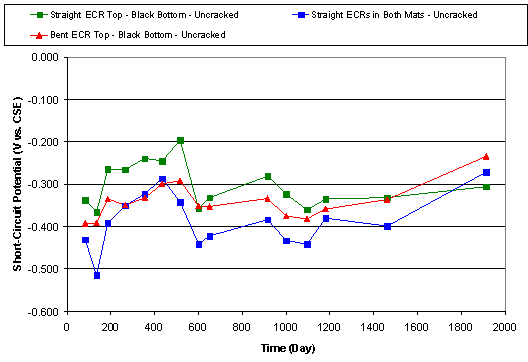
Figure 15. Mean short-circuit potential change with time (straight
vs. bent ECRs in uncracked concrete)
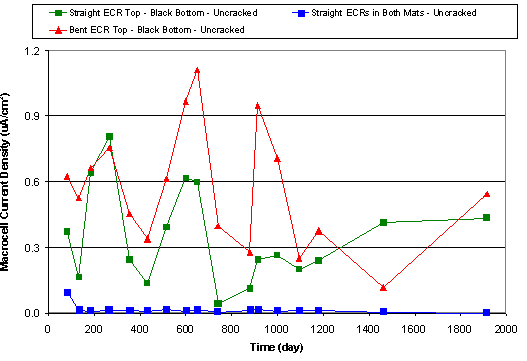
Figure 16. Mean macrocell current density change with time
(straight vs. bent ECRs in uncracked concrete)
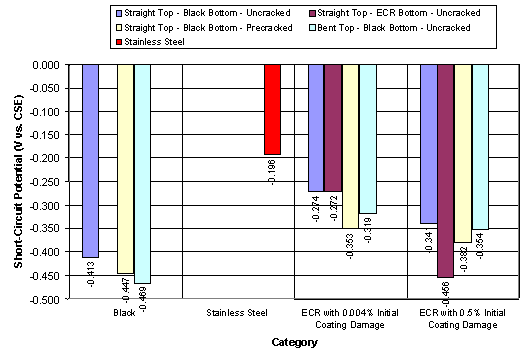
Figure 17. Mean short-circuit potential data classified by bar type
(from table 9)
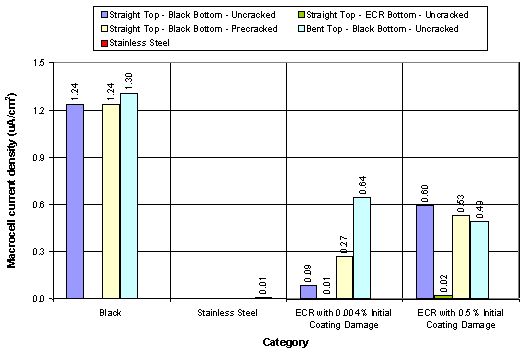
Figure 18. Mean macrocell current density data classified by bar
type (from table 9)
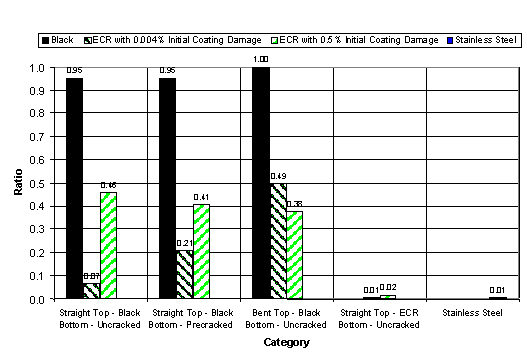
Figure 19. Relative ratio of macrocell current density per slab
configuration
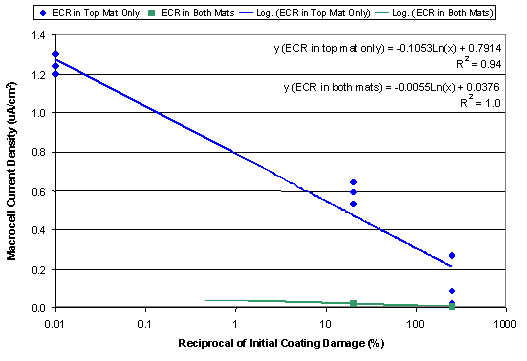
Figure 20. Relationship between macrocell current density versus
initial artificial coating defects
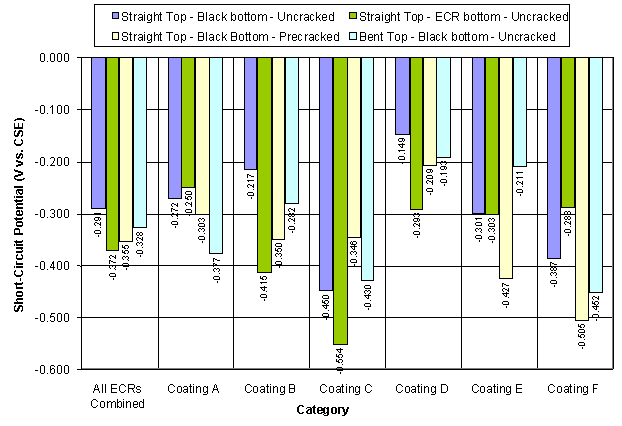
Figure 21. Short-circuit potential data classified by coating
type
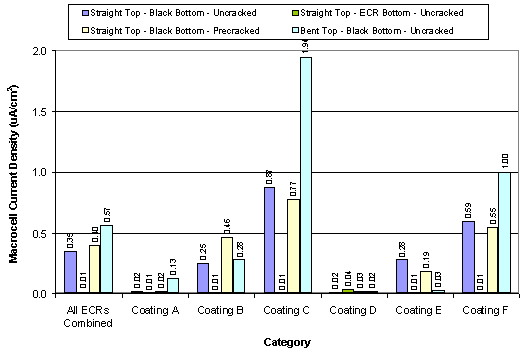
Figure 22(a). Macrocell current density data classified by coating
type (linear scale)
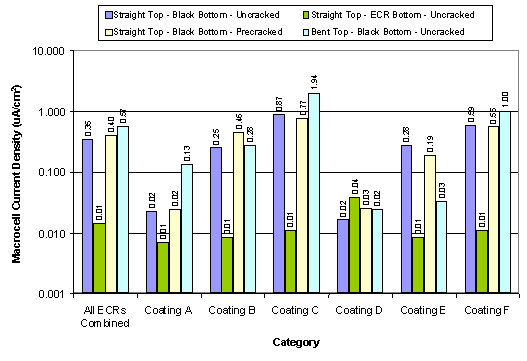
Figure 22(b). Macrocell current density data classified by coating
type (logarithmic scale)
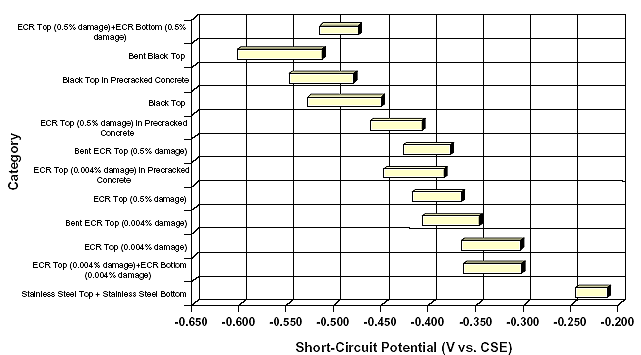
Figure 23. Ninety five percent confidence intervals for
short-circuit potential data
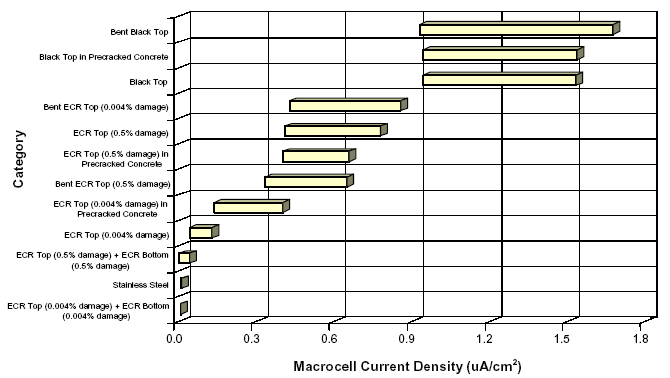
Figure 24. Ninety five percent confidence intervals for macrocell
current density data
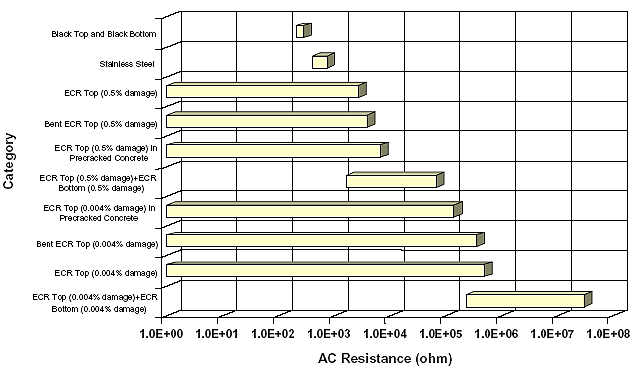
Figure 25. Ninety five percent confidence intervals for AC
resistance data
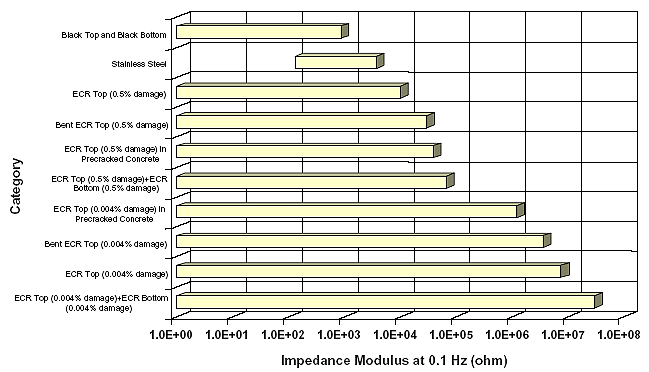
Figure 26. Ninety five percent confidence intervals for impedance
modulus data
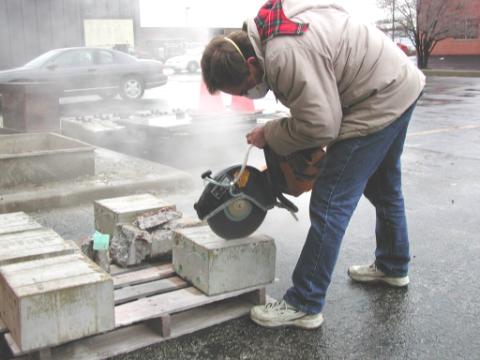
Figure 27. Cutting a test slab with a gas-powered saw
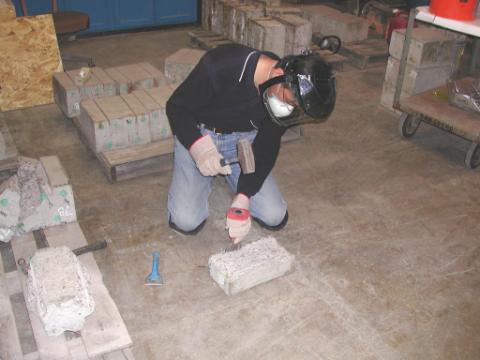
Figure 28. Extraction of embedded reinforcing bars
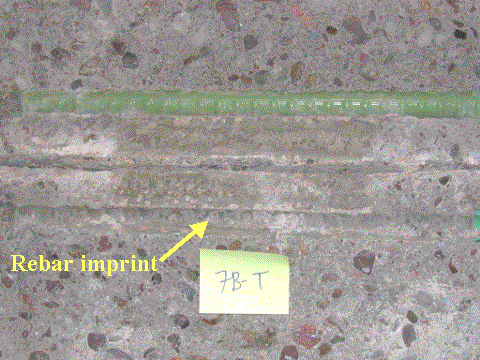
Figure 29. Typical condition of ECR with good corrosion resistance
(slab #7—top right bar)
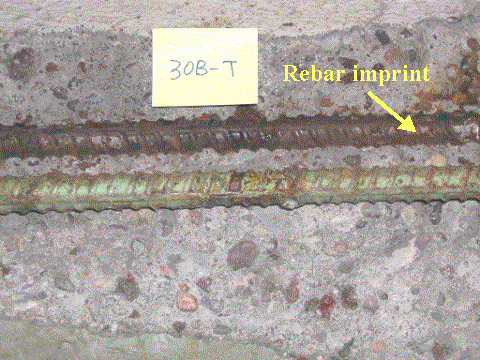
Figure 30. Typical condition of ECR with poor performance (slab
#30—top right bar)
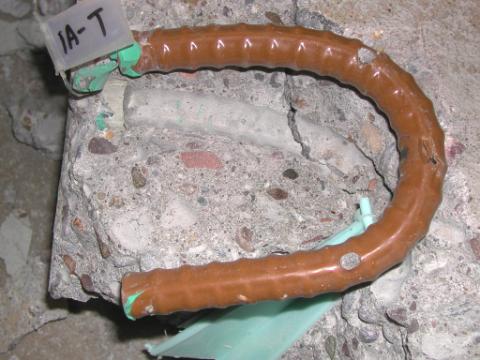
Figure 31. Typical condition of a bent ECR with good performance
(slab #1—top left bar)
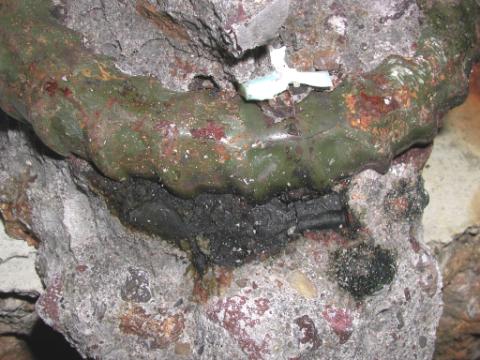
Figure 32. Typical condition of a bent ECR with poor
performance
Figure 33. Closeup views of ECRs exhibiting
various conditions:
(a) an intact ECR; (b) an ECR containing hairline coating
cracks;
(c) an ECR containing coating blisters and hairline coating cracks;
and
(d) a delaminated ECR revealing severely corroded substrate
Figure 34. Typical condition of black bars in the top mat
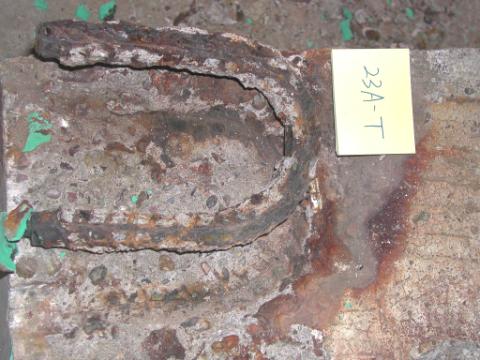
Figure 35. Typical condition of black bent bars in the top mat (slab #23—top right bar)
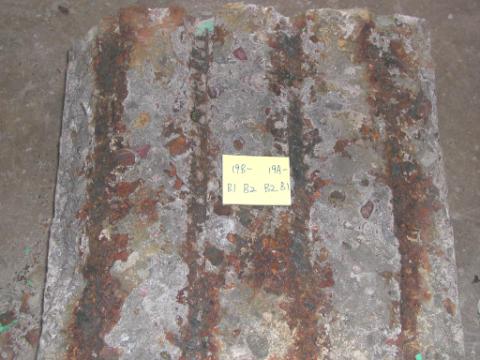
Figure 36. Corroded bottom mat (slab #19)
Figure 37. Photograph of autopsied bars extracted from slab #18 (ECR top-black bar bottom)
Figure 38. Photograph of autopsied bars extracted from slab #10 (ECRs in both mats)
Figure 39. Ninety five percent confidence intervals for number of final defects
Figure 40. Ninety five percent confidence intervals for ECR rating data
Figure 41. Ninety five percent confidence intervals for knife adhesion data
Figure 42. Ninety five percent confidence intervals for extent of disbondment data
Figure 43. Relationship between water-soluble versus acid-soluble chloride data
Figure 44. Ninety five percent confidence intervals for water-soluble chloride data at top bar depth