U.S. Department of Transportation
Federal Highway Administration
1200 New Jersey Avenue, SE
Washington, DC 20590
202-366-4000
Federal Highway Administration Research and Technology
Coordinating, Developing, and Delivering Highway Transportation Innovations
 |
| This report is an archived publication and may contain dated technical, contact, and link information |
|
Publication Number: FHWA-HRT-05-063
Date: May 2007 |
Evaluation of LS-DYNA Concrete Material Model 159PDF Version (6.84 MB)
PDF files can be viewed with the Acrobat® Reader® Chapter 4. Regulation of Softening FormulationOne desirable attribute of the finite element method is convergence of the solution with reasonable mesh refinement. However, finite element solutions are known to have difficulty converging if the materials being modeled contain softening formulations. With softening formulations, there is a tendency for the greatest amount of damage to accumulate in the smallest elements. This is the result of modeling smaller fracture energy in the smaller elements. To overcome this tendency, a regulatory method was implemented to promote convergence by eliminating element-to-element variation in fracture energy. Refer to this report's companion Users Manual for a theoretical discussion of the regulatory technique implemented.(6) This chapter demonstrates convergence of results using the regulatory technique implemented for both single element and single material simulations. Single Elements in Tension and CompressionCalculations were performed with single elements as a first step in evaluating mesh objectivity of the softening response. Calculations were performed for four cube sizes: 12.7 mm (0.5 inches), 38.1 mm (1.5 inches), 76.2 mm (3 inches), and 152.4 mm (6 inches) on each side. Each cube is modeled with quarter symmetry using nodal boundary conditions. Two loading conditions are analyzed. These are direct pull (uniaxial tensile stress) and unconfined compression (uniaxial compression stress). In each case, a uniform constant velocity is applied to the four nodes at one end of the element, while the four nodes at the other end are restrained from axial motion (lateral motion is not restrained). The velocity is 2.54 millimeters per second (mm/sec) (0.1 inch per second (inch/sec)) and is held constant for the duration of the simulations. Stress-displacement curves for the direct pull simulations are shown in Figures 27 and 28. All elements exhibit linear elastic behavior to peak strength, followed by softening. The strength is independent of element size, although the displacement at peak strength increases with increasing element size. If stress-strain rather than stress-displacement were plotted (not shown), then all elements would peak at the same strain level (as expected). Shifted stress-displacement results are shown in Figures 27 and 28. The curves are shifted by subtracting the displacement at peak stress from the displacement history. With such manipulation, the peak stress of each curve is plotted at a shifted displacement of 0. Plotted in this manner, the softening portion is identical for each curve, as desired. Hence the fracture energy (area under the softening portion of the stress-displacement curve) is constant from one element to another. These simulations demonstrate that the element-based softening theory is accurate and implemented without any coding errors. Stress-displacement results for the unconfined compression simulations are shown in Figures 29 and 30. Once shifted, the softening portions of the four stress-displacement curves are close to, but not exactly equal to, each other. Careful checking of these results indicates that all four curves have the same fracture energy, but not the same shape. Note that all four curves have a point of agreement around 0.25 mm (0.01 inches) of displacement. For displacements less than 0.25 mm (0.01 inches), the smaller elements soften more rapidly than the larger elements. For displacements greater than 0.25 mm (0.01 inches), the smaller elements soften less rapidly than the larger elements. The overall result is consistent fracture energy from element to element.
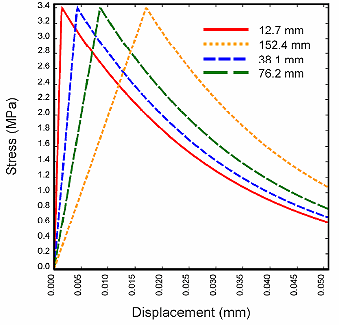
psi = 145.05 MPa, mm = 0.039 inch Figure 27. The fracture energy, which is the area under the softening portion of the stress-displacement curve, is independent of element size in the direct pull simulations (not shifted).
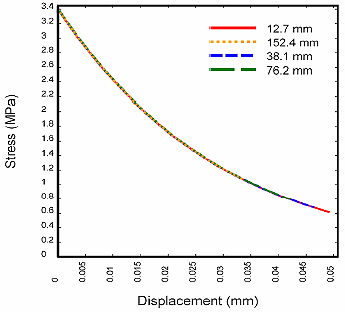
psi = 145.05 MPa, mm = 0.039 inch Figure 28. The fracture energy, which is the area under the softening portion of the stress-displacement curve, is independent of element size in the direct pull simulations (shifted to displacement at peak stress).
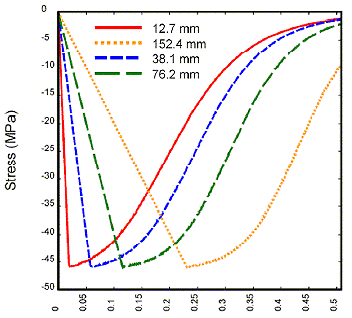
psi = 145.05 MPa, mm = 0.039 inch Figure 29. Although the fracture energy is constant, the softening curves vary slightly with element size in the unconfined compression simulations (not shifted).
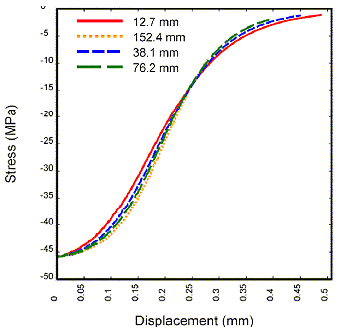
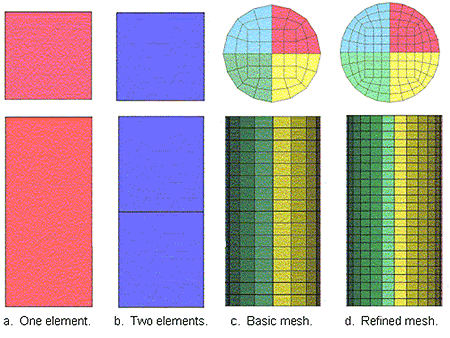
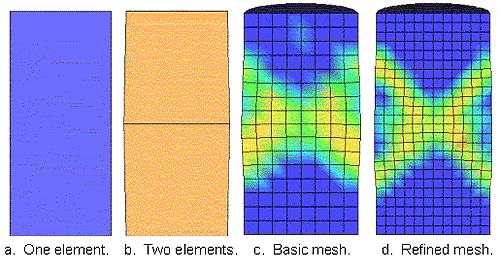
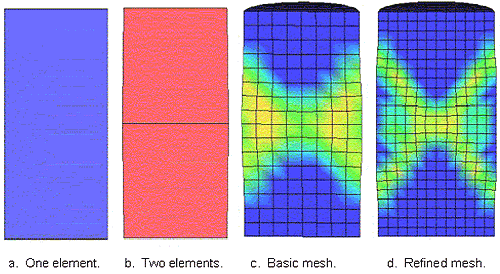
psi = 145.05 MPa, mm = 0.039 inch Figure 30. Although the fracture energy is constant, the softening curves vary slightly with element size in the unconfined compression simulations (shifted to displacement at peak stress). These results indicate that in compression, the regulatory method allows small differences in softening behavior to occur as a function of element size. However, the author suggests that the regulation is adequate despite these small differences. Figure 29 and 30 show that the largest and smallest elements vary in size by a factor of 12. This variation in element size is much larger than that typically meshed by most analysts. Within a region of interest, a factor of 2 variations in element size is typical. The 38.1-mm (1.5-inch) and 76.2-mm (3-inch) elements in Figures 29 and 30 vary in size by a factor of 2, and their difference in softening response is minimal. Cylinders in Tension and CompressionThe objective of this chapter is to demonstrate mesh size sensitivity, and its regulation, for direct pull and unconfined compression of a concrete cylinder. This chapter begins with a description of each mesh used in the calculations, followed by results of calculations performed without regulation of the softening formulation. In general, these calculations do not converge to a unique solution and therefore demonstrate mesh size sensitivity, which is undesirable. This demonstration is followed by a theoretical discussion of softening formulations, with and without regulation. The chapter then discusses the results of calculations performed with regulation. The direct pull simulations demonstrate convergence to a unique solution with reasonable mesh refinement. The unconfined compression calculations tend toward convergence, but do not actually converge. Finally, conclusions are drawn concerning application of the technique implemented for regulating convergence of material models containing softening formulations. Details of Each Cylinder MeshThe specimen analyzed is a concrete cylinder that is 304.8 mm (12 inches) long and 152.4 mm (6 inches) in diameter. This simple structure is being analyzed because it isolates one softening material model of interest, without interaction with other materials or complications from detailed boundary conditions or contact surfaces. Cylinders of two mesh refinements are analyzed, as shown in Figure 31. The basic mesh contains 768 solid elements. This mesh refinement is intended to be typical of what most users would generate to simulate a cylinder test. The more refined mesh contains 2,592 solid elements. This mesh is more refined than what most users would generate. In addition, one single element and a two element mesh are analyzed. The single element is 304.8 mm (12 inches) long and 135.1 mm (5.32 inches) along each edge of the square cross section, in such manner that the volume of the single element is equal to the volume of the cylinder. Each element of the two element mesh is 152.4 mm (6 inches) long, with a 135.1 mm (5.32 inches) by 135.1 mm (5.32 inches) cross section. Two loading conditions are analyzed. These are direct pull (uniaxial tensile stress) and unconfined compression (uniaxial compression stress). In each case, a uniform constant velocity is applied to the nodes at both ends of the cylinder. The velocity is 1.27 mm/sec. It is held constant for the 40 msec duration of the direct pull simulations and for the 1,500 msec duration of the unconfined compression simulations. One boundary condition is analyzed for direct pull of the cylinders. The boundary condition is no lateral constraint on the ends of the cylinder so that the cylinder is free to expand or contract laterally along its entire length. This idealized condition produces a realistic damage mode (breaking of the cylinder along one band of elements). One boundary condition is analyzed for the unconfined compression cylinder. The boundary condition is a fixed end condition (no lateral motion of the nodes along the top and bottom of the cylinder). This condition produces a realistic double diagonal-type damage mode often seen in tests.
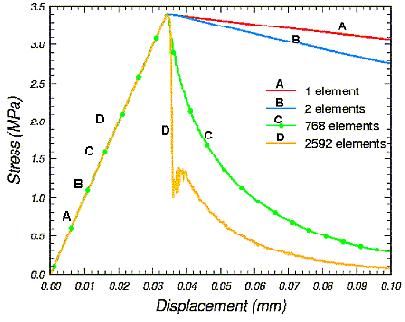
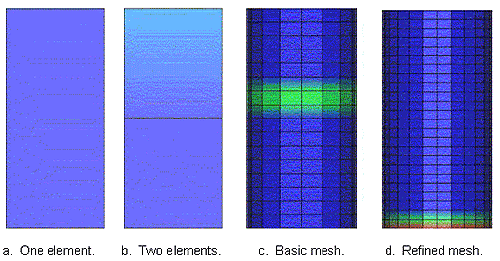
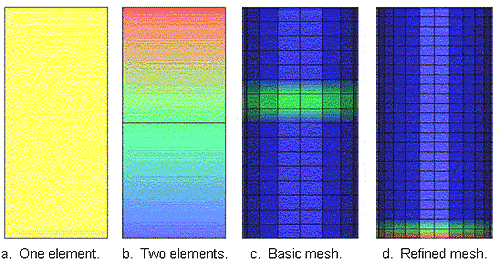
Figure 31. Refinement of each mesh used in sensitivity analyses. Demonstration of Mesh Size SensitivityDirect Pull without Regulation. Stress-displacement curves and damage fringes for the direct pull simulations without regulation are given in Figures 32 and 33. The stress history for the single and double elements is output directly from ls-post. The stress history for the cylinders is obtained from the cross-sectional force history that is output from ls-post. The cross section is located at the axial midplane of the cylinder. The stress is calculated by dividing the force history by the initial cross-sectional area of the cylinder (which is 719.2 millimeters square (mm2) (28.3 inches square (inches2)). Each displacement history is output by ls-post at the end nodes. Figure 32 demonstrates that the softening response becomes more and more brittle as the mesh is refined. In particular, the stress-displacement behavior for the basic mesh does not converge to that of the refined mesh. This situation is undesirable. The damage modes for the basic mesh and refined mesh (see Figure 33) are similar, although they appear to be different at first glance. Damage is localized into a single row of elements that soften as they stretch. The row of elements is at one end of the refined mesh, but more toward the center of the basic mesh. Parametric studies (not shown) indicate that the row of elements that damages is sensitive to the rate of loading. The rate of loading affects the uniformity of the stress distribution along the length of the cylinder. The rate of loading used in these calculations (quasi-static at 1.27 mm/sec (0.05 inch/sec) is slow enough that the stress distribution is uniform at peak strength to within about .001 of 1 percent. With a top-to-bottom uniform mesh, loading, and stress distribution, fracture is likely to occur anywhere along the length of the cylinder, and not necessarily at the center of the cylinder. However, the addition of friction at each end of the cylinder would probably push damage more toward the center of the cylinder. For the single element mesh, the damage mode is softening of the entire element. For the double element mesh, very slight damage initiates simultaneously in both elements. But then damage in one of the two elements rapidly dominates, resulting in the softening and stretching of that one element, while the other remains effectively undamaged. All direct pull calculations were conducted with the user-defined material model for concrete linked to version 970, using softening parameters of A = 0.2467 and B = 0.1 in tension (P < 0) and A = 1.058 and B = 100 in compression (P > 0). These parameters are more fully described in the next section.
psi = 145.05 MPa, mm = 0.039 inch Figure 32. The stress-displacement curves calculated in direct pull with an unregulated softening formulation do not converge as the mesh is refined.
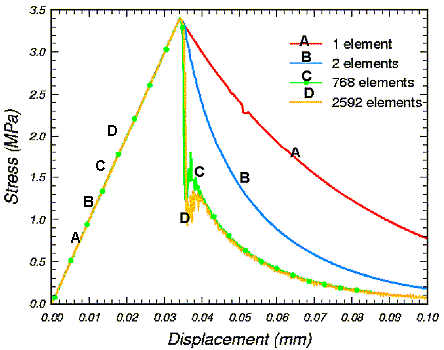
Figure 33. The damage mode calculated in direct pull with an unregulated softening formulation is damage within a single band of elements. Unconfined Compression without Regulation. Stress-displacement curves and damage fringes for these fixed end unconfined compression simulations without regulation are given in Figures 34 and 35. The softening response tends to become more brittle as the mesh is refined. However, lack of convergence is not nearly as pronounced as previously demonstrated in Figure 32 for the direct pull simulations. In fact, the stress-displacement behavior for the basic mesh resembles that of the refined mesh. The author of this report considers the agreement between the basic and refined mesh curves as acceptable. In addition, note that the single element does not damage. With fixed end conditions, the single element simulates uniaxial strain response, not uniaxial stress response. Therefore, this simulation displays hardening behavior (pushes the cap out without triggering damage) that is typically seen in tests of concrete under uniaxial strain conditions. The single element with fixed ends is a very poor representation of a cylinder with fixed ends. As seen in Figure 35, the damage mode for the basic mesh and refined mesh is similar. Damage is primarily localized into two diagonals, forming an X-shape. This damage is in agreement with the double diagonal damage mode commonly observed in compression tests with fixed ends. For the double element mesh, both elements damage almost simultaneously and equally.
psi = 145.05 MPa, mm = 0.039 inch Figure 34. The stress-displacement curves calculated in unconfined compression with an unregulated softening formulation are similar for the basic and refined meshes (fixed ends).
Figure 35. The damage mode calculated in unconfined compression with an unregulated softening formulation is a double diagonal (in the basic and refined meshes with fixed end conditions). Description of Regulatory TechniqueSoftening is a reduction in strength with continued straining once a damage threshold is reached. Softening is modeled via a damage formulation. Without the damage formulation, most material models predict perfectly plastic behavior for laboratory test simulations like direct pull and unconfined compression. Such behavior is not realistic for materials like concrete, rock, soil, composites, and wood. Softening is modeled with two parameters. Without regulation of mesh size dependency, these parameters are A and B, and are independent of element size. With regulation, these parameters are B and Gf rather than A and B. When the damage threshold is attained, the concrete material model internally solves for the value of A based upon the initial element size, the initial damage threshold, the fracture energy Gf, and a user-specified input value for B. Evaluation of Regulatory TechniqueDirect Pull with Regulation. Stress-displacement curves and damage fringes for the direct pull simulations with regulation are given in Figures 36 and 37. Although the softening response becomes more brittle as the mesh is refined, convergence is attained for the basic and refined meshes, as desired. In addition, the damage modes for the basic mesh and refined mesh are also in agreement: both calculate fracture along a single band of elements.
psi = 145.05 MPa, mm = 0.039 inch Figure 36. The stress-displacement curves calculated in direct pull with a regulated softening formulation converge as the mesh is refined.
Figure 37. The damage modes calculated in direct pull with a regulated softening formulation are in agreement for the basic and refined mesh simulations. All direct pull calculations were conducted with the user-defined material model for concrete linked to version 970, using softening parameters of Gf = 0.098 megapascal-millimeters (MPa-mm) (0.56 pounds per inch (lb/inch)) and B = 0.1 in tension (P < 0) with Gf = 9.81 MPa-mm (56 lb/inch) and B = 100 in compression (P > 0). Unconfined Compression with Regulation. Stress-displacement curves and damage fringes for these fixed end unconfined compression simulations with regulation are given in Figures 38 and 39. The stress-displacement behavior for the refined mesh is nearly in agreement with that of the basic mesh, although the refined mesh is slightly more ductile. Greater ductility with mesh refinement is opposite the trend observed for the direct pull simulations. The damage mode for the basic and refined meshes (see Figure 39) is similar. Damage is roughly localized into two diagonals, forming an X-shape. However, the damage is less diffuse (more localized), forming a sharper X, for the refined mesh than it is for the basic mesh. This situation suggests that a correlation may exist between diffusivity and softening response: the more diffuse the damage, the more brittle the softening behavior. These results also suggest that additional mesh refinement is needed to attain complete convergence.
psi = 145.05 MPa, mm = 0.039 inch Figure 38. The stress-displacement curves calculated in unconfined compression with a regulated softening formulation nearly converge as the mesh is refined (fixed ends).
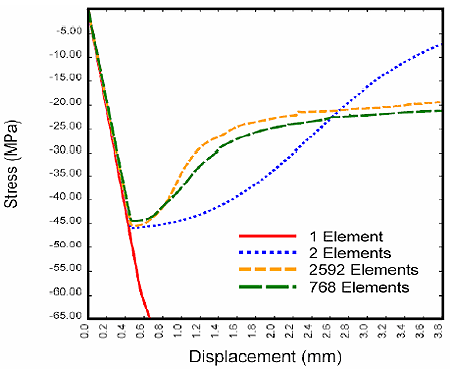
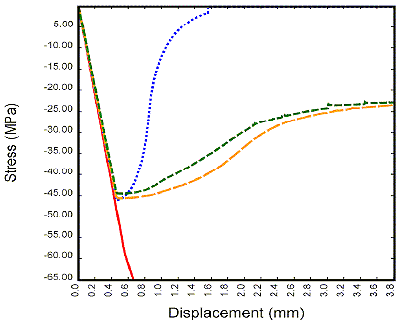
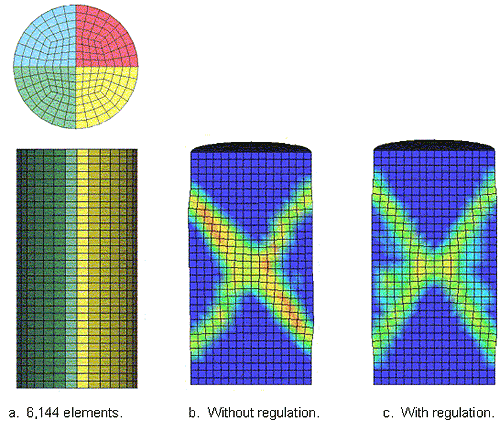
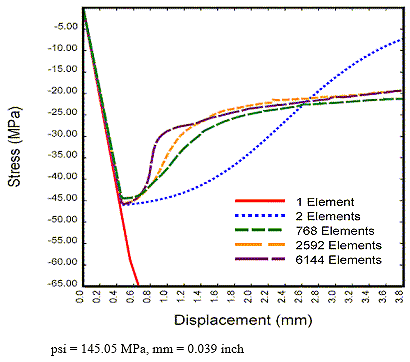
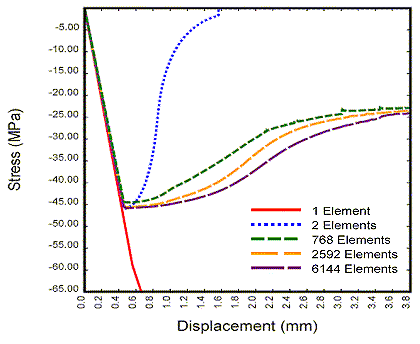
Figure 39. The X-shaped damage mode calculated in unconfined compression with a regulated softening formulation is similar for the basic and refined mesh simulations (fixed ends). The argument could be made, however, that the basic and refined mesh simulations conducted without regulation (Figures 34 and 35) are in just as good agreement as those conducted with regulation (Figures 38 and 39). Hence, these simulations are inconclusive with regard to whether the proposed regulation scheme is necessary for the compressive response mode. Note also that regulation has an opposite effect on the softening response in tension than it does in compression. In tension, regulation increases brittleness as the mesh is refined, at least until convergence is attained. In compression, regulation decreases brittleness (increases ductility) as the mesh is refined, hopefully until convergence is attained. Hence, if an analysis is conducted with a mesh that is too crude, there may be a tendency to underpredict tensile damage and overpredict compressive damage. All unconfined compression calculations were conducted with concrete material model 159 in ls-dyna version 971, using softening parameters of Gf = 0.098 MPa-mm (0.56 lb per inch (lb/inch)) and B = 0.1 in tension (P < 0) with Gf = 9.81 MPa-mm (56 lb/inch) and B = 100 in compression (P > 0). Effect of Additional Mesh Refinement on Cylinder ResponseA very refined mesh with 6,144 elements was created to further evaluate mesh size objectivity of the cylinder in compression. Refinement of this mesh is shown in Figure 40. Damage modes calculated with and without regulation are also shown in Figure 40. The calculations were conducted with fixed end conditions. Both calculations exhibit two diagonal bands of damage, forming an X. In the regulated calculation, these bands form simultaneously and about equally. In the unregulated calculation, one band forms prior to the other and exhibits greater damage. This X damage mode is the same as that previously calculated with less mesh refinement (768 and 2,592 elements), except now the damage is more localized so that the bands are more distinct. Stress-displacement histories are shown in Figure 41 for all calculations without regulation and in Figure 42 for all calculations with regulation. Without regulation, the history calculated with the very refined mesh is more brittle than those calculated with less mesh refinement. With regulation, the history calculated with the very refined mesh is slightly more ductile than those calculated with less mesh refinement. Agreement is reasonable, but not exact.
Figure 40. A crisp X-shaped band of damage is calculated for the very refined mesh, with or without regulation of the softening response.
psi = 145.05 MPa, mm = 0.039 inch Figure 41. The stress-displacement curves calculated in unconfined compression without a regulated softening formulation become more brittle as the mesh is refined (fixed ends).
psi = 145.05 MPa, mm = 0.039 inch Figure 42. The stress-displacement curves calculated in unconfined compression with a regulated softening formulation become more ductile as the mesh is refined (fixed ends). Summary Regarding RegulationThe direct pull calculations demonstrate that the technique implemented for regulating mesh size sensitivity achieves convergence of the solution with reasonable mesh refinement, as proposed. The direct pull calculations exercise the brittle damage mode only; therefore, this conclusion applies to the brittle damage mode only, and not the ductile damage mode. The unconfined compression calculations support the application of the proposed regulation technique for the ductile damage mode, but do not indicate that it is absolutely necessary. Convergence is reasonable, but not exact. The fixed end calculations produce a double diagonal (X-shaped) damage mode that becomes more localized (less diffuse) with mesh refinement. This damage mode is similar to that seen in cylinder tests. All calculations were performed for a single material without the use of contact surfaces or detailed boundary conditions. The appropriate element size to obtain convergence in more detailed applications may be problem dependent. Finally, as previously noted, regulation in tension increases brittleness, whereas regulation in compression decreases brittleness (as the mesh is refined), until convergence is attained. Hence, if an analysis is conducted with a mesh that is too crude, there will be a tendency to underpredict tensile damage and overpredict compressive damage. |