U.S. Department of Transportation
Federal Highway Administration
1200 New Jersey Avenue, SE
Washington, DC 20590
202-366-4000
Federal Highway Administration Research and Technology
Coordinating, Developing, and Delivering Highway Transportation Innovations
 |
| This report is an archived publication and may contain dated technical, contact, and link information |
|
Publication Number: FHWA-HRT-09-020
Date: April 2009 |
|||||||||||||||||||||||||||||||||||||||||||||||||||||||||||||||||||||||||||||||||||||||||||||||||||||||||||||||||||||||||||||||||||||||||||||||||||||||||||||||||||||||||||||||||||||||||||||||||||||||||||||||||||||||||||||||||||||||||||||||||||||||||||||||||||||||||||||||||||||||||||||||||||||||||||||||||||||||||||||||||||||||||||||||||||||||||||||||||||||||||||||||||||||||||||||||||||||||||||||||||||||||||||||||||||||||||||||||||||||||||||||||||||||||||||||||||||||||||||||||||||||||||||||||||||||||||||||||||||||||||||||||||||||||||||||||||||||||||||||||||||||||||||||||||||||||||||||||||||||||||||||||||||||||||||||||||||||||||||||||||||||||||||||||||||||||||||||||||||||||||||||||||||||||||||||||||||||||||||||||||||||||||||||||||||||||||||||||||||||||||||||||||||||||||||||||||||||||||||||||||||||||||||||||||||||||||||||||||||||||||||||||||||||||||||||||||||||||||||||||||||||||||||||||||||||||||||||||||||||||||||||||||||||||||||||||||||||||||||||||||||||||||||||||||||||||||||||||||||||||
Corrosion Resistant Alloys for Reinforced ConcretePrevious | Table of Contents | Next 3.0 MATERIALS AND EXPERIMENTAL PROCEDURES3.1 Reinforcing SteelsTable 1 lists the various steels that were employed in this study. These steels are the same as those addressed in the initial interim report for this project, except that Type 304 and Type 2304SS were acquired in the meantime and added to the test matrix. (19) Table 1. Listing of reinforcements that were investigated.
Composition for all of the bars is shown in table 2. Bar size in all cases was #5 (nominally 16 mm diameter) except for Type 304 SS, which was #4 (12.7 mm diameter). The two types of clad bars (designated as STAX and SMI) were fabricated by two distinct processes. The former were created by packing a stainless steel tube with steel scrap followed by rolling. The latter was created by applying a plasma spray of stainless steel to a carbon steel billet and then rolling it. Unless noted otherwise, bars were tested in the as-received surface condition. Table 2. Composition of the reinforcements. [KF1]
- indicates element not reported. 3.2 Concrete Mix DesignsThree concrete test designs designated STD1 (five bags cement and 0.50 water-to-cement ratio (w/c)), which yields a high permeability concrete; STD2 (seven bags of cement and 0.41 w/c), which results in moderate permeability; and STD3 (seven bags of cement and 0.50 w/c), which is of improved permeability between that of STD1 and STD2, were employed. Target mix designs for each of these are listed in table 3. The various corrosion resistant alloy types, in addition to BB (table 1), were used as reinforcements. Table 3. Concrete batch mix design.
3.3 Specimen Types, Design, and Fabrication3.3.1 GeneralFour different types of reinforced concrete specimens were fabricated by the Florida Department of Transportation State Materials Office (FDOT-SMO) in Gainesville, FL. The specimens include the following:
The first two specimen designs were intended to simulate a northern bridge deck or slab exposed to chlorides from either deicing salts or sea water, whereas the latter two specimens represent a marine substructure element. The SDS specimens underwent exposure at FAU, the MS and 3BTC specimen underwent exposure at the FDOT-SMO Corrosion Laboratory, and the FC underwent exposure at the Intracoastal Waterway site at Crescent Beach, FL. The STD consisted of all straight bars in the as-received condition in concrete compacted according to ASTM C192.(20) However, other specimens employed variations of this according to the description and nomenclature listed in table 4. Table 4. Listing of the various specimen types, variables, and the nomenclature for each.
Prior to casting, the reinforcement was degreased by cleaning it with hexane. Next, heat shrink tubing was applied at the bar ends to provide an electrical barrier at the concrete-reinforcement interface. This process left only the center portion of the reinforcement to within approximately 25 mm of the concrete surface exposed. The casting procedure was similar for all specimen types. This process involved placing freshly mixed concrete in the specimen molds in two lifts, followed by consolidating each lift for 20 s to 30 s on a vibration table. The first lift filled the specimen mold approximately half full, and the second lift filled the mold completely. The surface of the specimens was troweled smooth using a wooden or metal float. After 24 hours, the molds were dissembled. The specimens were removed, placed in sealed plastic bags, and stored for 6 months. The design of the four specimen types is provided below. 3.3.2 Design and Fabrication of Simulated Deck Slab (SDS) SpecimensSDS specimens were fabricated with six bars, three of which comprised a top layer and three a bottom layer, as illustrated schematically in figure 5. The heat shrink tubing at the bar ends is not depicted in the figure.
Figure 5. Chart. Standard SDS specimens. Concrete cover for all of the bars was 25 mm, and triplicate specimens were prepared for each bar type and specimen variable (described subsequently). Because of the large inventory of specimens, fabrication and delivery to FAU occurred at six different times. The interim report provides results for the exposure of the initial three specimen lots (lots 1-3), and data for these have been updated in this report.(19) In addition, data acquired from the final three lots (lots 4-6) are presented and discussed. Specimens in lots 4-6 are listed in table 5. Table 5. Listing of SDS specimens in lots 4-6.
- indicates that no specimen was fabricated. A distinction between the initial and final three lots is that heat shrink end sleeves were not installed on bar ends of the specimens in lots 1-3. Because of the concern that the absence of sleeves on bars of the initial three lots may have resulted in premature corrosion initiation where rebars exited the concrete, replicates of BB, 3Cr12, MMFX-2, and 2101 reinforced specimens (these were the only STD type specimens that initiated corrosion) were included in lot 5. Otherwise, specimens in lots 4-6 consisted of reinforcement types/specimen configurations that were not present in lots 1-3. Figure 6 illustrates the nomenclature that was adapted to identify a standard specimen. 4-STD2-SMI-3
Figure 6. Chart. Example nomenclature for standard specimens. There were six specimen lots, and these correspond to the order in which they were fabricated and delivered to FAU by FDOT. Likewise, designation of specimens that were non-standard (BCAT, CCON; see table 4) is illustrated in figure 7. 4-CCON-3Cr12-2
7. Chart. Example nomenclature for non-standard specimens. Thus, the last digit identifies the above example as SDS specimen 2. The reinforcement is 3Cr12 with a simulated crack from lot 4. The default mix design (no indication) is STD1. Concrete mix designs STD1 and STD2 were employed for Type 304SS and SMI bars but with most specimens being prepared using the former. Eight different modifications to the above standard SDS specimen configuration were prepared and exposed, as listed and described below.
Figure 8 illustrates this specimen type schematically. Reinforcement types in lots 4-6 SDS specimens that employed this configuration were Type 304SS and SMI.
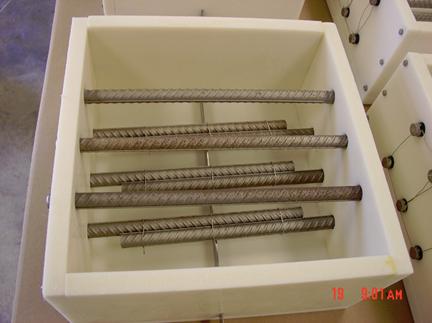
Figure 8. Chart. Schematic illustration of the CREV type simulated deck slab specimens. Upon delivery to FAU, an electrical connection was established between bars in both layers of each slab using a stainless steel wire in conjunction with a drilled hole and connection screw at one end of each bar. Periodically, a 10
Figure 9. Photo. View of a mold for a CCRV-SMI specimen prior to concrete pouring.
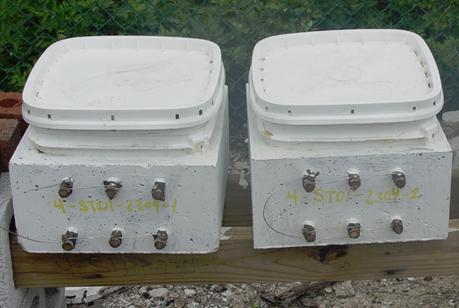
Figure 10. Photo. Two SDS specimens under exposure.
Figure 11. Photo. SDS specimens under exposure in the outdoor test yard. Monitoring the potential of electrically connected bars of individual specimens and of voltage drop between bar layers was performed weekly. The onset of active corrosion was defined as having occurred if a measureable voltage drop was detected for two consecutive measurement periods. This detection limit corresponded to a current of 0.1
3.3.3 Design and Fabrication of Macrocell Slab (MS) SpecimensThe design for the MS specimens is a modification of the standard G109 geometry and consisted of either a single straight or bent top bar and four straight bottom bars. The latter was positioned at two elevations beneath the top bar. This geometry is illustrated by figure 12. The standard condition was with the reinforcement wire brushed (ARWB), but one set was prepared with bars as received. The STD1 specimens were fabricated with and without a simulated crack, but specimens based upon the STD2 concrete mix were of the standard type only (no crack).
Figure 12. Chart. Geometry of the macrocell slab type specimen with both bent and straight bars. The types of specimens that were fabricated are indicated in table 4 with individual specimens identified according to the same convention that was explained above for SDS specimens. However, "MS" is included in the nomenclature. Subsequent to curing, the specimens were inverted relative to the orientation at casting, and a 76 mm by 152 mm plastic container for ponding was attached to what had been the bottom cast face. The top bar was wired to the four lower bars through a 1 Figure 13 shows a photograph of three MS specimens, and figure 14 is a perspective view of the outdoor exposure. For both the controlled and ambient outdoor exposures, potential was recorded monthly, as was the current for the controlled temperature/relative humidity specimens. The current for the outdoor exposed specimens was recorded daily via an Agilent 34970A data acquisition system.
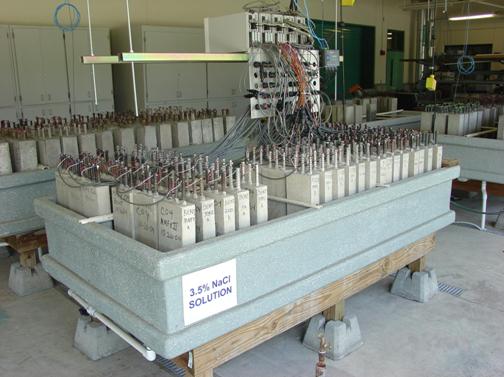
Figure 13. Photo. Three MS specimens under exposure.
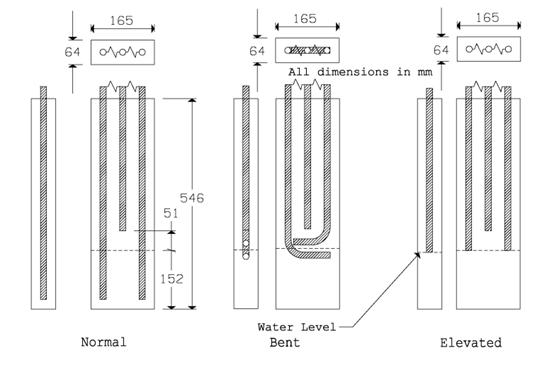
Figure 14. Photo. MS slab specimens under exposure. 3.3.4 Design and Fabrication of 3-Bar Tombstone Column (3BTC) SpecimensAs noted previously, the 3BTC specimens were intended to simulate a marine bridge substructure element. Three bar configurations-normal (STD), bent (BENT), and elevated (ELEV)-were prepared, as illustrated in figure 15. Concrete mixes STD2 and STD3 (table 3) were employed.
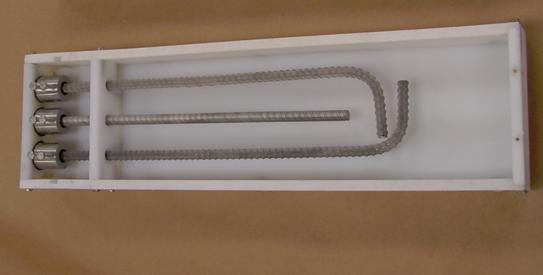
Figure 15. Chart. 3BTC specimen for each of the three bar configurations. Figure 16 shows a photograph of bars of the bent configuration in a mold prior to concrete placement. The bar clamping and alignment method that is illustrated in the figure serves to maintain the intended cover (24 mm) to within close tolerance. The normal reinforcement configuration has been employed by the FDOT for more than 10 years, and it is intended to provide baseline data that can be compared to results from previous studies. On the other hand, the bent bar configuration was considered particularly relevant in the case of stainless clad and possibly MMFX-2 reinforcements because of the possibility of clad or surface layer cracking. Reinforcements that were employed were BB, 3Cr12, MMFX-2, 2101, Type 316, Type 304 SS, and SMI. Six specimens with each rebar type were prepared for the STD2 and STD3 BB type specimens. Otherwise, the number of specimens was three.
Figure 16. Photo. Type 304 rebars of the bent configuration in a mold prior to concrete placement. Figure 17 is a photograph of a specimen after casting. Prior to exposure, a 1
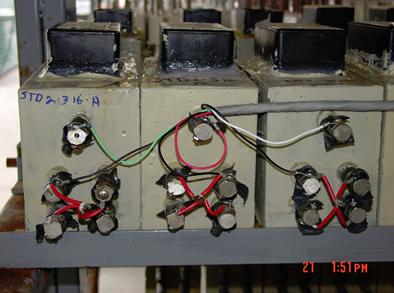
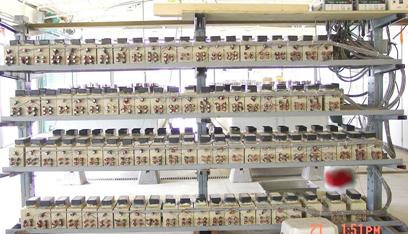
Figure 17. Photo. 3BTC specimen. Figure 18 shows specimens under exposure in the outdoor screened room at the FDOT-SMO Corrosion Laboratory. Once exposure was initiated, potential of all three bars coupled, and voltage drop across the two resistors for each specimen was measured daily utilizing a pair of Agilent 34970A data acquisition systems. Exposure of individual specimens was terminated upon concrete cracking or appearance of visible corrosion product bleed-out.
Figure 18. Photo. 3BTC specimens under exposure. 3.3.5 Design and Fabrication of Field Column (FC) SpecimensFC specimens were based upon the STD1 concrete mix design with bars only in the as-received condition. Figure 19 illustrates the specimen geometry. The reinforcements that were employed were BB, 3Cr12, MMFX-2, 2101, Type 316.16 SS, Type 304 SS, and SMI with end caps. Each bar was electrically isolated from the others during exposure and potential measurements. The columns were exposed in the Intracoastal Waterway at Crescent Beach, FL by jetting the lower 1.2 m in sand such that mean high water was approximately 1.8 m from the specimen bottom. Placement was delayed because of environmental permitting issues, but it commenced in September 2005.
Figure 19. Chart. Geometry of the field column type specimen. Figure 20 is a photograph of the specimens installed at the exposure site. A single potential was measured for each of the four bars by placing a copper-copper sulfate electrode in the moist sand near the base of the column. Polarization resistance (Rp) of one bar in each column was determined using an embedded Ti electrode as reference and one of the other three bars as a counter electrode. A cyclic polarization scan was performed to calculate total resistance (Rt), and solution resistance (Rs) was determined using a three-point resistance test. Finally, Rp was calculated as Rt − Rs. These measurements were performed at the time of initial exposure and at approximately 6-month intervals subsequently until corrosion-induced cracking or visible corrosion product bleed-out was observed.
Figure 20. Photo. Field column specimens under exposure at the Intracoastal Waterway site in Crescent Beach, FL. Table 3.8 to table 3.13 of the interim report list all of the specimens of each of the four designs that had been deployed as of that submission.(19) Those tables are reproduced here as table 6 to table 11. Shaded cells in these tables indicate specimens that had not been fabricated at the time the earlier report was prepared, but these were included in the inventory for lots 4-6 (see table 1). Table 6. Listing of specimens reinforced with 316.18 and 3Cr12.
- indicates that no specimen of the indicated type was fabricated. Table 7. Listing of specimens with 2101 rebar.
- indicates that no specimen of the indicated type was fabricated. Shaded cells indicate that specimens of his type had not been fabricated at the time of the earlier report. Table 8. Listing of specimens reinforced with MMFX-2.
- indicates that no specimen of the indicated type was fabricated. Table 9. Listing of specimens reinforced with Stelax.
- indicates that no specimen of the indicated type was fabricated. Shaded cells indicate that specimens of this type had not been fabricated at the time of the earlier report. Table 10. Listing of specimens reinforced with SMI.
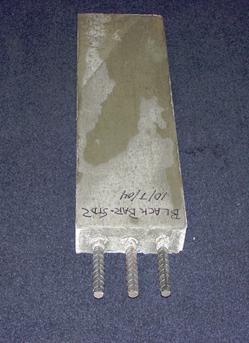
- indicates that no specimen of the indicated type was fabricated. Shaded cells indicate that specimens of this type had not been fabricated at the time of the earlier report. Table 11. Listing of specimens reinforced with black bar.
- indicates that no specimen of the indicated type was fabricated. 3.4 Specimen Terminations and Dissections3.4.1 Termination and Dissection of Simulated Deck Slab (SDS) Specimens
Figure 21. Chart. Concrete sectioning for SDS specimens. SDS specimens that became active and were designated for dissection were opened and evaluated. First, testing and exposure were terminated, and the ponding bath was removed. Next, two saw cuts were made; each of them were perpendicular to the top surface and parallel to and at mid-spacing between the center and each of the two outer bars of each layer. For each of the three resultant specimen parts, a further saw cut was made on each of the previous saw cut faces and on what had been the two specimen side faces opposite and parallel to the top rebars to a depth approximately 10 mm from each rebar. In some cases where corrosion of bottom layer BB was thought to have occurred, this procedure was also performed at the level of these bars. Each specimen section was then split open by placing a chisel in one of the previous saw cuts and tapping gently with a hammer until a fracture occurred. This split created a fracture that exposed both the rebar and its trace, which were then examined for corrosion and photographed. Figure 21 schematically illustrates the location of concrete cuts, as listed above. 3.4.2 Termination and Dissection of Macrocell Slab (MS) SpecimensDissection procedures for these specimens were essentially the same as for the SDS specimens, as described previously. 3.4.3 Termination and Dissection of 3-Bar Tombstone Column (3BTC) Specimens
Figure 22. Chart. Concrete sectioning for 3BTC specimens. Dissection of the 3BTC specimens was performed by making a saw cut to the steel depth on the front and back faces along both longer bars starting at the bottom of the specimens and extending up about 0.25 m or more if visual cracking was apparent beyond this. A cut to the steel depth was then made on the front and back faces perpendicular to the reinforcement bars at the 0.25 m elevation across the width of the specimens or just above the highest reaching crack. Once all of the cuts were made, a hammer and chisel were used to split off the cut portion of concrete and expose the reinforcement. Figure 22 provides a schematic illustration of these cuts on a specimen. 3.4.4 Termination and Dissection of Field Column SpecimensNo dissections have been made on FC specimens due to a lack of an environmental permit to remove them from the test site. 3.5 Chloride AnalysesConcrete samples for [Cl-] determinations were acquired from SDS specimens according to two methods. Both were performed as soon as possible once all of the top layer bars had initiated corrosion, as explained previously. The first method involved acquiring a 75-mm-diameter core from the top concrete surface at the mid-spacing between two adjacent top layer bars. This core was then dry sliced parallel to the top surface at 6.4 mm intervals, and the individual slices were separately ground to powder. The second method involved individually mounting the concrete sections from the top portion of each specimen on a mill and milling a cut approximately 0.6 mm deep along that portion of the rebar trace that was void of corrosion products using a 10-mm-diameter square end cutter. Figure 23 illustrates this process schematically. For both methods (coring and milling), the powder samples were analyzed for [Cl-] using the FDOT wet chemistry method.
Figure 23. Chart. SDS specimen milling along rebar trace to acquire powdered concrete for chloride analysis. Previous | Table of Contents | Next
|
|||||||||||||||||||||||||||||||||||||||||||||||||||||||||||||||||||||||||||||||||||||||||||||||||||||||||||||||||||||||||||||||||||||||||||||||||||||||||||||||||||||||||||||||||||||||||||||||||||||||||||||||||||||||||||||||||||||||||||||||||||||||||||||||||||||||||||||||||||||||||||||||||||||||||||||||||||||||||||||||||||||||||||||||||||||||||||||||||||||||||||||||||||||||||||||||||||||||||||||||||||||||||||||||||||||||||||||||||||||||||||||||||||||||||||||||||||||||||||||||||||||||||||||||||||||||||||||||||||||||||||||||||||||||||||||||||||||||||||||||||||||||||||||||||||||||||||||||||||||||||||||||||||||||||||||||||||||||||||||||||||||||||||||||||||||||||||||||||||||||||||||||||||||||||||||||||||||||||||||||||||||||||||||||||||||||||||||||||||||||||||||||||||||||||||||||||||||||||||||||||||||||||||||||||||||||||||||||||||||||||||||||||||||||||||||||||||||||||||||||||||||||||||||||||||||||||||||||||||||||||||||||||||||||||||||||||||||||||||||||||||||||||||||||||||||||||||||||||||||||